Deformation of inherent structures to detect long-range correlations in supercooled liquids
Abstract
We propose deformations of inherent structures as a suitable tool for detecting structural changes underlying the onset of cooperativity in supercooled liquids. The non-affine displacement (NAD) field resulting from the applied deformation shows characteristic differences between the high temperature liquid and supercooled state, that are typically observed in dynamic quantities. The average magnitude of the NAD is very sensitive to temperature changes in the supercooled regime and is found to be strongly correlated with the inherent structure energy. In addition, the NAD field is characterized by a correlation length that increases upon lowering the temperature towards the supercooled regime.
pacs:
61.43.Fs,64.70.Q-,05.20.JjI Introduction
Many liquids, when quenched fast enough, enter a supercooled regime that is signaled by an enormous increase in viscosity eventually leading to glass transition. Several experimental as well as theoretical studies have shown an accompanying qualitative change of the dynamics: While individual particle dynamics dominate at high temperatures, particle motions become increasingly more cooperative and heterogeneous as the temperature is lowered Wolynes_CRR ; Russel_coop ; Ediger_coop . From the sizes of cooperatively rearranging regions, a growing dynamical length scale can be extracted near the glass transition Glotzer_length99 ; Ludo_Science05 ; Weeks_correlatedmotion .
One of the most puzzling features of the supercooled regime and the glass transition is the apparent lack of structural changes underlying the dramatic slowing down of the dynamics. Some progress has recently been achieved in linking structural and dynamical changes near the glass transition. For a two-dimensional model system, a connection between dynamical heterogeneities and local crystalline order was suggested in Tanaka_DHandPsi6 . Such a connection appears to be absent in a different two-dimensional system, where instead dynamical heterogeneities seem to be correlated with local, short-time dynamics Harrowell2006 and localized soft modes WidmerCooperSoftModes . A somewhat different path has been followed by several researches, trying to relate dynamical properties to inherent structures, which are the local minima of the collective potential energy StillingerWeberIS ; StillingerWeberIS2 ; Debenedetti_review ; Heuer_ISreview . It has been shown that inherent structures govern mechanical properties of amorphous solids Malandro ; Lemaitre06 ; Fabien_prl . For supercooled liquids, more and more evidence has been collected that qualitative changes in the dynamical behavior are accompanied by changes in the inherent structures SastryIS ; SastryIS_fragile ; Debenedetti_review . The local diffusivity, for example, was suggested to be related to the basin depth of local inherent structures LaNave_DiffandIS . Similarly, unstable modes of saddle points in the energy surface were found to be of major importance, not only for the mobilities of particle clusters Pastore_localsaddle but for the glass transition in general Parisi_geometricGlass . Collective rearrangements in the inherent structures corresponding to the dynamics of supercooled liquids are reported in Bailey_avalancheinIS . Specially designed simulations probing point-to-set correlations that are inspired by random first order theory have revealed evidence for growing amorphous order in the supercooled regime Biroli_overlapRFOT . In some very recent works, external forcing is applied to (some parts of) the system in order to extract characteristic sizes of cooperative regions using mode-coupling inhomMCT or density functional theory Yoshidome . Under shear flow, it was found numerically that cooperative, mobile regions can form anisotropic bands FuruTanaka_anicooperative09 .
We have found striking similarities in the onset of cooperative behavior in dynamics and in the non-affine part of the inherent structure response to external deformations ema_mismatch . That approach was motivated by a recent theory hco_glass based on a general framework of non-equilibrium thermodynamics. This thermodynamic treatment requires information about the system’s response to an applied, static deformation and suggests that the reversible part of glassy dynamics changes considerably when approaching the glass transition. Above the glass transition, the particles can follow an imposed deformation more or less freely, whereas closer to the glass transition the particle movement becomes a hopping-like transition between different basins of attraction of the underlying inherent structures StillingerWeberIS ; schroder_ISdynmamics . By imposing static deformations of inherent structure configurations, we observed indeed a profound difference in the NADs when approaching the glass transition. From a systematic finite-size scaling analysis, we found that the NAD field is characterized by a static correlation length, that is growing as in usual critical phenomena Majid_criticallength ; Majid_thesis . This length detects growing structural correlations underlying the growing dynamical length scale obtained from particle dynamics Glotzer_length99 ; Ludo_Science05 ; Sastry_growinglength .
Here we present an extensive study of the NAD field introduced in ema_mismatch ; Majid_criticallength , that further demonstrates how this quantity can effectively detect the onset of the cooperative dynamics and shows a great potential to probe the underlying structural correlations. The distribution of lengths changes from exponential to power law upon entering the supercooled regime, and we can rationalize such change in terms of a crossover from a viscous liquid to a regime dominated by elastic effects. The mean displacement length depends exponentially on the inherent structure energy, as we also discuss using a simple toy model, and confirms the existence of two well-distinguished regimes as a function of the temperature. We analyze different measures of correlations in the direction of the NAD field and discuss their analogies with observations in the dynamics Weeks_correlatedmotion . Finally we use a coarse-graining procedure to extract the characteristic size of correlated regions observed in the snapshots: we discuss different definition of this length-scale and we perform a finite-size scaling analysis over different model systems, confirming the critical-like behavior at low temperatures.
The paper is organized as follows. The model glass formers used and the numerical simulations are described in Sect. II. In Sect. III, we briefly review the method proposed in ema_mismatch to extract displacements of inherent structures. Our numerical results for the NAD are presented in Sects. IV and V. Correlations between these displacements are analyzed in Sect. V. We focus in Sec. IV on characterizing the NAD lengths and we introduce a simple model to rationalize the results. In Section VI we extensively describe the coarse graining procedure for the analysis of the NADs introduced in Ref. Majid_criticallength and apply it to the different model systems to extract the temperature and system size dependence of the correlation length. Sect. VII contains further discussion and conclusions.
II Model description
The studies presented in this paper are based on computer simulations of two different, well-established models for structural glasses (see e.g. Andersen_review05 ).
The first model is the three-dimensional, binary mixture of Lennard-Jones (BMLJ) particles introduced by Kob and Andersen KobAndersen_1995a . Both particles have unit mass and interact via a Lennard-Jones potential, , where the diameters and interaction energies are given by , , , , , and . We have chosen as the unit of length and as the unit of energy. The potential is truncated and shifted to ensure , where the cut-off distance is chosen as .
The second model considered in this study is a 50:50 binary mixture of soft spheres (BMSS) in three dimensions Biroli_overlapRFOT . Both particle types have unit mass and the interaction potential is given by , , , where the sizes of particles are fixed by setting and the effective diameter to one; that is . is the unit of length and density is chosen to be . A smooth cut-off is used by setting the potential to for and for . The values of , and are fixed by imposing the continuity up to second derivative for .
The potential is then shifted to ensure that .
| abbr. | potential | A:B | ||
|---|---|---|---|---|
| BMLJ | 80:20 | |||
| BMSS | 50:50 |
Main parameter values for the two models are shown in Table 1. For ease of notation, we use the same symbols for original and reduced quantities.
For both model systems studied here, we have carefully prepared 10-100 independent samples for each temperature by molecular dynamics simulations starting from statistically independent, random initial configurations. Periodic boundary conditions were used in all cases. We have studied systems with number of particles varying from up to , but most of the data here refer to systems with . The simulations were performed with the molecular dynamics simulation package LAMMPS lammps . The initial particle configurations were equilibrated at several decreasing values of temperature in the range (BMSS), and (BMLJ). Comparing these temperature intervals with the mode-coupling temperature given in table 1, our simulations cover the high temperature regime down to the supercooled state and extend below the mode-coupling temperature. For all systems, slowly cooling the configurations towards low temperatures was achieved by coupling the system to Nosé-Hoover thermostat with prescribed, slowly decreasing temperature protocol. When the target temperature was reached, the temperature of the thermostat was held constant and the system was equilibrated at this temperature still in contact with the thermostat. We verified that no significant drift in the internal energy nor in the kinetic temperature could be observed after the thermostat was switched off and the system was further evolved, now in the microcanonical ensemble. To test the equilibration of samples, we also compared the kinetic () with the configurational temperature () Evans_Tconf . The kinetic temperature is defined by , where denotes the number of degrees of freedom. While the kinetic temperature is entirely determined by the particle velocities, the configurational temperature depends on the positions of the particles via . Here, denotes the total force on particle and . We verified that kinetic and configurational temperature agree for our equilibrated samples within numerical uncertainties. Finally, we calculated two-time correlation functions and verified that no significant aging was observed in the equilibrated samples for a waiting time of the order of , where is the structural relaxation time.
III Method for extracting NAD
To extract non-affine particle displacements we proceeded as proposed in our earlier work ema_mismatch . In order to make the paper self-contained and settle the notation, we briefly review this method here.
III.1 Affine deformations
We apply static, affine shear deformations to the particle configuration by mapping the particle positions , with , where denotes the deformation amplitude. Since we aim at the non-affine part of the inherent structure deformations hco_glass , we suggested in ema_mismatch the following procedure, summarized schematically in Fig. 1: start with configuration at a given temperature . Prepare one configuration by first applying the static deformation and subsequently finding the inherent structure corresponding to this deformed configuration. The other configuration is prepared by first finding the inherent structure corresponding to the initial configuration and after that subjecting the inherent structure configuration to the same deformation. Almost all subsequent analysis is based on the comparison between the configurations and , which we denote as non-affine displacement (NAD), . Thereby, we focus on the dependence of the NAD on the temperature of the initial configuration and the amplitude of the applied deformation. We ensure that the total displacement vanishes, , since a rigid translation can always be added and does not contribute to the NAD.
III.2 Inherent structure generation
From the equilibrated samples, we generate inherent structure (IS) configurations by minimizing the potential energy via the conjugate gradient method Stillinger_return . The minimization is stopped when the potential energy change is less than a tolerance value . We verified that the results are insensitive to a further decrease of the tolerance level and that the mean inherent structure energies for different temperatures agree well with published data dePablo_DOSMCglass ; SastryIS ; Cammarota_spinodal09 . For generating the inherent structure of deformed configurations, , the minimization is performed in a deformed simulation box or, equivalently, using Lees-Edwards boundary conditions.
III.3 Inherent structure properties
Inherent structures can be characterized by their mean energy . In the inset of Fig. 2 we plot of the inherent structure as a function of . Starting from a high temperature plateau, decreases upon cooling in the so-called landscape dominated regime Debenedetti_review . In addition, we have performed various types of structural analysis on the IS of different model systems, using for example pair correlation functions, coordination numbers or bond order parameters, to characterize the differences between the particle configurations in the initial state and in the IS. As an example, in Fig. 2 we plot the averaged bond orientational order parameter for the model BMLJ. is calculated by averaging, for each temperature, over independent samples of particles, the -th order bond orientational order parameter Steinhardt with . For particle , this quantity is calculated as
| (1) |
where is the locally averaged bond orientational order parameter of order and degree as is defined in Steinhardt ; Tanaka_critical . In the main frame of Fig. 2, is plotted as a function of temperature for the starting configuration and its inherent structure . We observe that, in the range of temperatures where displays a strong dependence on , the th order averaged bond orientational order clearly increases for both and . Also, as expected, the value obtained for is larger. In spite of this, the values of are consistently much lower than those expected for various crystal lattices (e.g. for perfect icosahedral ordering), demonstrating that there is no significant crystallinity present in the and configurations Aste .
IV Characterizing the NAD field
We have applied the procedure described in Sec. III to well-equilibrated configurations of the two model systems. Various temperatures of the initial configurations as well as different deformations are considered. Results are obtained as averages over independently generated configurations and error bars are calculated from the standard deviation.
IV.1 Distribution of NAD vectors
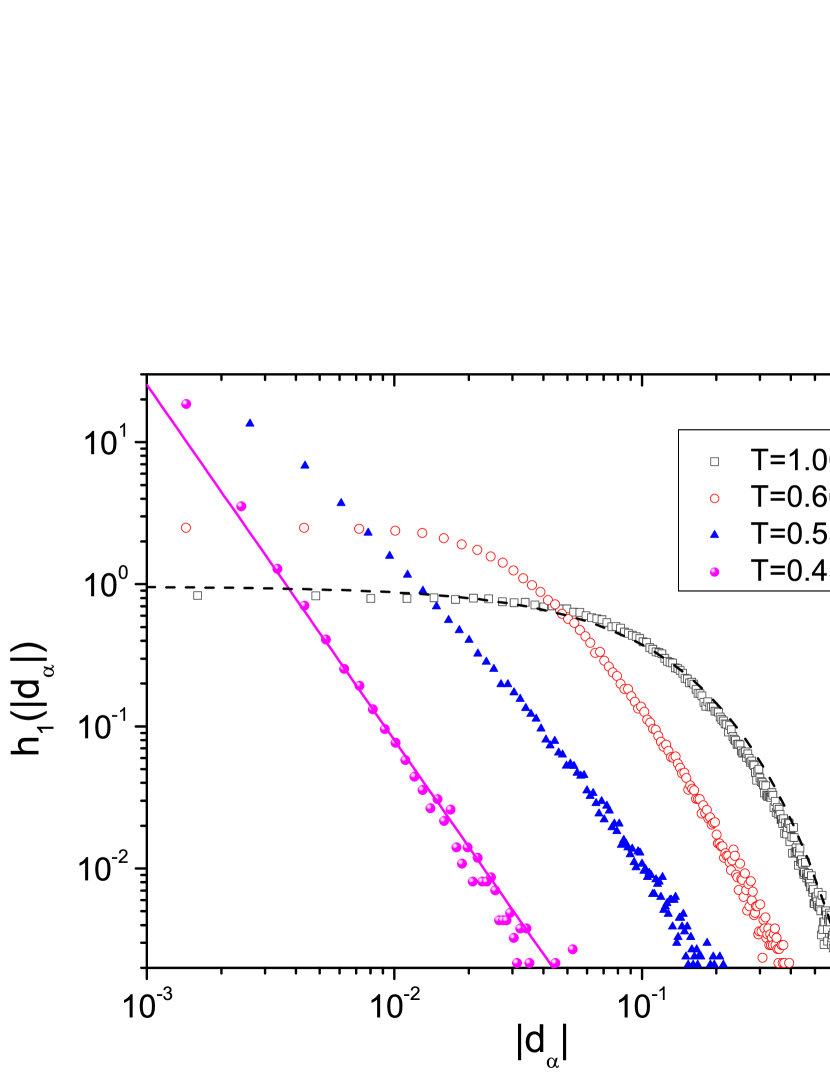
We start by characterizing the distribution of the NAD vectors . For the small deformations we are interested in, the distribution is found to be isotropic for homogeneous deformations and covers a range of displacement magnitudes. We therefore conclude, that our regime of deformations is strong enough to allow the escape from local minima. On the other hand, the deformations are small enough such that no obvious trace of the imposed shear geometry is seen in . This can be seen from Fig. 3, which shows the distribution of the Cartesian NAD components , . The distributions show a maximum at . At high temperatures, decays exponentially, , with fit parameter of the order of the mean NAD length at this temperature. This behavior is reminiscent of the exponential distribution observed in Ref. Bailey_avalancheinIS , also with , for displacements between inherent structures corresponding to the system’s dynamics.
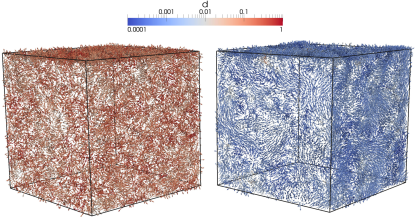
This finding indicates again that the non-affine inherent structure deformations bear remarkable similarities to dynamical properties. At low temperatures, the distribution is much narrower, in agreement with the impression from the snapshots shown in Fig. 4. More quantitatively, one finds that the distribution at low temperatures is no longer decaying exponentially but seems to exhibit power-law tails with an exponent approaching at the lowest temperatures investigated, see the solid line in Fig. 3. It is interesting to note, that the power-law distribution is predicted for the induced radial displacements in an elastic continuum around an expanded spherical shell Dyre99 ; Dyre99_II . If we can identify the latter with localized rearrangements, the qualitative change of the NAD distribution from exponential to a power-law at lower temperatures apparently indicates the crossover from a viscous liquid to a regime with more pronounced elastic effects. From the goodness-of-fit, we determine the crossover temperature where the power-law and exponential distributions fit equally well to the data. We find the crossover temperature to be located in the interval for the BMLJ model (data not shown).
IV.2 Mean Mismatch length
A first characterization of the NAD field is provided by their mean length,
| (2) |
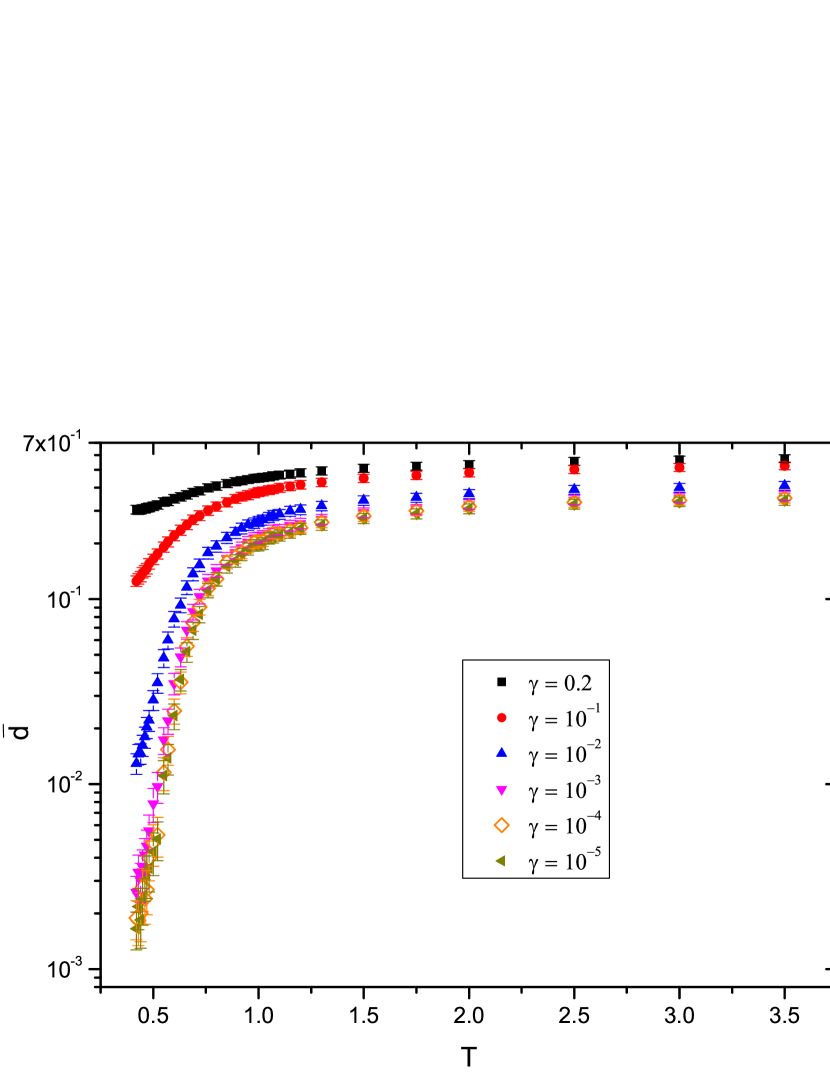
where the ensemble average is performed over the independently generated samples. Figure 5 shows as a function of temperature for homogeneous deformations of different strengths for the BMLJ model. Depending on the value of , we distinguish three different regimes. For small values of (), we find that is essentially independent of . This is an interesting observation as it suggests that we have reached a regime of weak perturbations, where details of the local deformation are less important for . Moreover, decreases drastically, by roughly two orders of magnitude, as the temperature is lowered from to . For larger deformations , the decrease of gets less and less pronounced, until becomes essentially independent of temperature for deformations . The particular form of the drastic decrease in depends on the model system. Qualitatively, however, the observations are the same also for the BMSS model.
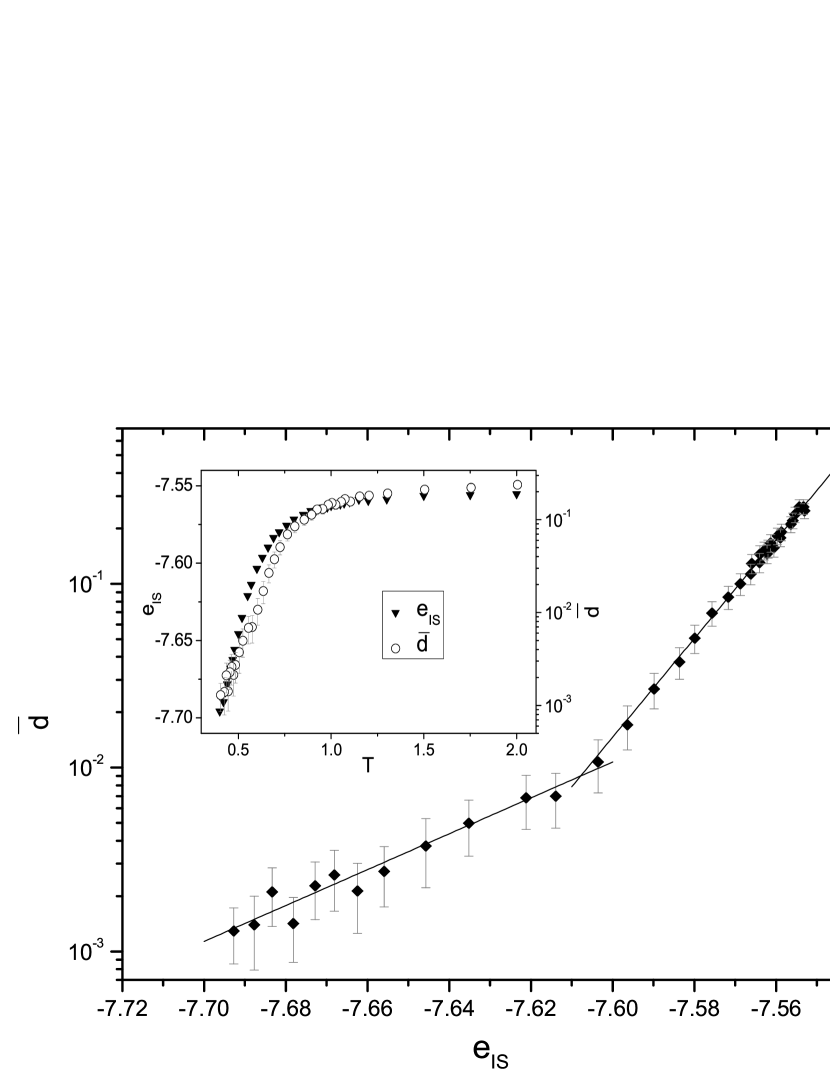
The decrease of with temperature for small deformations shown in Fig. 5 is quite similar to the decrease of the inherent structure energy (see Heuer_ISreview and the inset of Fig. 5). Therefore, we parametrically plot in Fig. 6 the average NAD length versus for the different temperatures investigated. Our result indicate that is indeed strongly coupled to the inherent structure energy. From Fig. 6 we observe that increases exponentially with the inherent structure energy. More quantitatively, we observe a crossover from , at low temperatures to , at higher temperatures. Since the mean inherent structure energies vary inversely proportional with temperature in the landscape-influenced regime Heuer_ISreview , we find that with a different constant in the two regimes. The crossover from to takes place at , which corresponds to a temperature , near to the inflection point of , see the inset of Fig. 5.
IV.3 Simple toy model for inherent structure NAD
Several features of the NAD field can be rationalized using a simple toy model. Let denote again the state of our system and its closest minimum (inherent structure). For simplicity, however, the toy model describes these states by a single scalar variable. The imposed deformation of strength deforms these configurations to and , respectively, where denotes an average amount of displacement. The inherent structure of the deformed system is , where denotes a typical size of an inherent structure basin. The integer takes values , with corresponds to staying in the same minimum, to the nearest minimum, etc. The NAD is therefore given by and its mean squared average by
| (3) |
In Eq. (3), we have introduced the probabilities of finding in the -th nearest minimum. In the limit of , we find that , i.e. the NAD length is given by the imposed deformation. This is the case for extremely low temperatures and/or vanishing deformations, not considered in the present study. For very large deformations compared to the basin size , we expect equal probability of entering a basin in the neighborhood around , where . Therefore, for and zero else. Inserting this expression into Eq. (3) we find . Hence, in the case of very large deformations, the average NAD is expected to approach a limiting value. The simulation data in Fig. 5 seem to indicate such a trend. However the mean length remains weakly sensitive to temperature variations at the largest deformation investigated.
Finally, we consider the case of rather small deformations, where one can approximately set for . The important quantity is then , the probability of leaving the basin at the imposed deformation . Accounting in a rough way for the equilibrium distribution within the basin, we assume , where denotes a typical energy barrier and . The values of are restricted to in order to ensure proper probabilities for all temperatures. With these assumptions, the mean NAD becomes
| (4) |
where we have assumed , i.e. the important length for the imposed displacement is the typical basin size. Equation (4) predicts a number of features that can be tested by simulations. First, for high temperatures, reaches a limiting value independent of temperature, in agreement with simulation results Majid_thesis . This limiting value decreases as increases towards its maximum value. Second, for small deformations , Eq. (4) simplifies to and predicts a square-root increase of with the strength of imposed deformation. In the simulations for the BMLJ model, indeed increases with , the exponent, however, changes with temperature from at to at Majid_thesis . Third, when the temperature is decreased, Eq. (4) predicts a decrease of according to the Boltzmann factor. This is in agreement with the results discussed in Sec. IV.2 (see also Fig.6). Finally, Eq. (4) shows an exponential dependence of the average NAD on the barrier height . If we can associate the inherent structure energy with an effective barrier height, this prediction is consistent with our numerical results (see Fig. 6). More quantitatively, we assume that the effective barriers are given by , where is the high-temperature plateau of the inherent structure energy and the coefficient describes the dependence of on in the low temperature regime, as introduced at the end of Section IV.2. A linear relation between mean inherent structure energies and barrier heights was indeed found numerically for low temperatures in the BMLJ model DoliwaHeuer and similarly in a binary soft sphere model Parisi_geometricGlass . For low temperatures, the mean inherent structure energy decreases as , where can be interpreted as the variance of the inherent structure energy distribution in the Gaussian energy landscape model Heuer_ISreview . In fact, we find in this regime that the height of effective barriers decrease linearly with temperature, for , where and . For the BMLJ model, we have , resulting in and . The value of the extrapolated barrier height is close to the one obtained from the mean waiting time for low-lying IS DoliwaHeuer .
Within the toy model Eq. (4), the crossover from low to high temperature behavior observed in Fig. 6 could be interpreted as different regimes in the potential energy landscape, with different relations between minima (inherent structures) and barrier heights. Interestingly, numerical simulations of randomly perturbed inherent structures for BMLJ model indicated that the number of saddles vanishes exponentially below fabricius_distanceIS , close to the temperature corresponding to the inflection point shown in Fig. 6 as evaluated at the end of Section IV.2.
V Correlations in the NAD field
Not only the length of the NAD vectors but also their spatial correlation change considerably between the liquid and supercooled regime. Spatial correlations in the NAD field can be clearly seen in the snapshots in Fig. 4 and were also reported in our earlier study ema_mismatch . In the following we thoroughly analyze them and use them to extract correlation lengths.
V.1 Correlated mobility and directions
We quantify correlations in the NAD field over a given distance and for deformation amplitude by
| (5a) | |||||
| (5b) | |||||
| (5c) | |||||
where denotes the distance between particles and and the average in the denominator is performed over all particles. The normalization is chosen such that , and for perfectly correlated particles and for uncorrelated displacements, . The same correlation functions were used in Ref. Weeks_correlatedmotion in order to study correlated displacements in hard sphere colloids. The first function, measures correlations in the mobility, i.e. the magnitude of the particle displacements (with the average subtracted), , whereas is sensitive to correlated directions. The latter distinguish longitudinal and transverse correlations of directions, with and , with the unit vector connecting particles and and .
Fixing the particle separation around the first neighbor shell and varying the deformation amplitude , we find that all three correlation functions (5) are rather insensitive to and start to decay only for (not shown). This value is consistent with the treshold value determined in Ref. ashwin for shear-induced transitions between different inherent structures. Since we observe correlated rearrangements at smaller , we would rather conclude that such large deformations induce transition between uncorrelated metabasins (see also Fig. 12). The behavior of and , as well as the relation found, are quite similar to the one observed in Ref. Weeks_correlatedmotion if our deformation is identified with a properly scaled time (for not too short times).
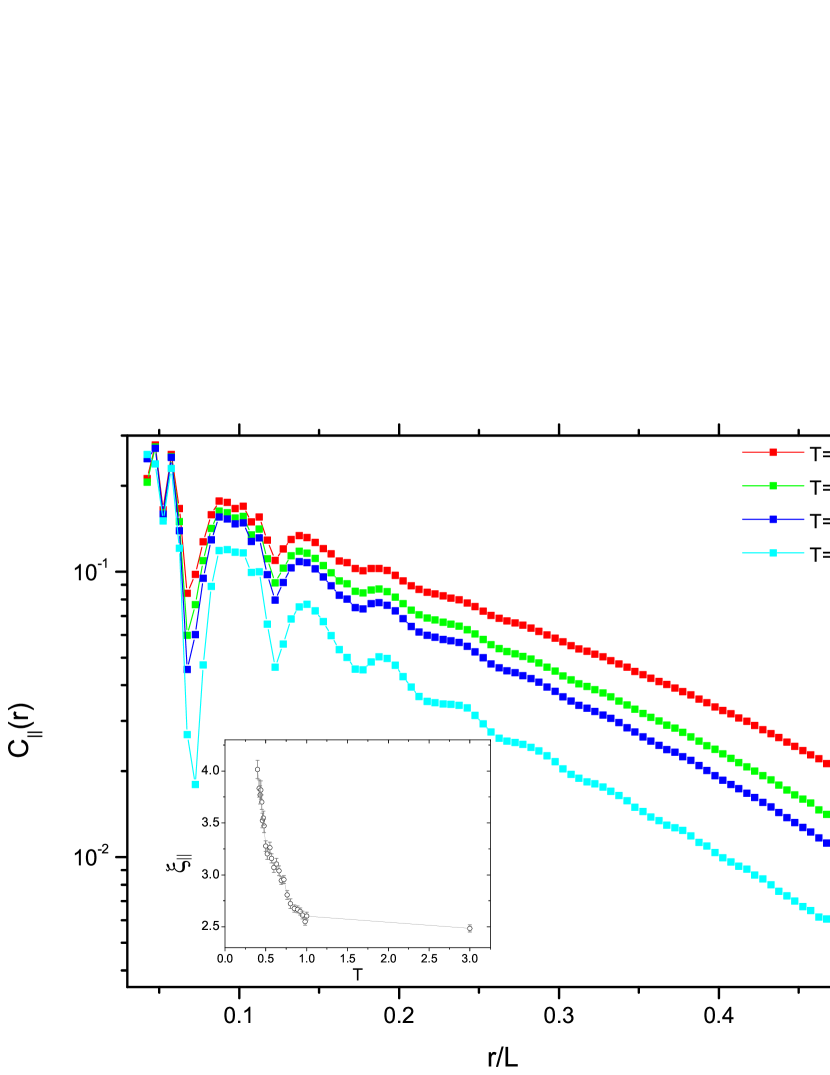
Next, we fix to a typical small value (), as already done in Sec. IV and study the spatial dependence of the correlation functions (5). We observe that the correlations in mobility measured by increase as the temperature is lowered, but the spatial extent remains within a few particle diameters. Even shorter ranged are the transverse correlations . The longitudinal correlations , however, increase significantly with decreasing temperatures as shown in Fig. 7. For small separations , the correlation functions oscillate due to the short-range ordering as measured by the pair correlation function. For larger separations (), the oscillations have decayed and we observe an exponential decrease . We find the correlation length to increase from at high temperatures to almost upon approaching the glass transition. Similar observations have been made in Ref. Chay_nonaffine in simulations of the NAD in amorphous solids and in Ref. Weeks_correlatedmotion for displacements in hard sphere colloidal systems when increasing the particle concentration. In the latter, however, the length scale was found to remain on the order of particle diameters, increasing significantly only beyond the glass transition. It was argued in Ref. Weeks_correlatedmotion that the long-range correlations of the longitudinal displacements reflect the string-like cooperative motion observed in computer simulations Donati_strings . If this is indeed the case, our findings suggest that these string-like motions arise due to underlying string-like rearrangements between nearby inherent structures. At larger distances, one would expect a hydrodynamic or elastic-like response where the correlations decay not exponentially but in three dimensions DiDonna . In agreement with Ref. Weeks_correlatedmotion , we find no indication of such a behavior, probably because the correlation function has already decayed to such small values that the numerical data do not allow us to detect the expected power-law.
VI Coarse-grained NAD
We investigate correlations in the direction of the NAD vectors with the help of a coarse-grained displacement field around every particle,
| (6) |
Here, we have defined the orientations and is the distance between particles and in the inherent structure of deformed configuration. , is the number of neighbours of particles within a distance , and if and zero else. Since the mean length of the NADs is strongly temperature-dependent (see Fig. 5), we use the normalized displacements in the definition (6) in order to separate this aspect and focus instead on the correlations between vector orientations.
When the coarse-graining length is smaller than interparticle distances, only one particle contributes to the average in Eq. (6) and . As increases, more and more particles are involved in the average and the magnitude of decreases. Figure 8 shows the function obtained for the BMLJ model when subjected to homogeneous shear deformation with amplitude . The expected decrease of with is indeed observed. For a fixed distance , increases monotonically with decreasing temperature. This behavior clearly indicates increasing correlations between particle’s NAD orientations as the temperature is lowered.
Moreover, Fig. 8 shows that these growing correlations extend over distances larger than the particles diameter. Since measures the root-mean-square NAD direction when averaged over a length , we expect to decay when exceeds the size of a correlated region. Therefore, the decay allows to define a length scale over which the NAD vectors are correlated Fabien_prl . At low temperatures, we find that is well described by an exponential decay over a wide range of smoothing lengths. The length scale that we obtain from a least-square fit to is shown in the inset of Fig. 8 as a function of temperature. At high temperatures (), an exponential decay of can be observed only in a narrow interval . In this regime, we find an approximately temperature-independent length scale of . This length scale is somewhat larger than the size of correlated liquid structure measured by the first peaks in the pair correlation function. Since local rearrangements have to include neighboring particles, it is not surprising that is on the order of a few particle diameter in this regime. For decreasing temperatures, we observe an increase of the correlation length to values of about particle diameters. Qualitatively, the same observations are made also for the BMSS model.
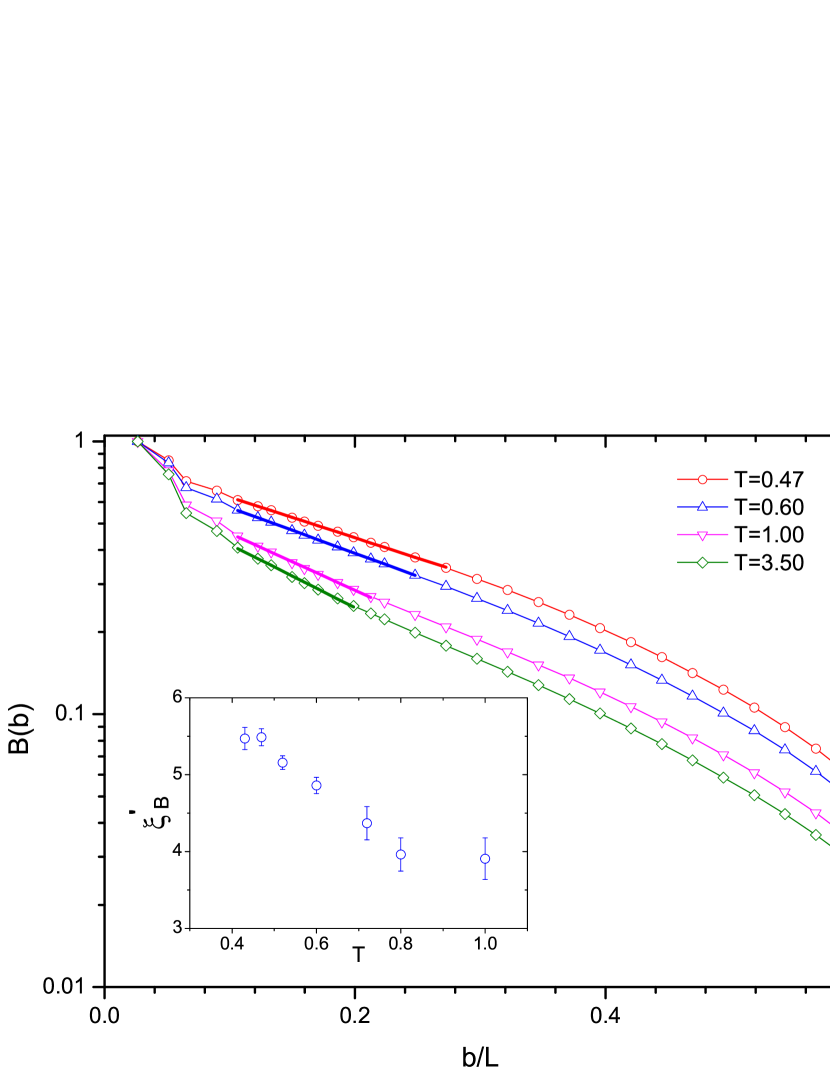
In order to quantify the correlations in the NAD vectors in a different way and to show that considering the magnitude in addition to the orientation does not alter the qualitative behavior, we use the same function proposed in Ref. Fabien_prl to study characteristic length scales of glasses,
| (7) |
In Eq. (7), denotes the coarse-grained NAD vector , which is the analogue to Eq. (6) for the NAD instead of their unit vectors. By construction, the function has very similar limiting behavior as . For large , vanishes since corresponds to a rigid translation of the whole system and is conventionally set to zero. For small , and approaches one. Figure 9 shows the function for the BMLJ model subject to homogeneous deformation with . We observe a very similar behavior of compared to . Thus, the qualitative conclusions are robust and hold for different definitions of coarse-graining functions. For a more quantitative comparison, we extract the correlation length analogous to above from the decay (see also the supplementary information of Ref. Majid_criticallength . The growing length scale, extracted by least-square fitting an exponentially decaying function to the data is plotted in the inset of Fig. 9. The length scales and not only show a very similar temperature-dependence but are also quantitatively quite similar.
VI.1 Static length scale from histogram of coarse-grained NAD
In addition to the quantities and that are averages of the coarse-grained NAD, we have also studied the distribution of the coarse-grained NAD orientations and extracted a correlation length directly from them. This correlation length displays the same type of temperature dependence of and and it is also quantitatively consistent with them.
For small coarse-graining distances , only a single particle contributes to the sum in Eq. (6). Hence the histogram of values is peaked around , . When coarse-graining over larger and larger distances , successively decreases and therefore accumulates more weight at small values of until becomes strongly peaked near when becomes large Majid_criticallength . The observed behavior bears some similarities to distribution of order parameters near phase transitions, where the histogram switches between mostly ordered to mostly disordered states when passing through the transition. Here, the transition between mostly correlated (peak of near ) and uncorrelated (peak near ) regions happens at a value of which strongly increases with decreasing temperature. Therefore, the histograms allow us to define a static correlation length as the value of that characterizes this transition. As in Ref. Majid_criticallength , we choose as definition the coarse-graining distance for which the peak-location has shifted from one to . The length measures the average domain size of NADs over which displacements are correlated. The temperature dependence of for BMLJ (BMSS) model is shown in the inset of Fig. 10 (Fig. 11). While the value of is on the order of a particle diameter at high temperature, it increases considerably by cooling the system towards supercooled regions in quantitative agreement with the behavior of and discussed in Sec. VI (see also values listed on Table 1). Alternatively one also can define as the coarse-graining distance for which the variance is maximized. The temperature dependence of is robust and does not depend on different definitions Majid_criticallength ; Majid_thesis .
How sensitive is the length scale on the amplitude of the applied shear deformation? Figure 12 shows that for small deformations, , the correlation length becomes independent of . This finding allows us to interpret found above as an intrinsic property of the system, characterizing the correlation between two nearby inherent structure configurations. When increasing the deformation amplitude beyond , decreases until the temperature-dependence is washed out by the shear. In this regime, the shear deformation is strong enough to decorrelate the initial and final inherent structure configuration, which may be interpreted in terms of meta-basin transitions ashwin .
We want to stress once more that the procedure for obtaining the correlation length in this work is performed just on simulation snapshots with static deformation. Hence our length scale has a purely static character and its significant increase upon cooling can be interpreted as a structural signature of different dynamical regimes in supercooled liquids.
VI.2 Finite-size scaling analysis
Figs. 10 and 11 show that depends strongly on the linear size of the system. The strong system-size dependence together with the significant increase of is reminiscent of critical phenomena. There, the growing correlation length of the order parameter characterizing the transition gets cut-off by the system size. To test if the system-size dependence of has any critical character at low temperatures, we perform a finite-size scaling analysis. We assume that the correlation length - associated with an unknown order parameter for glasses - diverges with an exponent at the critical temperature as , where is the reduced distance from the critical point, . Therefore, should diverge as well and in an infinite system , where is the critical exponent characterizing its divergence. On the basis of the scaling hypothesis for critical phenomena Barber , the corresponding quantity in a finite system of linear size should follow the behavior
| (8) |
where is a universal scaling function. Therefore, plotting as a function of the scaling variable should collapse all data points for different system sizes onto one master curve. The occurrence of a thermodynamic phase transition has been put forward by Random First Order Theory (RFOT) and related theories of the glass transition wolynes89 ; cavagna_pedestrian and it has been discussed whether this could take place at the temperature where the extrapolated configurational entropy vanishes (the Kauzmann temperature). Fig. 10 shows the data collapse obtained for the the BMLJ model using as the critical temperature wolynes89 ; cavagna_pedestrian . For the BMLJ model, is estimated numerically to be Sciortino_IS99 ; Coluzzi00 . Fixing this value for , we have varied the critical exponents and . The best data collapse is obtained for the values and , which is the case shown in Fig. 10. The error bars for the critical exponents are estimated by varying the latter until the quality of data collapse starts to get worse. Because of very long equilibration time of the system at low temperature and of the small increase of for small system sizes, our data are still relatively far from the hypothetical critical point and this might be one of the reasons for the rather large uncertainties in the values of these exponents. The good collapse of the numerical data, however, indicates that the critical region is large enough to be detected in the temperature range where we could equilibrate our systems. In Ref. Majid_criticallength , we have performed the finite-size scaling analysis by lifting the assumption . The results showed that one still could get a data collapse for values of which lay within the interval . For the BMSS model, is estimated to be Coluzzi99 . Fixing to this value, the best data collapse is obtained by choosing the critical exponents as and . The case is shown in Fig. 11. The value of the exponent is similar for BMLJ and BMSS models and this suggests that the divergence of the underlying correlation length associated with the order parameter of the transition has the same origin in both cases. In Ref. Majid_criticallength , we have shown that also the dependence of relaxation time and configurational entropy on for the BMLJ model are in good agreement with predictions of RFOT. It is interesting to notice that, within the standard RFOT wolynes89 ; BouchaudBiroli_mosaic , the mosaic length scale is expected to grow significantly only at very low temperatures where long-lived metastable states occur, whereas our results indicate that the characteristic length scale starts to grow already at relatively higher temperatures. The growth of the so-called point-to-set correlation length at has also been observed in recent numerical simulations of three glass formers in Ref. Hocky . Overall, the picture emerging from our results is qualitatively consistent with the RFOT scenario. On the other hand, the uncertainties in the values of the critical exponents, as well as different results obtained in other recent studies Tanaka_critical , indicate that further quantitative investigations are still needed to better clarify the nature of the critical behavior observed here.
VII Conclusions
Cooperatively rearranging regions (CRR) play an important role for the dynamics of supercooled liquids with their sizes growing moderately upon approaching the glass transition Glotzer_length99 ; Ludo_Science05 ; Weeks_correlatedmotion . Very recently, structural signatures of the CRR have been detected, suggesting medium-range order Tanaka_DHandPsi6 or localized soft modes WidmerCooperSoftModes as triggers of the rearrangements. Here, we have shown by extensive molecular simulations that correlations in neighboring IS are quite reminiscent of CRR that are observed in the system’s dynamics Weeks_correlatedmotion . The behavior we report here is found for different models of fragile glasses, i.e., the Kob-Andersen model and a binary soft sphere mixture. The distance between two IS – that are related via shear deformation of rather small amplitude – sharply decreases with decreasing temperature below the onset temperature of the landscape-dominated regime Sastry_TainKA . We observe that the mean distance between the two IS varies exponentially with the inherent structure energy . Furthermore, we observe a crossover between two regimes that is also present in a qualitative change of the NAD distribution from an exponential to a power-law shape. The exponent of the latter can be rationalized from elasticity arguments Dyre99 . We use different measures for correlations of NAD vectors. Qualitatively, we find similar results as experiments on correlated motions in colloids Weeks_correlatedmotion . Quantitatively, the static correlation length extracted from NAD of IS grows significantly upon getting closer to the glass transition. Moreover, the finite-size scaling of our results indicates that the correlation length diverges at low temperatures. Since thermal fluctuations tend to wash out the correlations in the NAD, our method is very sensitive and provides an efficient tool to investigate correlated regions. This is a first interesting outcome of this work. It is worth noting, with this respect, that NAD field has proven to be an insightful investigation tool also for the mechanics of amorphous solids Fabien_prl and hence the approach we propose has a good potential to bridge the investigation of supercooled liquids to the one of amorphous solids, within a unifying picture of glass transition. In addition, the results here discussed suggest that the long range spatial correlations detected by the NAD field upon lowering the temperature might be indeed the spatial correlations underlying the onset and development of cooperative dynamics typically observed in supercooled liquids. This would be a significant new insight into the physics of supercooled liquids and more work is currently in progress to clarify this issue. The critical growth of spatial correlations that we have reported here overall supports the glass transition scenario based on Random First Order Theory and the analysis done seems to be quite robust. On the other hand, the finite-size scaling proposed also raises the question of identifying the critical temperature and for the moment we cannot rule out different possibilities: this requires further and more quantitative analysis. Finally, it would be extremely interesting, at this point, to be able to directly relate the growth of the correlation length and the features of the NAD field to the change in the transport properties of the system, i.e. in its viscoelastic response: whereas, to some extent, we can relate our results to the viscosity increase through the RFOT Majid_criticallength , a more coherent connection with the mechanical response and with the onset of rigidity in the material needs to be developed.
Acknowledgements
We thank Ludovic Berthier, Andrea Cavagna, Walter Kob, Srikanth Sastry and Anne Tanguy for useful discussions. Computational resources of the PolyHub Virtual Organization is greatly acknowledged. EDG is supported by the Swiss National Science Foundation (SNSF Grant No. PP002 126483/1).
References
- (1) J. D. Stevenson, J. Schmalian, and P. G. Wolynes, Nature Physics 2, 268 (2006)
- (2) E. V. Russell and. N. E. Israeloff, Nature 408, 695 (2000)
- (3) M. D. Ediger, Ann. Rev. Phys. Chem. 51, 99 (2000)
- (4) C. Bennemann, C. Donati, J. Baschnagel, and S. C. Glotzer, Nature 399, 246 (1999)
- (5) L. Berthier, G. Biroli, J.-P. Bouchaud, L. Cipelletti, D. E. Masri, D. L’Hôte, F. Ladieu, and M. Pierno, Science 310, 1797 (2005)
- (6) E. R. Weeks, J. C. Crocker, and D. A. Weitz, J. Phys.: Condens. Matter 19, 205131 (2007)
- (7) T. Kawasaki, T. Araki, and H. Tanaka, Phys. Rev. Lett. 99, 215701 (2007)
- (8) A. Widmer-Cooper and P. Harrowell, Phys. Rev. Lett. 96, 185701 (2006)
- (9) A. Widmer-Cooper, H. Perry, P. Harrowell, and D. R. Reichman, Nature Physics 4, 711 (2008)
- (10) F. H. Stillinger and T. A. Weber, Phys. Rev. A 28, 2408 (1983)
- (11) F. H. Stillinger and T. A. Weber, Science 225, 983 (1984)
- (12) P. G. Debenedetti and F. H. Stillinger, Nature 410, 259 (2001)
- (13) A. Heuer, J. Phys.: Condens. Matter 20, 373101 (2008)
- (14) D. L. Malandro and D. J. Lacks, J. Chem. Phys. 110, 4593 (1999)
- (15) C. E. Maloney and A. Lemaître, Phys. Rev. E 74, 016118 (2006)
- (16) F. Leonforte, A. Tanguy, J. P. Wittmer, and J.-L. Barrat, Phys. Rev. Lett. 97, 055501 (2006)
- (17) S. Sastry, P. G. Debenedetti, and F. H. Stillinger, Nature 393, 554 (1998)
- (18) S. Sastry, Nature 409, 164 (2001)
- (19) E. L. Nave, S. Sastry, and F. Sciortino, Phys. Rev. E 74, 050501 (2006)
- (20) D. Coslovich and G. Pastore, Europhys. Lett. 75, 784 (2006)
- (21) T. S. Grigera, A. Cavagna, I. Giardina, and G. Parisi, Phys. Rev. Lett. 88, 055502 (Jan 2002)
- (22) N. P. Bailey, T. B. Schrøder, and J. C. Dyre, Phys. Rev. Lett. 102, 055701 (2009)
- (23) G. Biroli, J.-P. Bouchaud, A. Cavagna, T. S. Grigera, and P. Verrocchio, Nature Physics 4, 771 (2008)
- (24) G. Biroli, J.-P. Bouchaud, K. Miyazaki, and D. R. Reichman, Phys. Rev. Lett. 97, 195701 (2006)
- (25) T. Yoshidome, A. Yoshimori, and T. Odagaki, Phys. Rev. E 76, 021506 (2007)
- (26) A. Furukawa, K. Kim, S. Saito, and H. Tanaka, Phys. Rev. Lett. 102, 016001 (2009)
- (27) E. Del Gado, P. Ilg, M. Kröger, and H. C. Öttinger, Phys. Rev. Lett. 101, 095501 (2008)
- (28) H. C. Öttinger, Phys. Rev. E 74, 011113 (2006)
- (29) T. B. Schrøder, S. Sastry, J. C. Dyre, and S. C. Glotzer, J. Chem. Phys. 112, 9834 (2000)
- (30) M. Mosayebi, E. D. Gado, P. Ilg, and H. C. Öttinger, Phys. Rev. Lett. 104, 205704 (2010)
- (31) M. Mosayebi, Static Signature of The Glass Transition From Inherent Structure Deformations, PhD thesis, ETH Zurich, Switzerland (2012)
- (32) S. Karmakara, C. Dasgupta, and S. Sastry, Proc. Nat. Acad. Sci. USA 106, 3675 (2009)
- (33) H. C. Andersen, Proc. Nat. Acad. Sci. USA 102, 6686 (2005)
- (34) W. Kob and H. C. Andersen, Phys. Rev. E 51, 4626 (1995)
- (35) J. N. Roux, J. L. Barrat, and J. P. Hansen, J. Phys.: Condens. Matter 1, 7171 (1989)
- (36) F. Sciortino, W. Kob, and P. Tartaglia, Phys. Rev. Lett. 83, 3214 (1999)
- (37) B. Coluzzi, G. Parisi, and P. Verrocchio, Phys. Rev. Lett. 84, 306 (2000)
- (38) B. Coluzzi, M. Mezard, G. Parisi, and P. Verrocchio, J. Chem. Phys. 111, 9039 (1999)
- (39) H. Yoshino and M. Mézard, Phys. Rev. Lett. 105, 015504 (2010), erratum: Phys. Rev. Lett. 108(E) 089902 82012)
- (40) S. Sastry, Phys. Chem. Comm. 14, 79 (2000)
- (41) S. J. Plimpton, J. Comp. Phys. 117, 1 (1995), available at lammps.sandia.gov
- (42) O. G. Jepps, G. Ayton, and D. J. Evans, Phys. Rev. E 62, 4757 (2000)
- (43) C. Chakravarty, P. G. Debenedetti, and F. H. Stillinger, J. Chem. Phys. 123, 206101 (2005)
- (44) Q. Yan, T. S. Jain, and J. J. de Pablo, Phys. Rev. Lett. 92, 235701 (2004)
- (45) C. Cammarota, A. Cavagna, G. Gradenigo, T. S. Grigera, and P. Verrocchio, J. Stat. Mech.-Theory Exp. 2009, L12002 (2009)
- (46) P. J. Steinhardt, D. R. Nelson, and M. Ronchetti, Phys. Rev. B 28, 784 (1983)
- (47) H. Tanaka, T. Kawasaki, H. Shintani, and K. Watanabe, Nature Materials 9, 324 (2010)
- (48) T. Aste, M. Saadatfar, and T. J. Senden, Phys. Rev. E 71, 061302 (Jun 2005)
- (49) J. C. Dyre, Phys. Rev. E 59, 2458 (1999)
- (50) J. C. Dyre, Phys. Rev. E 59, 7243 (1999)
- (51) B. Doliwa and A. Heuer, Phys. Rev. E 67, 031506 (2003)
- (52) G. Fabricius and D. A. Stariolo, Phys. Rev. E 66, 031501 (2002)
- (53) S. S. Ashwin, Y. Brumer, D. R. Reichman, and S. Sastry, J. Phys. Chem. B 108, 19703 (2004)
- (54) C. Goldenberg, A. Tanguy, and J.-L. Barrat, Europhys. Lett. 80, 16003 (2007)
- (55) C. Donati, J. Douglas, W. Kob, S. Plimpton, P. Poole, and S. Glotzer, Phys. Rev. Lett. 80, 2338 (1998)
- (56) B. A. DiDonna and T. C. Lubensky, Phys. Rev. E 72, 066619 (2005)
- (57) M. N. Barber, in Phase Transitions and Critical Phenomena, Vol. 8, edited by C. Domb and M. S. Green (Academic, London, 1983) pp. 145–475
- (58) T. R. Kirkpatrick, D. Thirumalai, and P. G. Wolynes, Phys. Rev. A 40, 1045 (1989)
- (59) A. Cavagna, Phys. Rep. 476, 51 (2009)
- (60) J.-P. Bouchaud and G. Biroli, J. Chem. Phys. 121, 7347 (2004)
- (61) G. M. Hocky, T. E. Markland, and D. R. Reichman, Phys. Rev. Lett. 108, 225506 (2012)