Fundamental Structural Constraint of Random Scale-Free Networks
Abstract
We study the structural constraint of random scale-free networks that determines possible combinations of the degree exponent and the upper cutoff in the thermodynamic limit. We employ the framework of graphicality transitions proposed by [Del Genio and co-workers, Phys. Rev. Lett. 107, 178701 (2011)], while making it more rigorous and applicable to general values of . Using the graphicality criterion, we show that the upper cutoff must be lower than for , whereas any upper cutoff is allowed for . This result is also numerically verified by both the random and deterministic sampling of degree sequences.
pacs:
89.75.Hc, 02.10.Ox, 89.75.Da, 64.60.aqComplex networks NetRev are found in diverse natural and artificial systems, which consist of heterogeneous elements (nodes) coupled by connections (links) markedly different from those of ordinary lattices. In particular, many systems Price1965 ; Albert1999 ; Vazquez2002 ; HJeong2000 ; Amaral2000 can be interpreted as scale-free networks, in which the fraction of nodes with degree (i.e., links) obeys the power-law distribution over a broad range of values bounded by where is called the degree exponent, is the lower cutoff, and is the upper cutoff. There have been interests in topological and dynamical properties induced by the degree distribution, which have been examined through various studies on random scale-free networks Albert2000 ; PastorSatorras2001 ; Sood2008 ; Dorogovtsev2001 ; Catanzaro2005 ; CPq ; CPa+Ising_a .
Random scale-free networks refer to an ensemble of networks constrained only by the parameters , , and . In general, is set as a constant, while is assumed to increase with the number of nodes as with . Besides, self-loops or multiple links between a pair of nodes are often disallowed. Under the circumstances, the degree exponent and the cutoff exponent determine various properties of networks in the thermodynamic limit, . It is known that contributes to the resilience against node failures Albert2000 , the epidemic threshold PastorSatorras2001 , the consensus time of opinion dynamics Sood2008 , etc. Meanwhile, affects the expected value of the generated maximum degree Dorogovtsev2001 , degree correlations Catanzaro2005 , finite-size scaling at criticality CPq ; CPa+Ising_a , etc.
The studies of random scale-free networks characterized by and must be based on the knowledge that such networks actually exist in the thermodynamic limit. Hence, it is necessary to understand the constraint on the possible values of and . This problem is exactly equivalent to the issue of the graphicality of random scale-free networks. A degree sequence is said to be graphical if it can be realized as a network without self-loops or multiple links. As an indicator of the existence of graphical sequences, the graphicality fraction DelGenio2011 is defined as the fraction of graphical sequences among the sequences with an even degree sum generated by . Note that the degree sequences with an odd degree sum are left out, since such sequences are trivially nongraphical. The constraint on the possible values of and can be obtained from the behavior of due to the fact that the random scale-free networks with given and exist in the thermodynamic limit if and only if is nonzero as . Using the graphicality criterion given by the Erdős–Gallai (EG) theorem Erdos1960 , Del Genio and co-workers DelGenio2011 have recently studied the behavior of as a function of only for the special case of and . They found
where the abrupt changes of at and were termed graphicality transitions DelGenio2011 . This result implies that there exist only sparse random scale-free networks with a finite average degree () and left-skewed networks with an abundance of hubs () in the thermodynamic limit when the range of degree is kept maximal.
In this Letter, we generalize their study to arbitrary choices of degree cutoffs, so that we can provide the complete picture of the constraint on the possible values of and . Starting from the EG theorem, we present a rigorous derivation of as a function of both and , which is then verified and supplemented by numerical results.
| = 0 | |||
|---|---|---|---|
| lhs | ||||||||
| rhs | ||||||||
The EG theorem Erdos1960 states that a degree sequence sorted in the decreasing order is graphical if it has an even sum and satisfies the EG inequalities given by
| (1) |
for any integer in the range .
To determine whether those inequalities are satisfied in the thermodynamic limit, we derive the network-size scalings of the left-hand side (lhs) and the right-hand side (rhs) of each inequality. As the first step, we calculate the scaling of from the cumulative mass function of , which is denoted by . The maximum degree () satisfies
| (2) |
where is the cumulative mass function of degree. Since satisfies the recursive relation
| (3) |
we can obtain its exact form as
| (4) |
Suppose , where and . If , we can use the following approximation for large :
| (5) |
Using Eq. (4) for and Eq. (5) for , we can find the range of in which increases from to in the limit . Since the typical values of must fall within this range of , we can obtain the network-size scalings of as listed in Table 1.
While both sides of the EG inequalities are sums over , we can approximate those sums as integrals, since it does not affect the the leading -dependent term that determines the scaling relation. It is straightforward to approximate the lhs, while the rhs needs a careful reformulation. The second term of the rhs satisfies
| (6) |
where denotes the Heaviside step function defined by if , and otherwise. From now on, each summation can be converted to an integral over the same range. Calculating all the integrals, we can single out the leading -dependent terms of each side, as listed in Table 2. The scalings of those terms are completely determined by the three exponents , , and , while the lower cutoff turns out to be irrelevant.
We can now determine whether the EG inequalities are satisfied through the comparison of scaling exponents in both sides. By the EG theorem, if the inequalities are satisfied for all possible values of , and if there exist the values of at which some inequalities are violated. Hence, the asymptotic behavior of is obtained as follows:
| (7) |
We note that the behavior of for the special case of and cannot be determined by our scaling argument, since both sides of the EG inequalities satisfy the same network-size scalings. To address this problem analytically, it is necessary that we consider the coefficients of the leading -dependent terms, which is beyond the scope of this Letter. Instead, we settle for its numerical resolution at the end of this Letter.
For the other cases, we can analytically determine the locations of graphicality transitions from Eq. (7). There exist two transition points for each value of in the range , namely the upper transition point and the lower transition point . On the other hand, no transition occurs for where always holds.
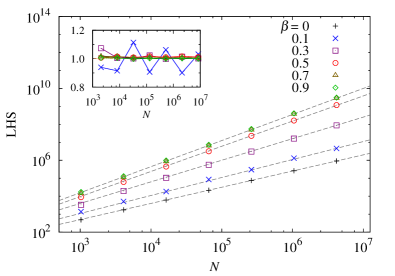
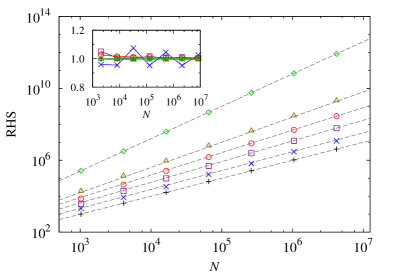

All the predictions on the asymptotic behavior of can be numerically checked by the evaluation of the EG inequalities. First of all, we can verify all the scalings listed in Table 2, some of which are shown in Fig. 1. This indirectly supports our predictions on the behavior of , as all the predictions were deduced from those scalings.
To obtain direct support for our predictions, we need to measure the dependence of from the random samples of degree sequences, as illustrated in Fig. 2. Due to sample-to-sample fluctuations at finite system size, changes continuously between and over a finite range of , which becomes narrower as increases. In fact, may not even reach if is too small, as exemplified by the curves for in Fig. 2(a). The curves in Fig. 2(b) show that the minimum of gradually reaches zero as increases. Keeping those observations in mind, for the sake of convenience, we regard the range of in which falls below as the effectively nongraphical region. Then, the boundary of this region can be chosen as the effective transition points at finite , which are again marked as and in Fig. 2(a).
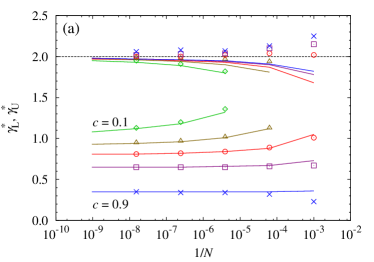
We also consider deterministically generated degree sequences defined by , obtained from Eq. (5), which ensures that the sequences exactly follow the network-size scalings of for . Those sequences filter out the sample-to-sample fluctuations, making it very straightforward to locate the effective transition points [see the inset Fig. 3(a)]. They also greatly improve the efficiency of calculation, allowing us to check our predictions at larger . We observe that the transition points estimated by both randomly and deterministically generated degree sequences approach each other as (for example, see Fig. 4). Therefore, we can use either of those two different samplings to numerically check our predictions.

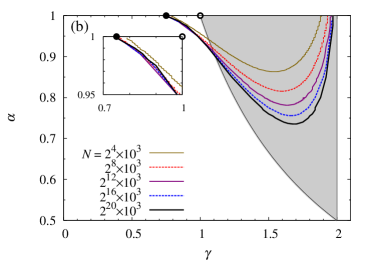
In Fig. 3, we present graphicality diagrams obtained at two different values of the cutoff coefficient , where the transition lines at finite network sizes are estimated by the deterministic samplings of degree sequences, and also compared with the transition lines in the thermodynamic limit predicted by the scaling argument. The numerically estimated transition lines tend to approach analytically predicted ones, which are independent of . Combining this observation with the verification of the scaling relations listed in Table 2, we can safely conclude that the numerical results are slowly converging to our predictions as increases.
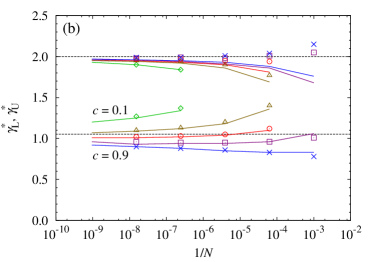
Moreover, Fig. 3 gives us some clues as to the location of the graphicality transitions for and , which could not be determined by the scaling argument as previously explained. The estimated transition lines suggest that the location of the transition is dependent on : approaches at , as previously reported DelGenio2011 , but it converges to some different limiting value if . The effect of on the graphicality at is more closely examined in Fig. 4(a), which suggests that varies continuously between 0 and 1 with , while converges to , regardless of . This nicely contrasts with Fig. 4(b), which confirms our prediction that the transition points are independent of for .
While we have given an almost complete picture of the graphicality issue of scale-free networks, the nature of graphicality transitions requires further studies. Note that at a transition point, the comparison of scalings fails to determine whether the Erdős–Gallai inequality holds in the asymptotic limit, just like the case of . In such cases, the coefficients of the leading-order terms as well as the second- and higher-order terms must be considered to determine the value of . Thus, we cannot claim yet that graphicality transitions are truly discontinuous as previously claimed DelGenio2011 , since they might be sharp but continuous transitions resembling the continuous change of with at . The claim should be either proven or disproven by a more complete understanding of the behavior of at the transition points.
In conclusion, we have found that in the thermodynamic limit random scale-free networks without self-loops or multiple links are either sparse () with arbitrary values of degree cutoffs, or dense () with the upper cutoff satisfying , supplementing the statement that “all (random) scale free networks (with maximal range of degree) are sparse.” DelGenio2011 This also agrees with the upper cutoff found by Seyed-allaei et al. Seyedallaei2006 , which is required for scale-free networks with generated using a node-fitness mechanism Caldarelli2002 . We also numerically found that the cutoff coefficient affects the realizability of degree sequences for the special case of the linear cutoff , which has been overlooked. Our results impose a limit on the values of and for which the properties of random scale-free networks numerically obtained in finite systems can be extrapolated to the thermodynamic limit.
The work was supported by the National Research Foundation of Korea (NRF) Grant funded by the Korean Government (MEST) (No. 2011-0011550) (M.H.); (No. 2011-0028908) (Y.B., D.K., H.J.). M.H. also acknowledges the generous hospitality of KIAS for the Associate Member Program, funded by the MEST.
References
- (1) R. Albert and A.-L. Barabási, Rev. Mod. Phys. 74, 47 (2002); S.N. Dorogovtsev and J.F.F. Mendes, Adv. Phys. 51, 1079 (2002); M.E.J. Newman, SIAM Rev. 45, 167 (2003); S. Boccaletti, V. Latora, Y. Moreno, M. Chavez, and D.-U. Hwang, Phys. Rep. 424, 175 (2006); S.N. Dorogovtsev, A.V. Goltsev, and J.F.F. Mendes, Rev. Mod. Phys. 80, 1275 (2008).
- (2) D.J. de Solla Price, Science 149, 510 (1965).
- (3) R. Albert, H. Jeong, and A.-L. Barabási, Nature (London) 401, 130 (1999).
- (4) A. Vázquez, R. Pastor-Satorras, and A. Vespignani, Phys. Rev. E 65, 066130 (2002).
- (5) H. Jeong, B. Tombor, R. Albert, Z. N. Oltvai, and A.-L. Barabási, Nature (London) 407, 651 (2000).
- (6) L.A.N. Amaral, A. Scala, M. Barthelemy, and H.E. Stanley, Proc. Natl. Acad. Sci. U.S.A. 97, 11149 (2000).
- (7) R. Albert, H. Jeong, and A.-L. Barabási, Nature (London) 406, 378 (2000).
- (8) R. Pastor-Satorras and A. Vespignani, Phys. Rev. E 63, 066117 (2001).
- (9) V. Sood, T. Antal, and S. Redner, Phys. Rev. E 77, 041121 (2008).
- (10) S.N. Dorogovtsev, J.F.F. Mendes, and A.N. Samukhin, Phys. Rev. E 63, 062101 (2001).
- (11) M. Catanzaro, M. Boguñá, and R. Pastor-Satorras, Phys. Rev. E 71, 027103 (2005).
- (12) C. Castellano and R. Pastor-Satorras, Phys. Rev. Lett. 96, 038701 (2006); M. Ha, H. Hong, and H. Park, ibid. 98, 029801 (2007); C. Castellano and R. Pastor-Satorras, ibid. 98, 029802 (2007); H. Hong, M. Ha, and H. Park, ibid. 98, 258701 (2007).
- (13) C. Castellano and R. Pastor-Satorras, Phys. Rev. Lett. 100, 148701 (2008); M. Boguñá, C. Castellano, and R. Pastor-Satorras, Phys. Rev. E 79, 036110 (2009); J.D. Noh and H. Park, ibid., 79, 056115 (2009); S.H. Lee, M. Ha, H. Jeong, J.D. Noh, and H. Park, ibid. 80, 051127 (2009).
- (14) C.I. Del Genio, T. Gross, and K.E. Bassler, Phys. Rev. Lett. 107, 178701 (2011).
- (15) P. Erdős and T. Gallai, Matematikai lapok 11, 264 (1960).
- (16) H. Seyed-allaei, G. Bianconi, and M. Marsili, Phys. Rev. E 73, 046113 (2006).
- (17) G. Caldarelli, A. Capocci, P. De Los Rios, and M.A. Muñoz, Phys. Rev. Lett. 89, 258702 (2002).