LPMCN, Université Lyon 1, CNRS - 43 Boulevard du 11 Novembre 1918, F-69622 Villeurbanne, France, EU
CEA Saclay, IRAMIS, SPEC - Building 772, Orme des Merisiers, F-91191 Gif-sur-Yvette Cedex, France, EU
ESPCI-Paris Tech, PSL⋆, UMR Gulliver, EC2M, 10 rue Vauquelin, F-75231 Paris Cedex 05, France, EU
Fatigue, corrosion fatigue, embrittlement, cracking, fracture, and failure Deformation and flow Amorphous materials; glasses and other disordered solids
Fractoluminescence characterization of the energy dissipated during fast fracture of glass
Abstract
Fractoluminescence experiments are performed on two kinds of silicate glasses. All the light spectra collected during dynamic fracture reveal a black body radiator behaviour, which is interpreted as a crack velocity-dependent temperature rise close to the crack tip. Crack velocities are estimated to be of the order of 1300 m.s-1 and fracture process zones are shown to extend over a few nanometers.
pacs:
81.40.Nppacs:
83.50.-vpacs:
78.55.QrAlthough glass is considered as the archetype of brittle elastic materials, it was shown in various situations that, during fracture, a large part of the stored elastic energy is dissipated in permanent deformation of the material. It was argued to be mostly dissipated in the formation of nanocracks in ultraslow stress corrosion cracking conditions [1, 2]. In vacuum, Molecular Dynamics (MD) simulations [3] of dynamic fracture predict that energy dissipation results both from plastic deformation and from bond breaking ahead of the crack tip, the two phenomena acting at the scale of a few nanometers. The latter predictions are in agreement with experiments due to S. Wiederhorn [4], who performed accurate measurements of the energies of fracture in an inert environment for different glass compositions, and showed that they are approximately ten times higher than the typical surface energy values estimated by Griffith [5]. However, in order to understand fully the nature of the dissipation processes, it is highly desirable to measure the size of the Process Zone (PZ) where they take place for a given crack velocity. Direct measurements being hardly imaginable because of the small dimensions involved, and because crack velocities are larger than a few hundreds of meters per second, one has to resort to indirect characterizations. The scope of the present work is to show how fractoluminescence can be used for that purpose.
During rapid fracture, the emission of neutral particules, ions, electrons and photons has indeed been observed in a wide variety of materials [6, 7, 8]. Fractoemission has been used to probe both fracture mechanisms and fracture surface chemistry [9]. Since an early paper by Wick et al. [10], a growing interest has fostered in oxide glass fractoluminescence, and the first wavelengths spectra were obtained in the eighties [11].
These spectra usually exhibit both an energy continuum and peaks corresponding to discrete energy values. Chapman and Walton [12] performed dynamic fracture experiments on different glasses, and showed that the continuum corresponds to a black body radiator spectrum. Using a model developped by Weichert and Schonert [13], they compared the numerical solutions obtained by these authors to their own observations in order to evaluate the size of the heated propagating zone ahead of the crack tip, and found it to be of the order of a few nanometers. More recently, Gonzalez and coworkers [14] showed that no photons were detected for crack velocities smaller than m.s-1 in soda-lime silica.
The central point of this letter is to provide quantitative evidence for the above scenario by interpreting the black body emission spectrum observed during dynamic fracture within the framework of Rice and Levy’s [15] and Freund’s [16] models. We estimate both the crack velocity and the size of the PZ, where dissipative processes occur and the temperature rises.
1 Experimental Setup
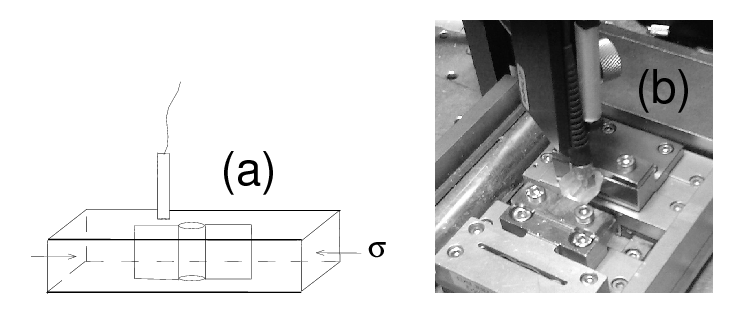
Double cleavage drilled compression (DCDC) specimens (Fig. 1) with implemented precrack obtained by stress corrosion [17] are used to perform experiments. Cracks are propagated at a constant temperature K under ambient pressure. Samples made of pure silica (Corning 7980, USA) and float glass (Saint Gobain, France) are parallelepipedic ( mm3, with 10 m tolerance). A hole of radius m is drilled in their center to trigger the formation of two symmetric mode I tensile cracks sketched in Fig. 1 (a) when the sample is submitted to uniaxial compression at imposed displacement speed [18, 19, 20]. To avoid stress corrosion, the specimen is placed in a bath of dodecane oil preventing the water molecules penetration at the crack tip. This results in dynamic fracture as suggested by Wiederhorn [21]. Potential light intrusion has been identified and neutralized.
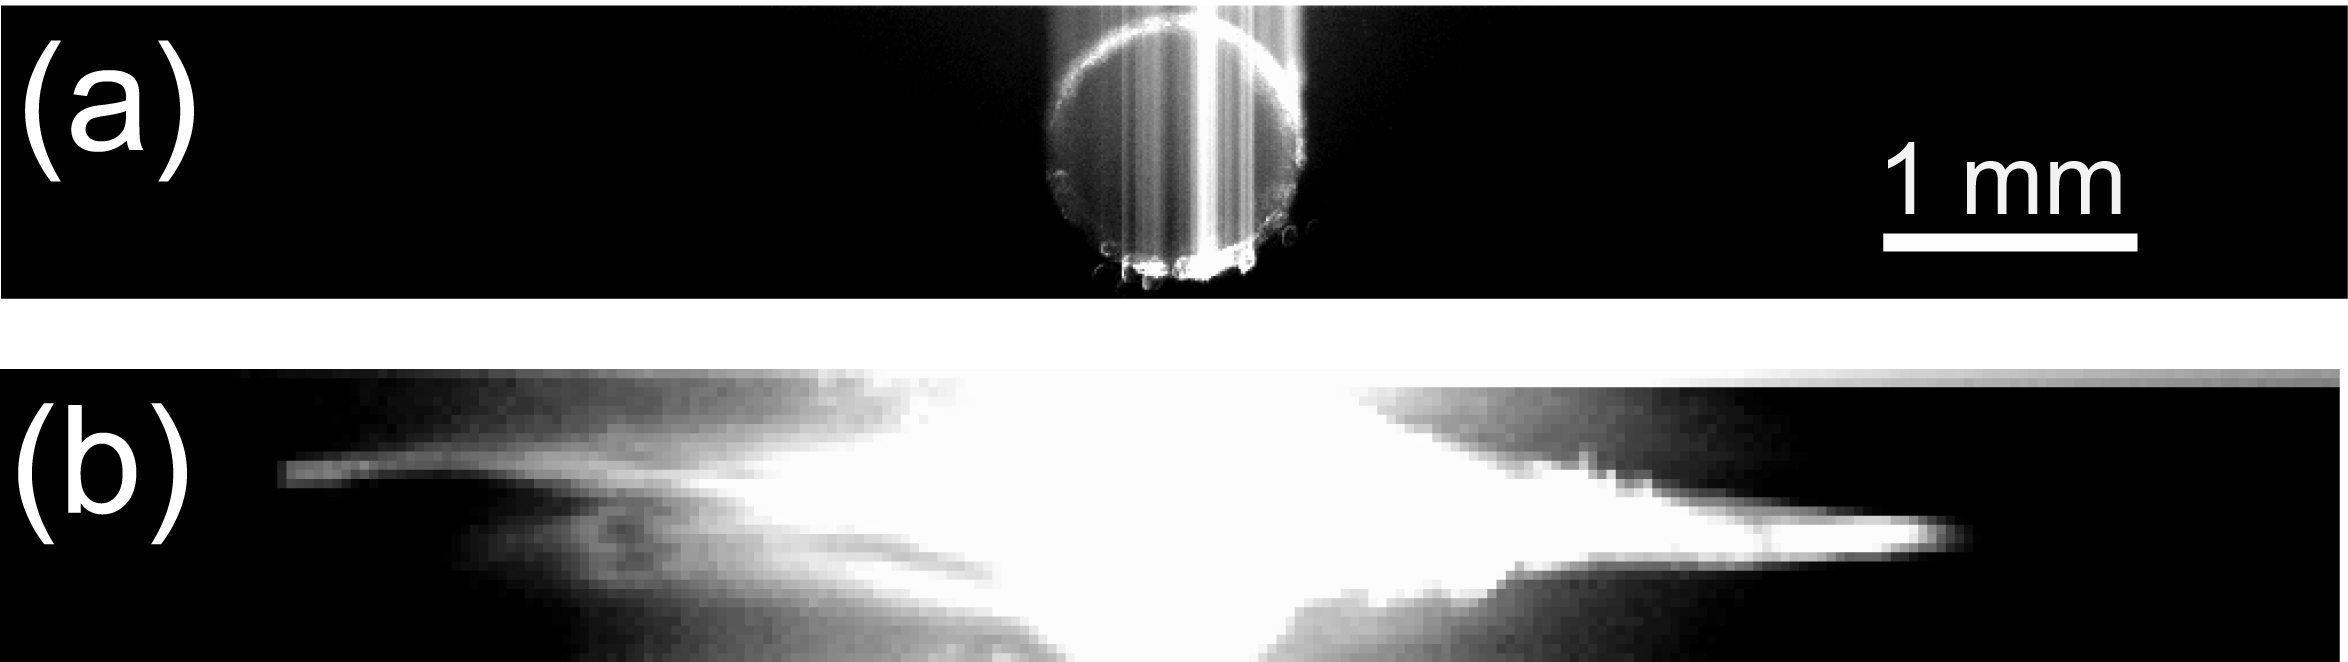
In order to check that cracks actually propagate within the midplane of the sample, we first monitor experiments by imaging the emitted photons using a large-aperture lens (numerical aperture: 0.4, focal length: 12mm) onto the 1024x128 pixel array (26.6 mmx3.3 mm) of a cooled (193 K) CCD camera (Andor, DU-401 BR-DD) with a 1:2.75 magnification factor. In accordance with standard Charge-Coupled Device (CCD) operation, the radiation is continuously integrated and stored as photo-generated charges in the pixels of the CCD, until a read-out operation of the accumulated charges takes place. In order to reduce the level of dark noise, we programmed a read-out every 5 seconds. This period has been optimized in order that the accumulated dark noise ( 4 photo-electrons per pixel) remains smaller than the signal emitted by a single crack event, whereas the probability that the emission by the short-lived crack event occurs during a read-out ( 50 ms) is negligible. The detection spectral range is nominally 400 nm – 1150 nm. Fig. 2 (a) and (b) shows two mm2 images which are acquired respectively before and during dynamic fracture.
In order to measure the photon spectra, a 300-m-diameter fiber bundle is used to collect the emission locally on the propagation path on the sample at mm from the hole as shown in Fig. 1 (a). The output of the fiber bundle forms the entrance slit of a spectral disperser (Andor, Shamrock 163i) coupled to the above-mentioned cooled CCD detector. The spectral resolution is 4 nm in wavelength.
2 Experimental results
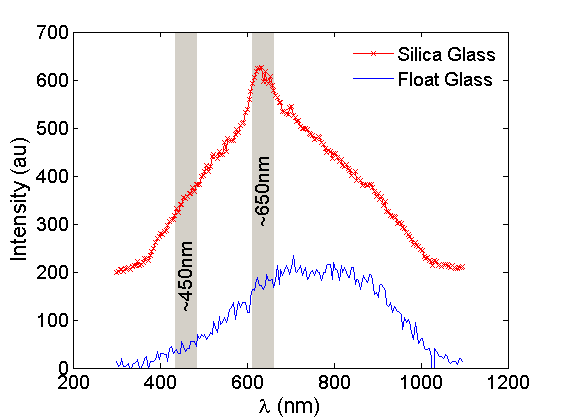
Fig. 3 shows typical spectra obtained for silica and float glass. The signal intensity is always observed to be smaller for float glass, for which the maximum consistently takes place at lower energy values. On the pure silica spectra, we note, on top of a continuous spectrum, the presence of a characteristic peaks corresponding to nonbridging oxygen hole center relaxation at 650 nm ( 1.9-eV) [22].
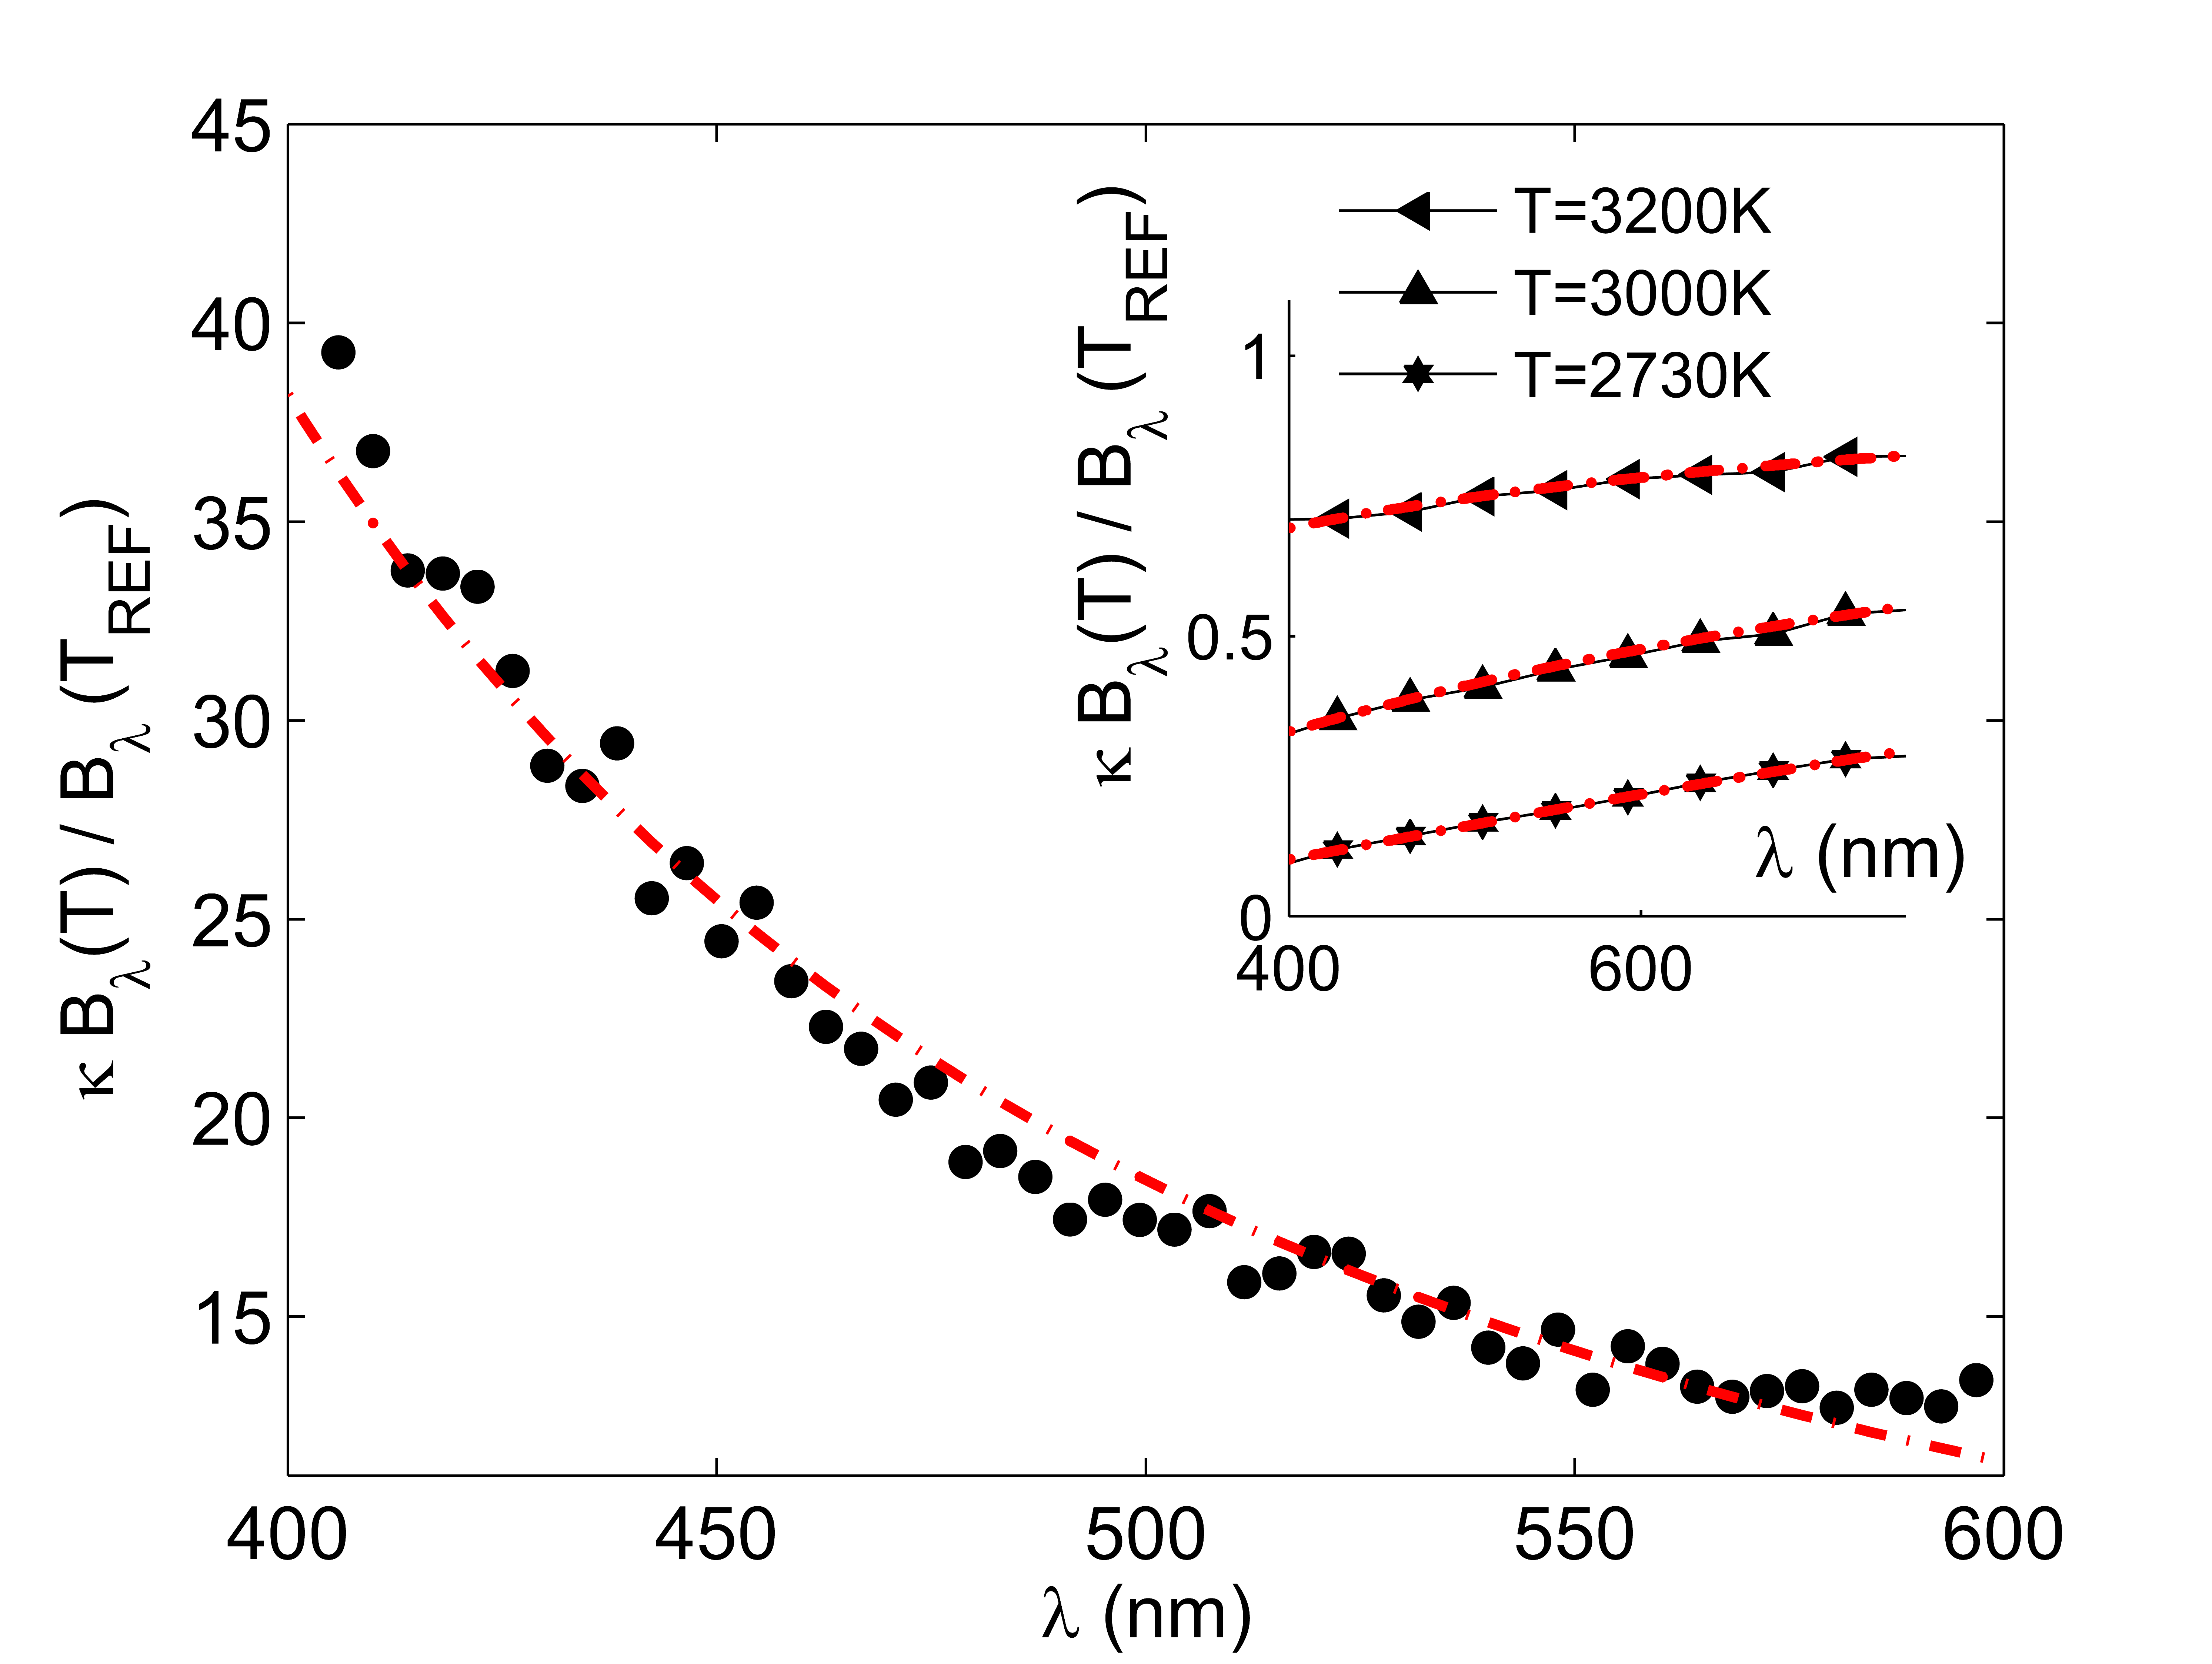
In order to check that the continuous part of each observed spectrum is black body type, and to evaluate the corresponding temperature, each curve is normalized by the spectrum of a thermal source with known temperature (Schott KL 1500 LCD). This procedure permits to get rid of the overall spectral sensitivity function of the detection system. According to [23], the Planck distribution function in terms of photons number per second and per unit wavelength can be expressed as where m.K ( and being respectively the Planck constant, the velocity of light and the Boltzman constant).The measured renormalized spectra were fitted in the wavelength domain 400–700 nm by the ratio , where is a constant accounting for the difference in duration and spatial extension of the sources. This temperature evaluation method was first tested on five known temperature spectra obtained by the thermal source ranging between 2650 and 3200 K. Note that our detector fails to detect IR thermal photons, because of the fast thermal diffusion following strongly localized heating, and the subsequent temperature decay: the IR emission persists longer than the UV-Vis one. Thus the fit concerns only the range 400-740 nm in this case. The relative error was found to be less than 1% (cf the inset of Fig. 4). For our glass samples, the fitting range was further reduced to 400-600nm because of the existence of a peak at 650nm. Temperature rises at crack tips, both in silica and float glass samples, are given in Table 1.
3 Local heating induced by non linear deformations in dynamic fracture
The temperature field of a crack tip running at a constant velocity was determined by Rice and Levy [15]. They showed that the temperature rise within the PZ around the crack tip is equal to:
| (1) |
with the stress intensity factor (SIF). and are respectively Poisson’s ratio and Young’s modulus, while , and are respectively the density, the thermal conductivity and the specific heat capacity of the material (see Table 1). {largetable} is the temperature elevation in the PZ and is the measured crack velocity corresponding. and are respectively the stress intensity factor and the size of the PZ. is the extent of the region where the temperature decreases from very high within the PZ to its room value far from it. Sample (K) (m.s-1) (MPa.m1/2) (nm) (nm) Silica 1 4680130 123094 0.990.03 3.90.2 0.680.05 Silica 2 5480450 1480350 1.060.09 4.40.7 0.560.13 Silica 3 4980210 1330160 1.020.04 4.10.3 0.630.07 Float 1 5180840 1550730 1.020.16 4.11.3 0.270.13 Float 2 4100530 1170410 0.930.12 3.40.9 0.360.12
In not too fast fracture, i.e. before complex processes occur (such as branching [24] or extended damage formation [25]), the crack velocity can be related to through Freund’s elastic continuum mechanics prediction [16]:
| (2) |
where m.s-1 is the Rayleigh wave speed in glass. Indeed, Sharon and Fineberg [26] validated this prediction in glass, for velocities up to m.s-1. For smaller velocities, invoking Eq. (1) and the Dugdale-Barrenblat expression for the PZ size:
| (3) |
where is the yield stress. Several techniques can be used to measure it, nevertheless the value is still debated. The yield stress ranges approximately between 9 and 12 GPa in silica glass under UHV conditions, depending on the loading [27, 28, 29] and references therein. For oxide glasses, Wiederhorn estimated a yield stress close to 10 GPa [4] which is in good agreement both with MD simulations [27, 28], where is predicted to be close to 9GPa, and with the results obtained by Kurkjian on glass fibers [29]. Hence, is taken equal to 10 GPa in the following. We can extract an expression for the crack velocity :
| (4) |
where .
Using Eq. (4), we calculate the crack velocity in each case. The error bar on can be deduced from the error bar on : . This leads to the results reported in Table 1.
| Oxide glass type | Silica | Float |
| Young modulus (GPa) | 72.7 | 72 |
| Poisson’s ratio | 0.16 | 0.23 |
| Density (kg.m-3) | 2201 | 2530 |
| Specific capacity (J.kg-1.K-1) | 703 | 880 |
| Heat conductivity (W.m-1.K-1) | 1.30 | 0.937 |
| Fracture toughness (MPa.m1/2) | 0.794 | 0.749 |
4 Discussion
We have confirmed Chapman and Walton’s observations [12]: photons emitted during dynamic crack propagation in silicate glasses are mostly of thermal origin, indicating a high temperature rise in a small zone around the crack tip, where dissipative processes occur.
For pure silica, however, a peak at 650 nm corresponding to the relaxation of the nonbridging oxygen hole center was observed [30]. On the contrary, the 450 nm signature of the relaxation luminescence of the oxygen deficient center was not observed in our experiments, probably because of the elevated OH-content of our material (close to 1000 ppm) [31, 30].
However, unlike Chapman and Walton [12], we have made no a priori assumption on the value of the applied stress intensity factor, the process zone size or the crack velocity. Using Rice and Levy’s model [15], Freund’s elastic prediction [16] of the crack velocity dependence on the fracture energy and a Dugdale-Barrenblatt expression of the plastic zone size, we have derived a univocal relation between the temperature rise and the crack velocity. For pure silica and for float glass, dynamic crack velocities are found to be lying between 1172 and 1551m.s-1 however, values exceeding the limit velocity 1400m.s-1 are extrapolated and may not be trusted (Silica2 and Float1 samples in Table 1).
Moreover, since the crack propagates in the sample midplane, we can estimate the value of the stress intensity factor for a crack length equal to the distance between the hole and the detector from the measured load to fracture [20]. In our DCDC geometry, the normalized crack length is slightly lower than the domain where the normalized SIF equation was adjusted, it is thus reasonable to extrapolate for estimate purpose the stress intensity factor values: For the three silica samples, we get MPa.m1/2, and in the float glass cases MPa.m1/2. The uncertainty on being estimated to 0.05 MPa.m1/2, the macroscopic values are in excellent agreement with the instantaneous values of estimated independently from the temperature elevation.
Plastic zone sizes were shown to be 3 to 4 nm in all cases, which is a reasonable order of magnitude [32, 33]. Note however that Molecular Dynamics simulations performed on pure silica for a crack velocity m.s-1 predict a slightly larger value, close to 10 nm, with a yield stress of 9 GPa [3, 28]. This can seem in disagreement with our observations, since in dynamic fracture the plastic zone size is supposed to increase with the applied stress intensity factor, and hence with the crack velocity. This apparent discrepancy can be due to a different way of estimating the PZ size. In Rountree et al’s work [3], the whole region where flaws appear is taken into account. In our case, we measure the size of the region where the temperature rise is close to its maximum. However, although there is actually a temperature profile within the process zone, which could be estimated for metallic materials [34], we can show that for glass, the profile is quite abrupt. As a matter of fact, what controls the extent of the region where the temperature decreases from it elevated value within the PZ to its room value far from it is the ratio of the thermal diffusion coefficient to the crack velocity . This length scale can be shown to be equal to nm and nm for silica and float glass respectively. In both cases, is much smaller than the PZ size , which means that we can consider that only the PZ is at high temperature while the surrounding material is at room temperature.
Acknowledgements.
We are indebted to B. Pant who started these experiments and to T. Bernard for his technical help. The authors also thank J.-P. Bouchaud, C. Fiorini, R.K. Kalia and K.-I. Nomura for enlightening discussions.References
- [1] \NameCelarie F., Prades S., Bonamy D., Ferrero L., Bouchaud E., Guillot C. Marli re C. \REVIEWPhys. Rev. Lett.902003075504.
- [2] \NameLechenault F. ,Rountree C. L., Cousin F., Bouchaud J.-P., Ponson L. Bouchaud E. \REVIEWPhys. Rev. Lett.1062011165504.
- [3] \NameRountree C.L. , Prades S., Bonamy D., Bouchaud E., Kalia R. Guillot C. \REVIEWJ. Alloys Compd.434200760.
- [4] \NameWiederhorn S.M. \REVIEWJ. Am Ceram. Soc.52196999.
- [5] \NameGriffith AA. \BookThe phenomena of rupture and flow in solids \Vol221 \PublPhilosophical Transactions of the Royal Society of London, Series A \Year1920 \Page163-198.
- [6] \NameWalton, A. J. \REVIEWAdv. Phys.261977887.
- [7] \NameDickinson J.T., Donaldson E. E. Park M. K. \REVIEWJ. Mater. Sci.1619812897.
- [8] \NameBahat D., Rabinovitch A. Frid V. \BookTensile fracturing in rocks \EditorSpringer \PublHeidebberg \Year2005 \Page569.
- [9] \NamePantano C.G. \BookStrength of inorganic glass \PublPlenum, New York \Year1985 \Page37-66.
- [10] \NameWick F.G. \REVIEWJ. Opt. Soc. Am.271937275.
- [11] \NameZink J.I., Beese W., Schindler J.W., Smiel A.J. \REVIEWAppl. Phys. Lett.401982110.
- [12] \NameChapman G.N Walton A.J. \REVIEWJ. Appl. Phys.5419835961.
- [13] \NameWeichert R. Schonert K. \REVIEWQ. J. Mech. Appl. Math.311978363.
- [14] \NameGonzalez A.C Pantano C.G. \REVIEWAppl. Phys. Lett.571990246.
- [15] \NameRice J.R. and Levy N. \BookThe Physics of Strength and Plasticity \EditorArgon A.S \PublThe M.I.T. Press Cambridge, Massachusetts, and London, England \Year1969 \Page277-293.
- [16] \NameFreund L.B. \BookDynamic Fracture Mechanics \PublCambridge Monographs on Mechanics \Year1990
- [17] \NamePrades S., Bonamy D., Dalmas D., Bouchaud E. Guillot C. \REVIEWInt. J. Solids Struct.422005637.
- [18] \NameHe M.Y., Turner M.R. Evans A.G. \REVIEWActa. Metall. Mater.4319953453.
- [19] \NameFett T., Rizzi G. Munz D. \REVIEWEng. Fract. Mech.722005145.
- [20] \NamePallares G., Ponson L., Grimaldi A., George M., Prevot G. Ciccotti M. \REVIEWInt. J. Fract.156200911.
- [21] \NameWiederhorn S.M., Johnson H., Diness A.M. Heuer A.H. \REVIEWJ. Am. Ceram. Soc.571974336.
- [22] \NameTohmon R., Shimogaichi Y., Munekuni S., Ohki Y., Hama Y. Nagasawa K. \REVIEWAppl. Phys. Lett.5419891650.
- [23] \NameSoffer B.H. Lynch D.K. \REVIEWAm. J. Phys.671999946.
- [24] \NameFineberg J. Marder M. \REVIEWPhys. Rep.31319992.
- [25] \NameWashabaugh P.D. Knauss W.G. \REVIEWInt. J. Solids Struct.3219952481.
- [26] \NameSharon E Fineberg J. \REVIEWNature3971999333.
- [27] \NameRountree C.L. et al. \REVIEWAnnual Review of Materials Research377200232.
- [28] \NameKalia R. \BookPrivate Communication \Year2009.
- [29] \NameKurkjian C.R, Gupta P.K, Brow R.K Lower N. \REVIEWJ. Non-Cryst. Solids3162003114.
- [30] \NameKawaguchi Y. \REVIEWPhys. Rev. B5419969721.
- [31] \NameTohmon R., Shimogaichi Y., Mizuno H., Ohki Y., Nagasawa K. Hama Y. \REVIEWPhys. Rev. Lett.6219891388.
- [32] \NamePallares G. \BookPh.D. thesis, Montpellier II (France) \Year2010.
- [33] \NameCiccotti M. \REVIEWJ. Phys. D: Appl. Phys.422009214006.
- [34] \NameMason J.J. Rosakis A.J. \REVIEWMech. Mater.161993337.