Test of Jarzynski and Crooks fluctuation relations in an electronic system
Abstract
Recent progress on micro- and nanometer scale manipulation has opened the possibility to probe systems small enough that thermal fluctuations of energy and coordinate variables can be significant compared with their mean behavior. We present an experimental study of nonequilibrium thermodynamics in a classical two-state system, namely a metallic single-electron box. We have measured with high statistical accuracy the distribution of dissipated energy as single electrons are transferred between the box electrodes. The obtained distributions obey Jarzynski and Crooks fluctuation relations. A comprehensive microscopic theory exists for the system, enabling the experimental distributions to be reproduced without fitting parameters.
Everyday concepts such as heat and mechanical work have their foundation in dynamics at the atomic and molecular scale, which is typically unobservable in macroscopic samples. Advances in the synthesis and manipulation of biological matter have made it possible to study the response of individual molecules Liphardt2002 ; *Collin2005; *Junier2009 to mechanical forces, also see Ref. Alemany2011 for a recent review. In these experiments, the external force is modulated following a predetermined protocol and the resulting work exerted upon the system is measured. Consequently, the fluctuating nature of the thermodynamic quantity ‘work’ is revealed, as repeated measurements yield different results depending on the microscopic trajectory traversed by the molecule. Similar studies have been performed on colloidal particles Wang2002 ; *Blickle2006 and mechanical oscillators Douarche2005 . Fluctuation theorems such as the Jarzynski equality Jarzynski1997 enable one to infer path-independent equilibrium free energy differences from the statistics of irreversible measurement protocols. The Jarzynski equality (JE) states that
| (1) |
where the ensemble average is taken over repetitions of the force protocol starting from an equilibrium state at temperature , and is the difference in free energy between the final and initial values of the external control parameters. As we demonstrate experimentally, this equation applies also to a single-electron device operated in a dilution refrigerator at temperatures of about 200 mK. An electrostatic gate drive plays the role of the time-dependent mechanical force that has been missing in previous studies of fluctuation theorems in electronic systems Garnier2005 ; *Utsumi2010; *Kung2012, and is crucial for studying JE (1) and Crooks fluctuation relations discussed below.
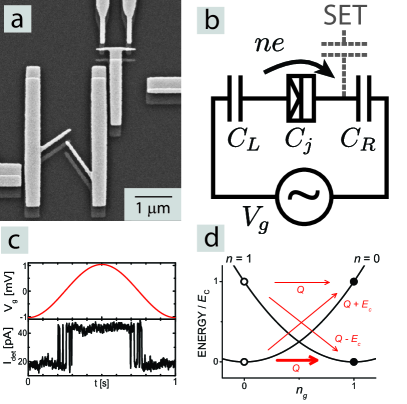
The system that is the subject of our study is a single-electron box Averin1985 ; *Buttiker1987; *Lafarge1991 as depicted in the scanning electron micrograph of Fig. 1(a). The box is formed by two metallic electrodes that are electrically connected through a tunnel junction with a small electric capacitance . The complete circuit diagram and naming of capacitors is shown in Fig. 1(b). The sole degree of freedom that is of interest here is the number of electrons transferred from the left to the right electrode. The relevant -dependent part of the electrostatic energy of the single-electron box is given by PekolaNote2012
| (2) |
where is the characteristic unit of charging energy of the box, is electron charge, is the total capacitance of the box, is the effective gate capacitance, and is the gate charge in units of . The charge number changes by in the process of electron tunneling across the junction. In the temperature range of strong Coulomb blockade , thermal excitations of are exponentially unlikely when the gate charge in Eq. (2) is an integer Lafarge1991 . Thus, the charge number can be driven between two adjacent charge states, say, and , by a protocol that ramps the gate charge between the values and . This is demonstrated in Fig. 1(c).
We employ a readout that yields the heat deposited into the electrodes in such driven transitions. The theoretical analysis presented in Refs. Averin_Statistics ; PekolaNote2012 establishes that JE can be written in terms of as
| (3) |
provided that the drive protocol is such that the transition always occurs. This condition is realized in the present experiment to an accuracy of supmat . For completeness, we illustrate in Fig. 1(d) the relationship between and the dissipated work appearing in the fluctuation relations for other trajectory types as well. One can similarly write the Crooks fluctuation theorem Crooks1999 in terms of as
| (4) |
where and are the probability distributions of when the system is driven in forward (F) or reverse (R) directions, respectively. Importantly, the above formulations of the fluctuation theorems can be applied without detailed knowledge of the internal dynamics of the system, thus retaining their universality and usefulness.
Charge tunneling is governed thermally by the excitations of conduction electrons in the box electrodes that couple to the bath of lattice phonons. Hence, switching dynamics between the different charge states is dissipative. The amount of energy deposited into the two electrodes in a single tunneling event equals the difference of the chemical potentials of the electrodes at the time of the tunneling, which is essentially instantaneous on the other relevant timescales in the problem AverinLikharev ; *IngoldNazarov. The chemical potential difference is given by the change in energy of Eq. (2) in response to a change of the charge number . In general, the -trajectory consists of a random number of successive back-and-forth tunneling events, and hence the total heat generated in such a trajectory is Averin_Statistics
| (5) |
where is the stochastic time instant of the th tunneling event, and the sign is the same as for in the event. Because of the intrinsic randomness of the tunneling events, the heat fluctuates from one gate voltage ramp to another. In the experiment, the system was driven with a sinusoidal excitation corresponding to with frequencies ranging from 1 to 20 Hz. These frequencies are sufficiently slow so that the charge state always assumes its minimum energy value at the turning points of the drive, when 0 and 1, respectively. Hence, each half cycle from 0 to 1, and similarly from 1 to 0, can be considered an independent realization of the control protocol.
We perform the heat readout by detecting the electron tunneling events by a capacitively coupled single-electron transistor (SET) supmat . Equation (5) yields the heat in terms of for an individual sweep. One can thus utilize the experimental distributions in two ways: Using values of and determined by independent means, validity of Eqs. (3) and (4) can be tested. On the other hand, accepting Eqs. (3) or (4), one can determine the ratio , and furthermore find by multiplying this ratio with the independently measured temperature of the sample holder.
The preceding discussion is independent of the details of the charge tunneling rates in the single-electron box. However, in our case it is possible to analyze the fluctuation relations also from a microscopic point of view. Charge transport through a Cu/AlOx/Al normal metal–insulator–superconductor (NIS) tunnel junctions occurs via thermally activated (TA) events described by the orthodox theory AverinLikharev ; *IngoldNazarov, provided that (i) the tunneling resistance of the junction is high compared to the resistance quantum , (ii) quasiparticles in the electrodes obey an equilibrium thermal distribution, and (iii) coupling of stray microwaves to the junction has been prevented by appropriate shielding and filtering in the construction of the sample stage and signal lines. Realization of these conditions in NIS single-electron devices, including the back-action from the capacitively coupled elecctrometer, has been studied in detail in recent years Saira_EAT ; Saira_SuperAl . Based on these studies, non-thermal charge transport is expected to be negligible at least above temperatures of 150 mK. In particular, overheating of the superconducting electrode in the present design is diminished by the fact that quasiparticle excitations can relax to the overlapping normal metal through the oxide barrier. Observed stochastic switching of the system between charge states at a fixed value of gate charge near degeneracy can be directly fitted to the tunneling rates predicted by the orthodox theory supmat . We extract values , , and for the superconducing gap parameter, charging energy of the box, and tunneling resistance of the box junction, respectively. For the detector SET, we obtain and from a fit to the measured - characteristics.
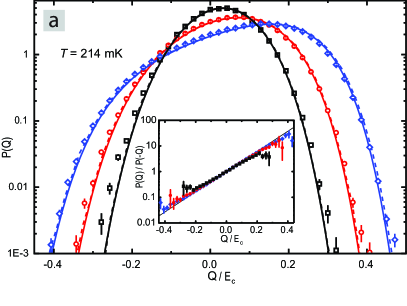
The experimentally obtained distributions for drive frequencies 1, 2 and 4 Hz are presented in Fig. 2(a). The distributions were measured at a bath temperature of 214 mK where the thermally activated tunneling rate at degeneracy was 70 Hz, which is well within the detector bandwidth of about 1 kHz. In addition, we have similar data but in smaller quantities for driving frequencies from 5 Hz to 20 Hz. At frequencies higher than this, the observed distributions deviate significantly from the theoretical prediction due to systematic errors arising from finite readout bandwidth and uncertainty in the event timing. On the other hand, driving frequencies lower than 1 Hz make the measurement susceptible to type charge noise that is ubiquitous in metallic single-electron devices Starmark1999 . In Fig. 2(a), we show also the exact theoretical distributions based on charge kinetics described by the orthodox theory and sample parameters obtained in the manner described above. The theoretical and experimental distributions are in excellent agreement.
To assess quantitatively the systematic error due to finite detector bandwidth, we show in Fig. 2(a) also the distributions obtained from Monte Carlo simulations that incorporate a finite detector rise-time before threshold detection. Visually, the change in the shape of the distribution functions appears small. Quantitatively, we can assess the accuracy of the readout by evaluating the exponential average , which equals 1 for the ideal thermally activated kinetics. From the Monte Carlo simulations, we obtain 1.006 for the 1 Hz and 2 Hz cases, and 1.012 for the 4 Hz case. For the experimental distributions, evaluation of the Jarzynski average yields (for 1 Hz drive), (2 Hz) and (4 Hz), when using the independently determined ratio as described above. The stated uncertainty is the unbiased estimate for the standard deviation of the mean based on the observations, not including the uncertainty of the value of . As the relative uncertainty of the independent estimate is 3%, the Jarzynski equality is shown to hold within experimental accuracy, accounting for the 1% bias from finite detector bandwidth. Conversely, starting from the assumption that JE holds for the experimental distributions, we obtain an estimate .
The possiblity to evaluate numerically the theoretical distribution to a high accuracy enables us to assess the magnitude of sampling error in the experiment. From the acquired experimental data, the distribution could be determined for a range of values where . Evaluating numerically the contribution to JE outside this interval, we see that the deviation due to sampling errors is of the order .
Concerning the Crooks fluctuation theorem in the form of Eq. (4), the forward and backward distributions coincide in the present case of a gate drive that is antisymmetric with respect to the degeneracy point. Hence, we present the experimental ratio as a function of heat in the inset of Fig. 2(a). On a semilogarithmic plot, one expects a linear dependence with the slope equal to , independent of frequency. The experimental data adheres to this quite well, but there is a tendency towards less steep slopes for a lower frequency. This feature can be reproduced in our simulations by assuming a broadening of the distributions due to an additive Gaussian noise having a r.m.s. amplitude of independent of driving frequency. We attribute the broadening to the residual background charge noise that induces fluctuations in the exact position of the degeneracy point.
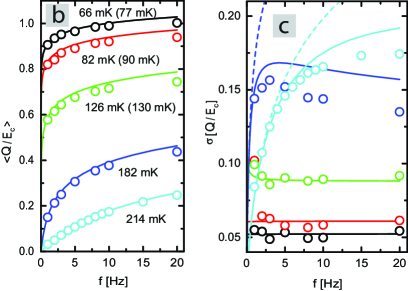
In Figs. 2(b), (c) we present the mean generated heat and distribution width for different bath temperatures in the range and drive frequencies . The experimental results agree well with the values obtained from numerical simulations performed in the same manner as for Fig. 2(a). Theoretical results for the moments of distribution are presented in Ref. Averin_Statistics for a normal state box, and similar results hold for the first two moments in the present NIS case as well. For sufficiently low , the box remains close to local equilibrium during the gate voltage drive. In this case, the transfer of heat into the box reservoirs can be viewed as a linear response to small deviations from the equilibrium caused by the drive. As a linear response, this process satisfies the classical fluctuation-dissipation theorem (FDT) which takes the form . This implies that in the adiabatic limit, the generated heat vanishes not only on average, but for all individual tunneling trajectories. Local equilibrium also implies that the distribution of heat is Gaussian Averin_Statistics similarly to all equilibrium thermodynamic fluctuations. The behavior is evident in the experimental data for = 182 mK and 214 mK, where the slowest drive frequencies produce an almost Gaussian distribution, whereas the distributions become strongly non-Gaussian as the frequency is increased. At lower temperatures, the adiabatic threshold frequency is well below 1 Hz and thus inaccessible in the present experiment. For the simulations at the lowest temperatures, we had to use somewhat higher temperatures than those indicated by the sample stage thermometer in order to reproduce the experimental data [see Fig. 2(b)]. At low temperatures, charge kinetics is expected to depart from the basic thermal activation model with a single heat bath, as discussed earlier. Note that our test of the fluctuation relations is not carried out in this regime.
Thermodynamics of the driven transitions in electronic systems studied in this work will play an important role in the development of reversible information processing devices Toyabe2010 ; *Schaller2011; *Averin2011. We also envision this work to introduce a fruitful testbed of non-equilibrium fluctuation theorems in qualitatively new settings such as engineered environments. It is possible to realize experimentally a regime where the charge transitions are dominated by coupling to an external nonequilibrium environment Saira_EAT . A fully superconducting box Nakamura1999 should enable the study of thermodynamic fluctuations in true quantum regime, which is mostly an unexplored territory in experiments at the moment.
This work has been supported by the Academy of Finland, Väisälä Foundation, ESF research network program EPSD, and European Community’s Seventh Framework Programme under Grant Agreement No. 238345 (GEOMDISS). We thank F. Ritort, T. Ala-Nissilä, and A. Kutvonen for discussions during composing of the manuscript. The authors have no competing financial interests.
References
- (1) J. Liphardt et al., Science 296, 1833–1835 (2002);
- (2) D. Collin et al., Nature 437, 231–234 (2005);
- (3) I. Junier et al., Phys. Rev. Lett. 102, 070602 (2009).
- (4) A. Alemany, M. Ribezzi, and F. Ritort, AIP Conf. Proc. 1332, 96–110 (2011).
- (5) G. M. Wang et al., Phys. Rev. Lett. 89, 050601 (2002);
- (6) V. Blickle et al., Phys. Rev. Lett. 96, 070603 (2006).
- (7) F. Douarche et al., Europhys. Lett. 70, 593 (2005).
- (8) C. Jarzynski, Phys. Rev. Lett. 78, 2690 (1997).
- (9) N. Garnier and S. Ciliberto, Phys. Rev. E 71, 060101(R) (2005);
- (10) Y. Utsumi et al., Phys. Rev. B 81, 125331 (2010).
- (11) B. Küng et al., Phys. Rev. X 2, 011001 (2012).
- (12) D. V. Averin and K. K. Likharev, J. Low Temp. Phys. 62 345 (1985);
- (13) M. Büttiker, Phys. Rev. B 36, 3548 (1987);
- (14) P. Lafarge et al., Z. Phys. B 85, 327 (1991).
- (15) J. Pekola and O.-P. Saira, J. Low Temp. Phys. 169, 70 (2012).
- (16) D. V. Averin and K. K. Likharev in Mesoscopic Phenomena in Solids, edited by B. L. Altshuler, P. A. Lee, R. A. Webb (Elsevier, Amsterdam, 1991), p. 173;
- (17) G.-L. Ingold and Y. V. Nazarov in Single Charge Tunneling: Coulomb Blockade Phenomena in Nanostructures, edited by H. Grabert and M. H. Devoret (Plenum Press, New York, 1992) p. 21.
- (18) D. V. Averin and J. P. Pekola, Europhys. Lett. 96, 67004 (2011).
- (19) See Supplemental Material at [URL] for a detailed description of data analysis and supporting theory.
- (20) G. E. Crooks, Phys. Rev. E 60, 2721 (1999).
- (21) O.-P. Saira et al., Phys. Rev. B 82, 155443 (2010).
- (22) O.-P. Saira et al., Phys. Rev. B 85, 012504 (2012).
- (23) B. Starmark et al., J. Appl. Phys. 86, 2132 (1999).
- (24) S. Toyabe et al., Nat. Phys. 6, 988 (2010);
- (25) G. Schaller et al., Phys. Rev. B 84, 085418 (2011);
- (26) D. V. Averin, M. Möttönen, and J. P. Pekola, Phys. Rev. B 84, 245448 (2011).
- (27) Y. Nakamura, Yu. A. Pashkin, and J. S. Tsai, Nature 398, 786 (1999).
- (28) T. A. Fulton and G. J. Dolan, Phys. Rev. Lett. 59, 109 (1987).