Optical conductivity study of screening of many-body effects in graphene interfaces
Abstract
Theoretical studies have shown that electron-electron (e-e) and electron-hole (e-h) interactions play important roles in many observed quantum properties of graphene making this an ideal system to study many body effects. In this report we show that spectroscopic ellipsometry can enable us to measure this interactions quantitatively. We present spectroscopic data in two extreme systems of graphene on quartz (GOQ), an insulator, and graphene on copper (GOC), a metal which show that for GOQ, both e-e and e-h interactions dominate while for GOC e-h interactions are screened. The data further enables the estimation of the strength of the many body interaction through the effective fine structure constant, . The for GOQ indicates a strong correlation with an almost energy independent value of about 1.37. In contrast, value of GOC is photon energy dependent, is almost two orders of magnitude lower at low energies indicating very weak correlation.
pacs:
73.22.Pr, 78.67.Wj, 07.60.FsTailoring the dielectric interface has been proposed as an immediate step to manipulate the electron-electron (e-e) and electron-hole (e-h) interactions in graphene AntonioRMP as it is two dimensional in structure and also in almost all cases requires a substrate MakPRL ; ChaeNanL ; FeldmanNatPhys ; WeitzSci ; BolotinNat ; ZhangNat . Experimental reports addressing questions whether graphene is a strongly or weakly interacting system have thrown light on the fact that the answer mostly depends on the energy scale of interest ReedScien ; BostwickScien . Optical measurements from far infrared to deep ultra-violet (0.1- 5.5 eV) have been performed on graphene on insulating substrates MakPRL ; KravetsPRB (with negligible screening effect) and on free-standing grapheme ChaeNanL which show prominent contributions from both e-e and e-h interactions as predicted by theoretical calculationsYangPRL . An extreme case of screening by a substrate dielectric interface is to use a metallic substrate, which has a huge supply of free electrons, in close proximity with the graphene layer. For example, metallic substrates have been used for one dimensional system like single walled nanotubes (SWNT) to study the screening of many body effectsLinNatMat . Optical conductivity measurement is not only sensitive to interband transitions and intraband (e.g Drude, e-e interactions) processes but it is also the most direct way to observe the effect of e-h interactions as in optical processes electron excitation creates a concomitant hole state.
The effects of different dielectric environments on the transport properties of graphene highlight the importance of the effective fine structure constant () as one of the parameters of screening JangPRL . The fine structure constant () is the ratio of potential energy to kinetic energy of electrons for free standing graphene, and is , where is Planck’s constant and is the renormalized Fermi velocity near Dirac point, has the nominal value of 2.2 and it indicates that graphene is a strongly interacting system AntonioRMP ; WehlingPRL . However a recent study on highly oriented pyrolytic graphiteReedScien has elucidated the fact that the effective fine structure constant () which is given by , where k and are momentum and energy respectively, may deviate from the value of 2.2 to far lower magnitude – indicating that graphene might be weakly interacting depending on k and . On the other hand when the graphene layer is sandwiched between two dielectric mediums whose complex dielectric constants are and , respectively the effective fine structure constant can be tuned and the new value is given by .
In this letter, real part of the optical conductivity of monolayer graphene has been extracted from measured ellipsometric parameters and . The energy range of measurement is 0.5- 5.3 eV. The details of samples and measurement techniques are described in the Supporting Online Material supplementary . Figure 1a shows that of the graphene layer on quartz (GOQ) (shown in red) has behaviour akin to exfoliated monolayer graphene in different regions of the energy range of measurement. Beyond the infrared range (1.5 eV) starts gradually increasing from the constant value . It may be mentioned that our observed constant value is consistent with other CVD grown grapheneLeeAPL which is slightly less than the universal value observed in case of pristine exfoliated grapheneMakPRL ; ChaeNanL ; NairSciec .
A prominent asymmetric peak in is observed at 4.6 eV which can be attributed to excitonic effects in the optical transitions at the M point in the Brillouin zone of graphene. This peak is a result of the interplay between interband transitions, e-e and e-h interactionsYangPRL . If one considers only band to band transitions using local density approximation (LDA) approach, the optical transition peak should occur at 4.1 eV. By inclusion of the e-e interactions through GW approach, the optical transition peak is predicted at 5.2 eV. By further incorporating the e-h interaction the optical transition peak is predicted to be red shifted by 600 meV from 5.2 eV to 4.6 eVYangPRL .
As shown in Figure 1(a) the most important observation of this study is that graphene on copper substrate (GOC, shown in black) has distinctively different trend of at the ultraviolet range. The peak for optical transitions for GOC is blue shifted to 4.96 eV compared to 4.60 eV as found in GOQ. Interestingly the line-shape of for GOC is symmetric unlike the line shape of for GOQ which possesses asymmetric profile. These two aspects red-shift of the optical transition peak and symmetric line-shape - are the key signatures of the different roles played by e-e and e-h interactions.
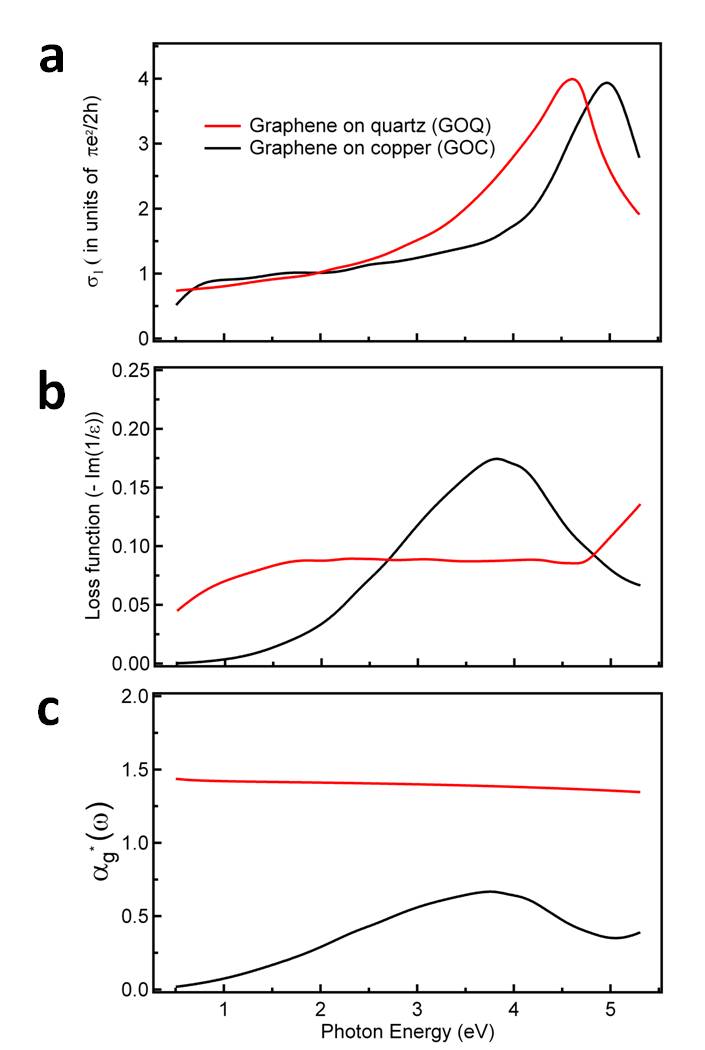
Figure 1(b) shows the Loss function () for both GOQ and GOC. We do not see any structure for GOQ at 4.6 eV as seen in . This is an evidence of the absence of plasmonic contribution to the peak in at 4.6 eV. For GOC we observe a broad structure centered at 3.9 eV which may be attributed to plasmonic excitations. However this is far below the peak seen for at 4.96 eV. This again rules out plasmonic contribution.
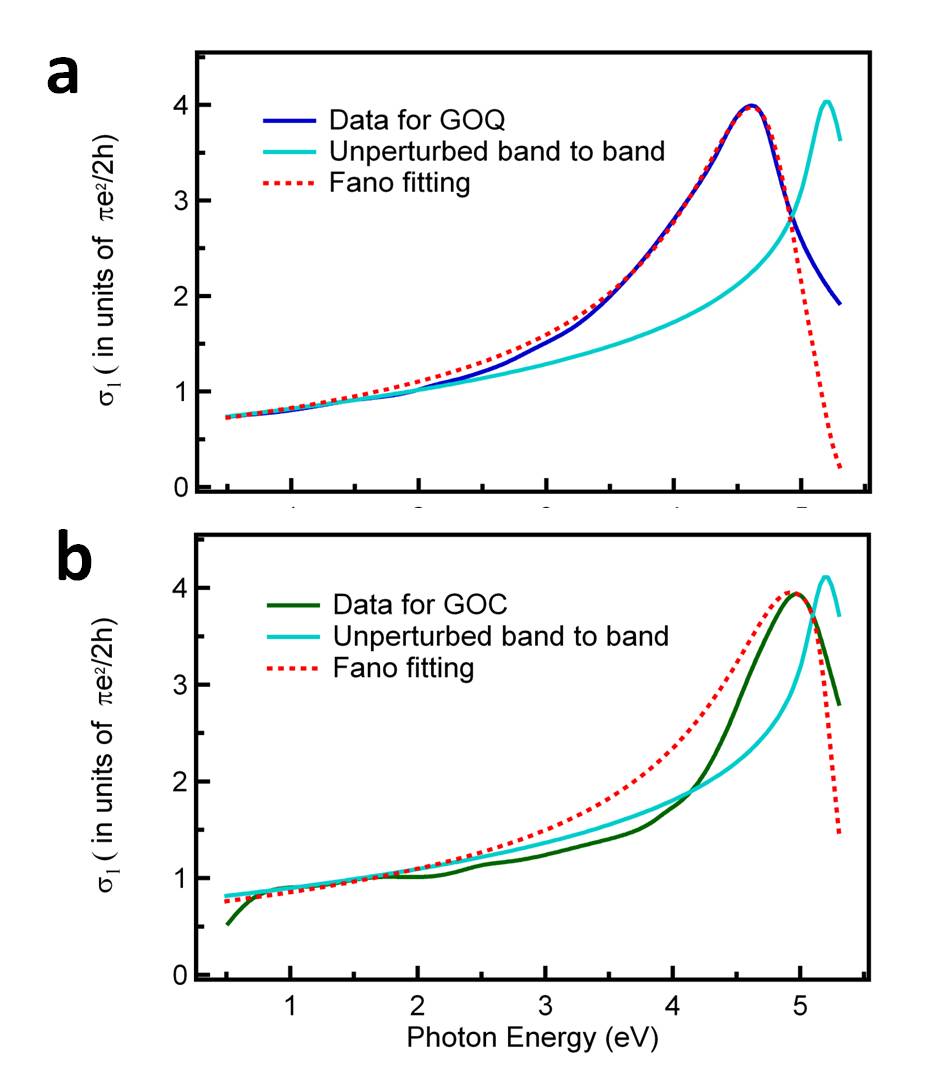
This asymmetric line-shape of the can be interpreted using a phenomenological approach proposed by Fano FanoPR ; PhillipsPR ; Yu ; Phillips which takes into account e-h interactions. In Fano theory discrete excitonic states residing below an electronic continuum couple with the continuum states giving rise to considerable asymmetry in the optical transition strengths near a saddle point singularity. We fit our experimental data using Fano interference analysis by employing a phenomenological relationship where a dominant excitonic state is coupling with the continuumPhillipsPR ; Yu . Figure 2 shows a detailed Fano analysis on the data for GOQ and GOC. The peak position and asymmetry of of GOQ can be well-fitted (the slight mismatch at 1.5 eV 3 eV may be due to inherent quality issue of CVD graphene and above 5 eV the match discrepancy can be attributed to the use of unperturbed band to band transition result instead of exact GW resultMakPRL as the starting point) using this Fano approach with the parameters q = -1.16, = 0.99 eV and = 4.90 eV (see Supporting Online Material supplementary for details). On the contrary the peak position of for GOC is at 4.96 eV and with Fano parameters of q = -0.96, = 0.98 eV and = 5.19 eV we can account for the redshift from the unperturbed peak at 5.2 eV but the distinctively symmetric shape of our result cannot be fitted with this model as seen from Figure 2(b). Therefore it signifies the very weak strength, if any, of excitonic contribution in this redshiftPhillips . This further indicates strong screening of e-h interactions in GOC.
More generally screening effects can be quantified by analyzing the . In Figure 1(c) we show for GOQ and GOC. Here we find that for GOQ, has a value of 1.37 at 4.6 eV and it does not vary by more than in the energy range of our interest (0.5- 5.3 eV). This dynamic is greater than the static = 0.81 which is regularly used to describe correlations in graphene (on quartz or SiO2/Si substrate). This indicates that the dynamical screening in GOQ is weak and so the system can be categorized as a strongly interacting system for this energy range. In the case of GOC, at 4.96 eV is 0.36. It is interesting to note that in contrast to GOQ, varies from 0.02 to 0.67 in the energy range of 0.5 – 5.3 eV for GOC. This basically means that the dynamic screening is stronger than in the case of GOQ as indicated by the lower value of . These results suggest that GOC is a weakly interacting system in comparison to GOQ.
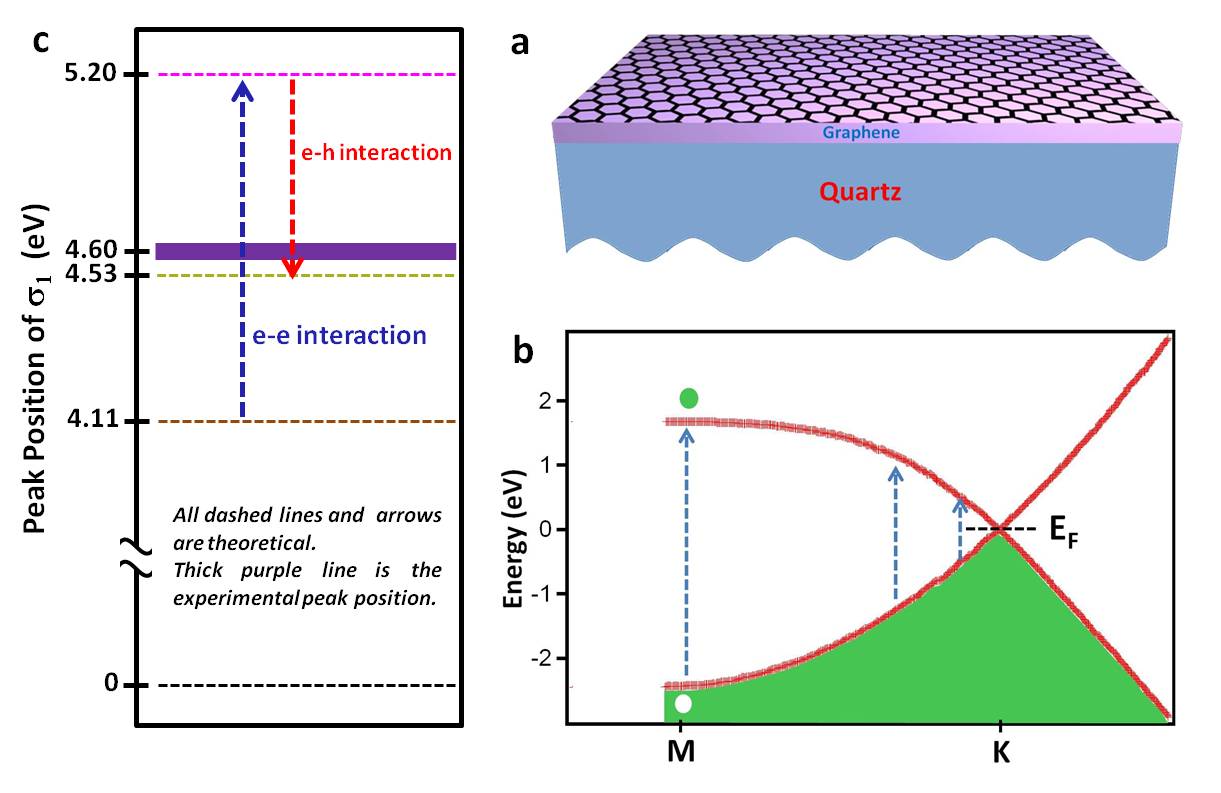
In Figures 3 and 4 we present schematic energy diagrams and optical transition levels in order to explain the observed optical conductivity and possible scenarios for both GOQ and GOC respectively. For GOQ, peak is at 4.6 eV and it can be explained with the existence of both e-e and e-h interactions which are well supported by theoretical modelYangPRL . This suggests that the interactions between graphene and the substrate are weak and the graphene layer behaves almost like free-standing graphene.
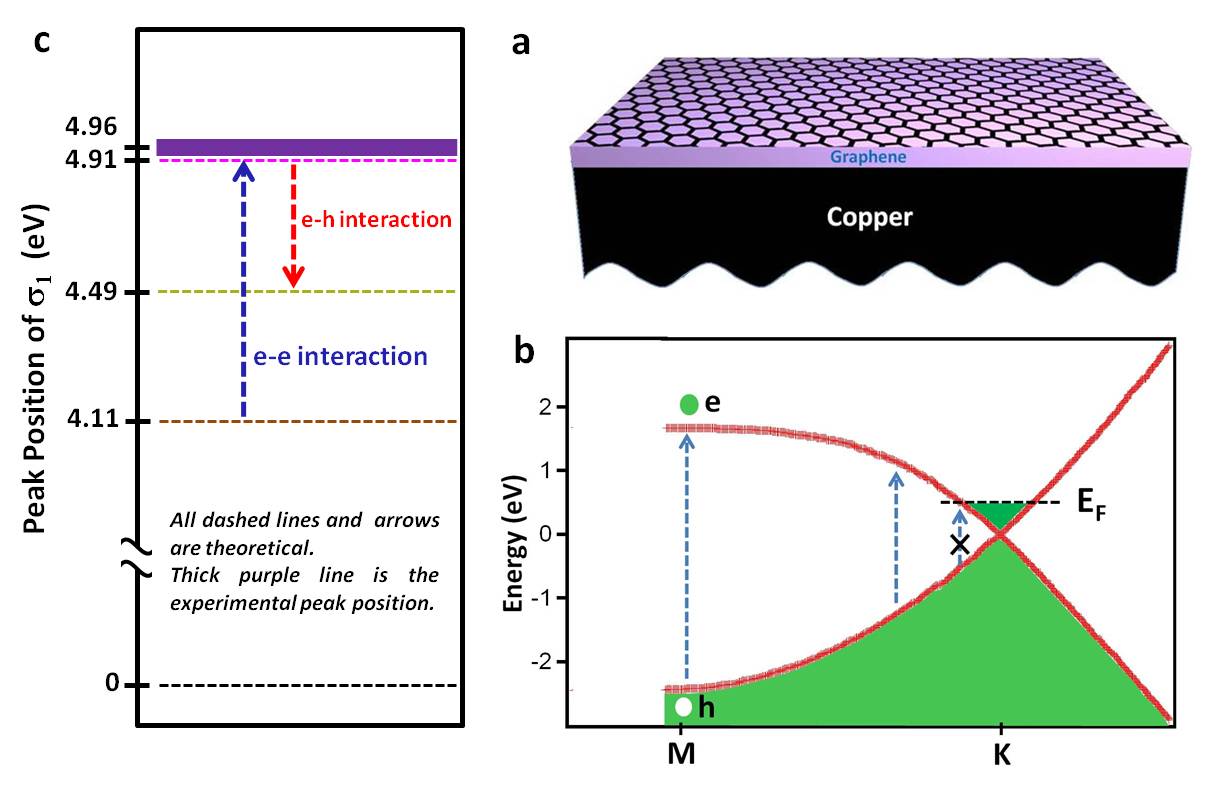
For GOC, is at 4.96 eV and this 360 meV blue shift (from the GOQ peak) is considerably large. This may involve two processes firstly, considerable electron transfer from the metal substrateGiovannettiPRL giving rise to electron doping and secondly, the effect of this electron doping on the optical conductivityYangNanL . Theoretically, for graphene deposited on metal (like Cu, Ni)GiovannettiPRL the Fermi level shifts considerably depending on the work function of the metal as well as the separation between the metal substrate and the graphene layer. For our case, graphene is grown on copper without any other layer in between (see Supporting Online Materialsupplementary ) with a gap of 0.3 nm. This electron doping screens the e-h interactions while e-e interactions are dominant. The scenario depicted in Figure 4 is from predictions using DFT calculations of a Fermi level shift of 0.5 eV above the Dirac point when graphene is in contact with copper substrateGiovannettiPRL . For the case of free standing doped graphene one would expect to see the excitonic peak at almost similar position like in GOQ at 4.49 eVYangNanL due to the presence of both e-e and e-h interactions even while doped.
Another noticeable aspect of our result is the absence of distinct signature of the coupling between the orbital of the carbon atoms and orbital of the copper atoms in . Theoretical studiesGiovannettiPRL ; ZhipingJP have predicted that metals can be broadly divided into two classes depending on the coupling strength of these orbitals. For example in case of graphene on nickel, graphene bandstructure is perturbed heavily due to strong coupling, whereas in case of graphene on copper (which belongs to the other class of metals) graphene still retains most of its intrinsic bandstructure features. However our result shows even smaller coupling in case of graphene on copper than predicted. Firstly we do not see any structure below 5 eV for the of GOC. This is in contrast to theoretical calculations which predicted presence of copper bands at approximately 2 eV below the Fermi energy when the substrate is Cu (111)ZhipingJP . Secondly we do not see a Pauli blockade in for GOC at about 1 eV which translates into about 0.5 eV of Fermi level shift due to charge transfer. Rather we see a dip in the plot at about 0.5 eV which represents a Fermi level shift of less than 0.25 eV. These two aspects may be a signature of weak coupling between polycrystalline copper and graphene.
In conclusion, we observe that the dynamical screening in graphene on metallic substrate is stronger than in the case of graphene on quartz by as large as two orders of magnitude. We propose that the observed blue-shift in the peak position of optical conductivity at the van Hove singularity (at the M point) is the result of the fact that electron-electron interactions are still dominating but electron-hole interactions are strongly screened. Our result opens new paths to study the interplay of e-e and e-h interactions and their individual strengths in many-body physics. Furthermore it demonstrates the suitability of spectroscopic ellipsometry technique to reveal the interactions in graphene interfaces.
Acknowledgements.
We would like to acknowledge the discussion with Vitor Manuel Pereira. This work is supported by NRF-CRP grant Tailoring Oxide Electronics by Atomic Control, MOE Tier 2, NUS YIA, NUS cross faculty grant, FRC, Advance Material (NanoCore) R-263-000-432-646.References
- (1) A. H. Castro Neto et.al, Rev. Mod. Phys 81, 109 (2009).
- (2) K. F. Mak et.al, Phys. Rev. Lett. 106, 046401 (2011).
- (3) D. H. Chae et.al, Nano. Lett. 11, 1379 (2011).
- (4) B. E Feldman et.al, Nature Phys. 5, 889 (2009).
- (5) R. T. Weitz et.al, Science 330, 812 (2010).
- (6) K. I. Bolotin et.al, Nature 462, 196 (2009).
- (7) Y. Zhang et.al, Nature 438, 201 (2005).
- (8) J. P. Reed et.al, Science 330, 805 (2010).
- (9) A. Bostwick et.al, Science 328, 999 (2010).
- (10) C. Jang et.al, Phys. Rev. Lett. 101, 146805 (2008).
- (11) V. G. Kravets et.al, Phys. Rev. B. 81, 155413 (2010).
- (12) L. Yang et.al, Phys. Rev. Lett. 103, 186802 (2009).
- (13) H. Lin et.al, Nature Mat. 9, 235 (2010).
- (14) C. Lee et.al, Appl. Phys. Lett. 98, 071905 (2011).
- (15) See Supporting Online Material.
- (16) R. R. Nair et.al, Science 320, 1308 (2008).
- (17) T. O. Wehling et.al, Phys. Rev. Lett. 101, 026803 (2008).
- (18) C. Giovannetti et.al, Phys. Rev. Lett. 101, 026803 (2008).
- (19) L. Yang, Nano. Lett. 11, 3844 (2011).
- (20) U. Fano, Phys. Rev. 124, 1866 (1961).
- (21) J. C. Phillips, Phys. Rev. 136, A1705 (1964).
- (22) P.Y. Yu and M. Cardona, Fundamentals of Semiconductors: Physics and Materials Properties (Springer, Berlin, 1996).
- (23) J. C. Phillips, Excitons. In The Optical Properties of Solids, Editor: J. Tauc (Academic Press, New York, 1966).
- (24) X. Zhiping et.al, J. Phys.: Condens. Matter 22, 485301 (2010).