Optical and X-ray observations of candidate isolated neutron stars in the G315.42.3 SNR
Abstract
G315.42.3 is a young Galactic supernova remnant (SNR), whose identification as the remains of a Type-II supernova (SN) explosion has been debated for a long time. In particular, recent multi-wavelength observations suggest that it is the result of a Type Ia SN, based on spectroscopy of the SNR shell and the lack of a compact stellar remnant. However, two X-ray sources, one detected by Einstein and ROSAT (Source V) and the other by Chandra (Source N) have been proposed as possible isolated neutron star candidates. In both cases, no clear optical identification was available and, therefore, we performed an optical and X-ray study to determine the nature of these two sources. Based on Chandra astrometry, Source V is associated with a bright star, which had been suggested based on the less accurate ROSAT position. Similarly, from Very Large Telescope (VLT) archival observations, we found that Source N is associated with a relatively bright star (). These likely identifications suggest that both X-ray sources cannot be isolated neutron stars.
keywords:
Optical: stars – neutron stars1 Introduction
The Galactic supernova remnant (SNR) G315.42.3 is a very young object, supposed to be the remains of the historical supernova SN 185 A.D. (Clark & Stephenson 1975). The remnant distance is uncertain, with values ranging from 1 to 2.8 kpc (Kaastra et al. 1992; Rosado et al. 1996; Sollerman et al. 2003). G315.42.3 has been observed in radio (Hill 1967), in the soft X-rays by ROSAT (e.g., Vink et al. 2000), and hard X-rays by ASCA (e.g, Borkowski et al. 2001) and, more recently, both by XMM-Newton and Chandra (Vink et al. 2006). In the optical, the southwest edge of G315.42.3 is associated with the RCW 86 nebula (e.g., Smith 1997). At higher energies, it has been detected at TeV -rays by H.E.S.S. (Aharonian et al. 2009). Its morphology is typical of a young shell-type SNR, but with a marked asymmetry in the X-ray surface brightness profile between the fainter northeast and the brighter southwest edges (Vink et al. 2000), as observed both in radio (Dickel et al. 2001) and in the optical, where only the region associated with the RCW 86 nebula is visible (Smith et al. 1997). This might imply an off-centred cavity SN explosion, with its centre closer to the southwest edge of the SNR and near the centre of the RCW 86 nebula. Recently, Williams et al. (2011) suggested that G315.42.3 is a Type-Ia SNR, based on optical and X-ray spectroscopy of the remnant and the lack of a compact source at the centre, which could be identified as the isolated neutron star (INS) formed out of a Type II SN explosion. In the radio band, Kaspi et al. (1996) could not identify a radio pulsar within the SN shell. In the X-rays, Vink et al. (2000) spotted an unresolved source (hereafter Source V) southwest of the SNR centre, in the direction of the RCW 86 nebula. However, the possible association with a star coincident with the ROSAT 5″ error circle and evidence for long-term variability suggested that this X-ray source was not an INS, although only a better localisation from X-ray observation at higher spatial resolution can either confirm or refute the association. More recently, Gvaramadze & Vikhlinin (2003) found two X-ray sources with Chandra, located on the X-ray bright southwest edge of the G315.42.3 SNR. Only the northernmost one (dubbed Source N) had no optical counterpart () and was proposed as the stellar remnant of the SN explosion. However, its possible identification as an INS has never been confirmed so far. Source N has not been detected in radio. One possibility would be that it is a radio-silent INS, possibly a Compact Central Object, or CCO (De Luca 2008). A search for a stellar remnant in the central part of the SNR was carried out with Chandra by Kaplan et al. (2004), who identified all the detected X-ray sources either as foreground stars or background AGNs. Thus, Source V and N remain the only unidentified X-ray sources potentially associated with the remnant of the SN explosion. We investigated their nature using archival Chandra data to better determine their positions, verify the association of Source V with the bright nearby star, and search for Source N’s optical counterpart in archival Very Large Telescope (VLT) data.
2 Optical observations
Optical images of the RCW 86 nebula, at the southwest edge of G315.42.3 (Fig.1, top left), were obtained in service mode on April, 10 to 12 2010 with the VLT Antu telescope at the ESO Paranal observatory111www.archive.eso.org. The observations were performed with the FOcal Reducer/low dispersion Spectrograph (FORS2) camera (Appenzeller et al. 1998), equipped with its MIT detector, a mosaic of two 2k4k CCDs optimised for wavelengths longer than 6000 Å. The standard low gain, fast read-out mode, and the high-throughput ( Å; Å) filter were used. Images were taken with the standard resolution collimator (025/pixel) and a field–of–view (FOV) of 8. However, due to vignetting the effective sky coverage is smaller, and larger for the upper CCD chip () than for the lower one. Source N was positioned in the upper CCD chip, above the gap between the two chips. A total of 45 exposures of 300 s each were taken under dark time and photometric conditions with an average airmass of and image quality of . We reduced the science images using standard tools in the iraf package ccdred for bias subtraction and flat–field correction. We then aligned and average-stacked the science images using the swarp program (Bertin et al. 2002), applying a filter to reject hot/cold pixels and cosmic ray hits. Since all exposures were taken with comparable image quality, we did not apply any selection prior to the image stacking. We applied the photometric calibration by using the extinction-corrected night zero points computed by the FORS2 pipeline derived from observations of the Landolt’s standard stars (Landolt 1992). We re-computed the astrometric solution of the FORS2 image using stars selected from the Guide Star Catalogue 2 (GSC-2; Lasker et al. 2008). We selected stars evenly distributed in the FOV but far from the CCD edges and the vignetted regions, where geometric distortions are larger. We measured the star centroids through Gaussian fitting using the Graphical Astronomy and Image Analysis (gaia) tool222star-www.dur.ac.uk/pdraper/gaia/gaia.html and used the code astrom333www.starlink.rl.ac.uk/star/docs/sun5.htx/sun5.html to compute the pixel-to-sky coordinate transformation. The rms of the astrometric fit was , in the radial direction. To this value we added in quadrature the uncertainty on the registration of the FORS2 image on the GSC2 grid, (Lattanzi et al. 1997), where is the mean GSC2 positional error and is the number of stars used to compute the astrometric solution. After accounting for the accuracy of the link between the GSC2 and the International Celestial Reference Frame, we estimate an overall () uncertainty on the FORS2 astrometry of .
3 X-ray source optical identification
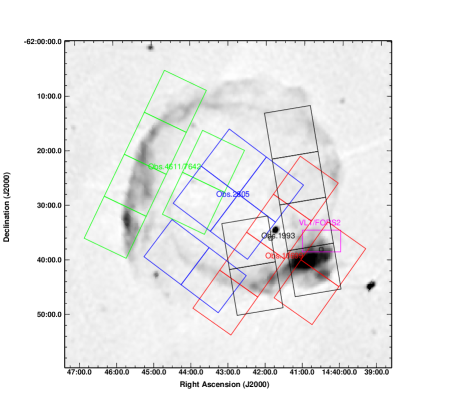
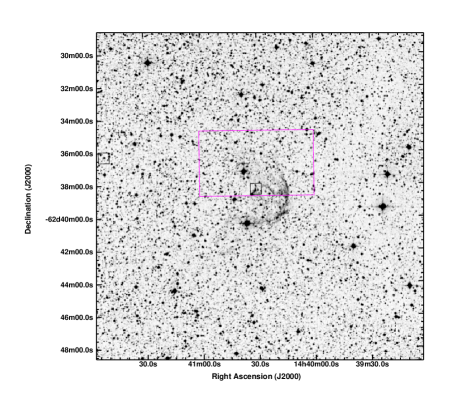
Fig. 1 (top right) shows a DSS-2 image centred on RCW 86, with the FORS2 FOV and the regions around Source V and Source N overlaid. We used Chandra to compute a more precise X-ray position of Source V with respect to that obtained by ROSAT (5″ error radius). We downloaded a short (2 ks) Chandra/ACIS-S observation (Obs. Id. 10699) from the public Chandra Science Archive444http://cxc.harvard.edu/cda. We analysed the dataset with the Chandra Interactive Analysis of Observations (CIAO) software (v. 4.4.2). We extracted an image in the 0.5–6 keV energy range using the original ACIS pixel size (). We ran a source detection using the wavdetect task with wavelet scales ranging from 1 to 16 pixels, spaced by a factor (consistent results were obtained using the celldetect task). We easily detected Source V and computed its position as ; . The short integration prevented us to check the accuracy of the ChandraACIS-S absolute astrometry by cross-correlating positions of field X-ray sources to optical/infrared astrometric catalogues. Indeed, no X-ray sources are detected within 4′ from the aim point, and poor photon statistics hampers accurate localisation of sources at larger off-axis angle (where PSF blurring becomes significant). We attach to the position of Source V, located very close to the aim point (where the accuracy of the ACIS astrometry is optimal) and detected with a good signal–to–noise (38 photons with virtually no background), the nominal ACIS radial uncertainty of 06 (90% confidence level). We repeated the exercise for Source N using a 93 ks Chandra/ACIS-S observation (Obs. Id. 1993). In this case, the much deeper integration allowed us to detect several point X-ray sources in the field, which we used to check the astrometric accuracy. We selected X-ray sources detected at and cross-correlated their positions with the 2 Micron All Sky Survey (2MASS) Catalog (Skrutskie et al. 2006). Unfortunately, we found only one match found within 4′ of the aim point. Thus, we included larger off axis regions. Using 9 matches within 8′, we assessed that no corrections were needed to the ACIS astrometry (r.m.s. difference of per coordinate). We computed the position of Source N as ; , with a nominal radial uncertainty of ( confidence level). This position is consistent with that measured by Gvaramadze & Vikhlinin (2003).
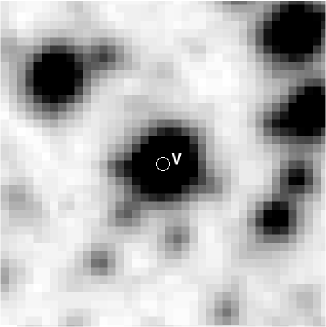
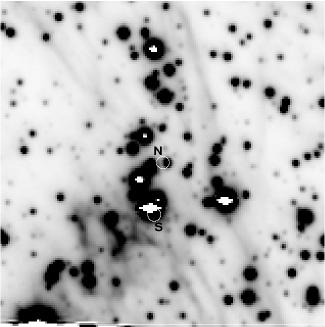
Fig. 1 (bottom left) shows a zoom of the DSS-2 image centred on the Chandra position of Source V. The source is positionally coincident (within the accuracy of the DSS-2 astrometry) with the bright star already proposed by Vink et al. (2000) as its potential counterpart. Thus, thanks to the factor of 10 better positional accuracy of Chandra with respect to ROSAT, we can conclude that Source V is associated with this star and cannot be an INS. This means that Source N remains the only possible candidate. Fig. 1 (bottom right) also shows a zoom of the FORS2 V-band image around Source N’s position. The position of Source S of Gvaramadze & Vikhlinin (2003) is also shown. However, this was already excluded by these authors as a candidate INS, based on its association with a DSS-2 star (V), saturated in the FORS2 images. We found a point source overlapping the revised Chandra error circle of Source N, which we propose as its candidate optical counterpart. We computed its flux through standard aperture photometry and derived a magnitude . To quantify the robustness of the association, we computed the probability of a chance coincidence between Source N and its candidate counterpart. We defined it as , where is the matching radius (07, taking account both the uncertainties of the Chandra position and the accuracy of our VLT astrometry), and is the density of stellar objects in the FORS2 FOV with magnitudes comparable to the candidate counterpart. For arcsec-2, this gives . Unfortunately, there are no other images of the field in the ESO archive, to obtain colour information on Source N’s counterpart. Using a DSS-2 red-band image, Gvaramadze & Vikhlinin (2003) set an upper limit of on Source N, which implies a . From the same image we estimated a upper limit of and . However, due to the high sky background ascribed to a group of bright stars at from Source N (Fig. 1, bottom right), unresolved in the DSS-2 image, these upper limits are affected by a large uncertainty. This is also true for those obtained from 2MASS images. Thus, we cannot derive tight constraints on the colours of Source N’s counterpart.
4 X-ray spectral and timing analysis
We used the available X-ray and optical data to determine whether Source N can be an INS. Deep observations of Source N’s field have been obtained both by Chandra (Obs. Id. 1993; 93 ks) and XMM-Newton (Obs. Id. 0504810401; 72 ks). Unfortunately, due to the positional coincidence with a bright X-ray filament of the SNR, which dominates the emission below 2 keV, Source N is possibly detected only at energies above 2 keV in the XMM-Newton observation, which makes such data not suitable for the spectral analysis. Thus, we used the ChandraACIS-S data to characterise the X-ray spectrum of Source N. We extracted counts for both the point source and background using the specextract script in CIAO. We selected source photons from circular apertures with a 2″ radius and background photons from two circles with a radius of 5″. As done by Kaplan et al. (2004), we compared the source counts in the low (0.3–2 keV) and hard (2–8 keV) energy bands and computed the hardness ratio , where and are the counts in the hard and low energy bands, respectively. The is compatible, within the observed scatter, with those of the X-ray sources detected by Kaplan et al. (2004) at the centre of G315.42.3. For Source V we obtained , which is also compatible with the range of values for these sources. In particular the is consistent with Source V being a star, as implied by its optical identification. We did a more qualitative spectral modelling of Source N using XSPEC (v. 12.7). The spectrum of Source N is well described (reduced , 28 d.o.f.) by a power law (PL) with photon index , absorbed by an hydrogen column density N cm-2. We note that our PL spectral index is consistent with that measured by Gvaramadze & Vikhlinin (2003), although they fixed the value of cm-2. An equally good fit (reduced , 28 d.o.f.) can be obtained using a simple blackbody (BB) spectrum with kT= keV, absorbed by a low column density N cm-2. An optically thin Raymond-Smith (RS) thermal plasma model (raymond in XSPEC) with kT keV, abundance solar values and an absorbing column N cm-2 also fits well the data (reduced , 27 d.o.f.). We also fitted the Chandra spectrum with two-component models, as done by Gvaramadze & Vikhlinin (2003), but the fit quality does not improve noticeably with respect to single-component ones. Thus, from the X-ray spectrum alone we cannot unambiguously determine the nature of Source N. To further investigate the possibility that Source N is an INS, we searched for periodicity in the XMM-Newton/EPIC-pn data. However, since these were taken in full frame mode (frame time of 73.4 ms), the periodicity search is only sensitive to periods 146.8 ms. We used tools in the SAS package (v. 11.0) to extract X-ray events from a 20 ″ circle centred at the computed Chandra position of Source N and converted their times of arrival (TOAs) to the Solar System barycentre. We performed a search for coherent pulsations in different energy bands (mainly above 2 keV) using the powspec tool in FTOOLS, but we found no significant signals. Unfortunately, both the limited number of source counts against the high background produced by the bright X-ray filament of the SNR and the contamination of Source S, only 6 ″ away, did not allow us to obtain constraining limits on the pulsed fraction.
5 Discussion and conclusions
To establish the nature of Source N, we evaluated whether the flux of its optical counterpart is compatible with what expected for an INS. For the estimated age of G315.42.3 ( yrs) and an optical luminosity comparable to the Crab pulsar, we would expect a flux of –21.1, after re-normalising for the G315.42.3 distance (1–2.8 kpc) and interstellar extinction –5, inferred upon the NH derived from the PL fit to the Chandra spectrum using the relation of Predhel & Schmitt (1995). These values are compatible with the flux of Source N’s counterpart (), at least for the highest values of the interstellar extinction and distance. Alternatively, Source N might be a CCO. For a rotational energy loss rate erg s-1 ( see De Luca et al. 2012 and references therein), the expected optical luminosity would then be at least two orders of magnitude lower than the Crab pulsar, yielding a flux . We also verified whether the X-ray–to–optical flux ratio of Source N is compatible with that of an INSs. According to the PL model, the observed flux in the 0.3–8 keV energy range is erg cm-2 s-1, corresponding to an unabsorbed flux erg cm-2 s-1. The unabsorbed optical flux of Source N’s optical counterpart, computed upon the corresponding NH, is erg cm-2 s-1. Thus, the unabsorbed X-ray–to–optical flux ratio of Source N would be –0.32, by far lower than expected for an INS, for which this ratio is usually of 1000, or higher (e.g., Mignani 2011). Assuming other best-fitting X-ray spectral models also gives very modest values of the ratio. This implies that Source N must be a different type of X-ray source, maybe an AGN, which would be compatible with its ratio (e.g. la Palombara et al. 2006) and its possible PL spectrum. Spectroscopy of its optical counterpart is needed to determine the nature of Source N. Thus, from their associations with bright optical counterparts, we conclude that neither Source V nor Source N are INSs. No other unidentified point-like X-ray sources which can be considered possible INS candidates have been discovered by Chandra surveys of G315.42.3. The available Chandra observations (Fig. 1, top left) cover a large fraction of the SNR. In particular, the most likely locations where the compact remnant of the SN explosion is expected to be found, i.e. the central regions of the SNR and the RCW 86 nebula, have been deeply scrutinised (e.g., Kaplan et al. 2004; Gvaramadze & Vikhlinin 2003). Thus, it is unlikely that potential INS candidates were missed. We conclude that the lack of an identified INS supports the conclusion that G315.42.3 was not born after a Type II SN explosion (Williams et al. 2011).
Acknowledgments
RPM thanks Dave Green for useful comments on G315.42.3.
References
- Aharonian et al. (2009) Aharonian, F. A., Akhperjanian, A. G., de Almeida, U. B., et al., 2009, ApJ, 692,1500
- Appenzeller et al. (1998) Appenzeller, I., Fricke, K., Fürtig, W., et al., 1998, The Messenger, 94, 1
- Bertin et al. (2002) Bertin, E., Mellier, Y., Radovich, M., et al., 2002, in ADASS XI, ASP Conf. Series, 281, 228
- Bock et al. (1999) Bock, D., Large, M.I., & Sadler, E.M., 1999, AJ, 117, 1578
- Borkowski et al. (2001) Borkowski, K. J., Rho, J., Reynolds, S. P., Dyer, K. K., 2001, ApJ, 550, 334
- De Luca (2008) De Luca, A., 2008, in 40 Years of Pulsars: Millisecond Pulsars, Magnetars and More. AIP Conf. Proc., Vol. 983, p. 311
- De Luca et al. (2012) De Luca, A., Salvetti, D., Sartori, A., et al., 2012, MNRAS, 421, L72
- Dickel et al. (2001) Dickel, J. R., Strom, R. G., & Milne, D. K., 2001, ApJ, 546, 447
- Gvaramadze & Vikhlinin (2003) Gvaramadze, V. V., & Vikhlinin, A. A., 2003, A&A, 401, 625
- Hill (1967) Hill, E. R. 1967, Australian J. Phys., 20, 297
- Kaastra et al. (1992) Kaastra, J. S., Asaoka, I., Koyama, K., & Yamauchi, S., 1992, A&A, 264, 654
- Kaplan et al. (2004) Kaplan, D. L., Frail, D. A., Gaensler, B. M., et al., 2004, ApJS, 153, 269
- Kaspi et al. (1996) Kaspi, V. M., Manchester, R. N., Johnston, S., et al., 1996, AJ, 111, 2028
- Lasker et al. (2008) Lasker, B. M., Lattanzi, M. G., McLean, B. J., et al.,2008, AJ, 136, 735
- Landolt (1992) Landolt, A.U. 1992, AJ, 103, 340
- La Palombara et al. (2006) La Palombara, N., Mignani, R. P., Hatziminaoglou, E., et al., 2006, A&A, 458, 245
- Lattanzi et al. (1997) Lattanzi, M. G., Capetti, A., Macchetto, F. D., 1997, A&A, 318, 997
- Mignani (2011) Mignani, R.P., 2011, AdSpR, 47,1281
- Rosado et al. (1996) Rosado, M., Ambrocio-Cruz, P., Le Coarer, E., & Marcelin, M., 1996, A&A, 315, 243
- Smith (1997) Smith, R. C., 1997, AJ, 114, 2664
- Williams et al. (2011) Williams, B.J., William, P.B., Blondin, J.M., et al., 2011, ApJ., 741, 96
- Skrutskie et al. (2006) Skrutskie, M. F., Cutri, R. M., Stiening, et al., 2006, AJ, 131, 1163
- Sollerman et al. (2003) Sollerman, J., Ghavamian, P., Lundqvist, P., & Smith, R. C. 2003, A&A, 407, 249
- Vink et al. (2000) Vink, J., Bocchino, F., Damiani, F., Kaastra, J.S., 2000, A&A, 362, 711
- Vink et al. (2006) Vink, J., Bleeker, J., van der Heyden, K., et al., 2006, ApJ, 648, L33