Measurement of Effective using Baseline Differences of
Daya Bay, RENO and Double Chooz Reactor Neutrino Experiments
Abstract
In 2011 and 2012, three reactor neutrino experiments, Double Chooz, Daya Bay and RENO showed positive signals of reactor neutrino disappearance and measured a mixing parameter at average baselines 1.05, 1.65 and 1.44 km, respectively. It is possible to measure effective ( defined in two flavor oscillation formula, hereafter referenced as ) from distortion of neutrino energy spectrum ( dependence of the oscillation) in those experiments. However, since it requires a precise energy calibration, such measurements have not been reported yet. can also be measured from baseline () dependence of the neutrino oscillation. In this paper is measured from disappearance probabilities of the three reactor experiments which have different baselines, to be eV2, where the errors are two (one) dimensional uncertainties. This is consistent with measured by disappearance in accelerator experiments. Importance of measurement and future possibilities are also discussed.
I Introduction
Neutrino oscillation is, so far, the only firm phenomenon which is not accounted for by the standard model of elementary particles, which assume neutrinos as massless.
The neutrino oscillation is, like other oscillations, such as
,
(CP violation),
(Cabbibo angle),
(isospin),
(Weinberg angle),
in hydrogen atom
(21 cm HI line) etc,
assumed also to carry very important physics and we should be able to learn much about our world from it.
There are six parameters in standard three flavor neutrino oscillation PDG10 .
Three mixing angles between flavor eigenstates and mass eigenstates: , , ,
one CP violating imaginary phase: and
2 independent squared mass differences: , where are neutrino masses (, , ) of the three mass eignestates
(, , )
which correspond to the largest component of , respectively.
Before 2011, , , ,
were measured by various experiments and observations PDG10 .
was known to be small, , from Chooz reactor neutrino experiment CHOOZ99 .
In order to measure , to determine mass hierarchy and to solve degeneracy, has to be relatively large.
Thus finite value of had been eagerly sought for.
The years 2011 and 2012 will be regarded as an epoch making ones of neutrino experiments.
T2K group showed 6 appearance candidates over 1.5 expected backgrounds in June 2011 T2K11 .
MINOS group showed also an indication of appearance MINOS_th13_11 .
Double Chooz showed an indication of the reactor neutrino disappearance in November, 2011 DC11 .
Daya Bay and RENO showed more precise disappearances on March and April 2012, respectively DB12 ; RENO12 .
In June 2012, at neutrino conference held in Kyoto, Double Chooz DC_Nu12 , Daya Bay DB_Nu12 , T2K T2K_Nu12 and MINOS MINOS_Nu12 updated their measurements.
All those results show relatively large and have opened up a brilliant path to future neutrino experiments.
Reactor neutrino oscillation probability is expressed as follow.
| (1) |
where, is neutrino energy ( a few MeV) and is baseline (1 2 km). is an ”effective” squared mass difference often mentioned as in two flavor analyses. In three flavor oscillations, it is an average of and , as will be described in the next section. In principle both and , can be measured from the oscillation. However, all the reactor neutrino experiments use , which was measured by disappearance by MINOS group MINOS_dm31_11 , as to extract since the difference between them is in an order of which is smaller than current accuracy of the measurements.
It is important to measure independently from to check if the standard three flavor scheme is correct. If there is significant difference between and , it indicates an existence of new physics. Moreover if they are measured with precision of or better, mass hierarchy can be solved and may be measured as described in the next section.
Experimentally, can be measured by analyzing either dependence of the oscillation or dependence of the oscillation.
Both methods use independent information, namely energy distortion and normalization, so that combining both analyses, accuracy of the will improve.
The former requires a precise energy calibration and no results have been reported yet.
The latter analysis can be performed by combining currently available disappearance information at different baselines.
In this paper is measured using reported
and baseline of each reactor experiment.
The contents of this paper is based on our poster presentation in the conference of neutrino 2012 Thiago12 .
In next section, neutrino oscillation formula is described stressing on relation
between and and importance of measurement will be discussed.
In section-III, how we treat reactor neutrino will be described.
In section-IV, most recent Double Chooz, Daya Bay and RENO results DC_Nu12 ; DB_Nu12 ; RENO12 are combined and
is extracted.
In section-V, a new experiment is proposed to measure more precisely by
using the reactor complementarity.
II Neutrino Oscillation Formula and Effective
The mixing matrix between flavor eigenstats and mass eigenstats is PDG10 ,
| (2) |
where is an index of flavor () and is an index of mass eigenstates (), , , and will be used later. is so called CP violating imaginary phase. Currently these parameters are measured as follows Fogli_Nu12 . and eV2.
Neutrino oscillation probability going to the same flavor is expressed by following formula,
| (3) |
where .
The second term in right hand side is called disappearance probability.
This oscillation formula is valid for both neutrino and antineutrino cases.
Reactor neutrino experiments use generated by -decays of the fission elements in the reactor core.
Energy of the neutrino is a few MeV.
At around the first oscillation maximum of , survival probability of is expressed as,
| (4) |
On the other hand, the survival probability of high energy which is produced by accelerator is,
| (5) |
Usually oscillation data are analyzed by assuming two flavor oscillation formula,
| (6) |
and the measured mass square difference corresponds to a weighted mean of and Nunokawa05 ,
| (7) |
They are called effective . Note that is not a difference of the mass square and is positive definite. Since there is a relation
| (8) |
in the standard three flavor scheme, the difference of and is expressed as follows.
| (9) |
where the overall sign depends on mass hierarchy. If , it is normal hierarchy, and vise versa. In order to distinguish the mass hierarchy cases, it is necessary to distinguish the separation of 1.73.1% depending on . has been measured with precision of 3.5% Fogli_Nu12 . So far there has been no reported measurement of and this paper is on the first measurement of it. If difference between and is larger than 1.6%, it can not be explained by the standard three flavor oscillation scheme. If both and are measured with accuracy 1% or better in the future, the mass hierarchy and can be measured.
III Reactor Neutrino Oscillation
In nuclear reactors uranium and plutonium perform fission reaction; after absorbing a thermal neutron they break up into two large nuclei called fission products, and two or three neutrons which sustains the chain reaction of the fission. The fission products are generally neutron rich nuclei and unstable. They perform -decays on average before becoming stable. In each -decay, a is produced. On the other hand, 200 MeV of energy is released per fission Bugey94 , which means are produced every second in a typical power reactor with 3 GW thermal energy. At 1 km from such reactors, flux amounts to /s/cm2. The energy spectrum of the reactor neutrinos is a sum of the energy spectrum of neutrinos originated from the four fissile elements.
| (10) |
where is reactor neutrino spectrum per fission from fissile element and is a fraction of fission rate of fissile element . There is a relation . For equilibrium light water reactors, are similar and we use the values in Bugey paper Bugey94 , namely = 0.538: 0.078: 0.328: 0.056. In this study, is approximated as an exponential of a polynomial function which is defined in Mueller11 ,
| (11) |
In reactor neutrino experiments, usually organic liquid scintillator is used to detect . It is rich in free protons and reactor performs inverse -decay interaction with a proton.
| (12) |
This is an inverse process of neutron -decay (IBD) with very small and the cross section is precisely calculated from the neutron lifetime Vogel99 . In this analysis, information of absolute normalization is not necessary. The energy dependence of the IBD cross section is,
| (13) |
The disappearance probability, , can be related to the oscillation parameters such as KASKA06 ,
| (14) |
Reactor measurement of is a pure measurement in contrast to accelerator based measurements which depend on unknown parameters. It means that by combining reactor results and accelerator results, information of such unknown parameters can be derived Minakata03 . Under such motivations, several reactor- experiments were proposed in the past WhitePaper04 and now Double Chooz, Daya Bay and RENO experiments have published positive results of the reactor neutrino disappearance and measured . These experiments make use of the same concept to reduce systematic uncertainties significantly Kr2Det01 over the previous experiments of Chooz CHOOZ99 and PaloVerde PaloVerde01 . That is, they construct far detector(s) at around oscillation maximum and measure the ”oscillated” spectrum. On the other hand, near detector(s) with same structure as the far detector is constructed at around a few hundreds of meters from their reactors to measure the neutrino spectrum before the oscillation. By comparing the data taken by the near and far detectors, the only effect caused by the oscillation can be derived by canceling systematic uncertainties of reactor neutrino flux and detection efficiencies. The flux-weighted average baselines of the far detectors, , for the three reactor experiments are 1.05 km for Double Chooz, 1.44 km for RENO and 1.65 km for Daya Bay, respectively. The average baseline of RENO experiment was calculated using neutrino flux shown in RENO_Nu12 and distances between the far detector and each reactor. Published values are used for Daya Bay and Double Chooz.
IV Combination of the results from the three Reactor Experiments
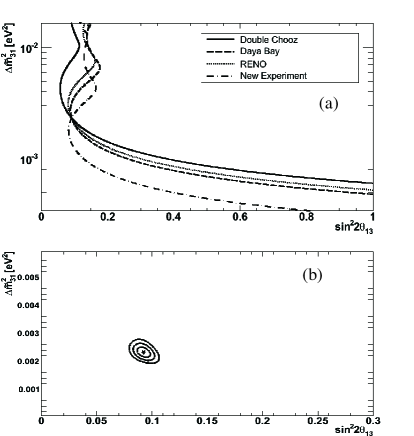
From measured disappearance probability, an allowed line can be drawn in parameter space using the relation (14). Since the baselines are different for the three reactor neutrino experiments, there are three different allowed lines as shown in fig.-1(a).
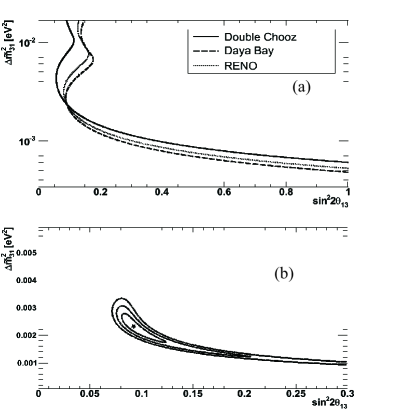
The point of intersection indicates the solution of and . In real experiments, due to errors, the three lines do not cross at same point. When combining different reactor results, values are calculated by using following formula for each point of the parameter space.
| (15) |
where is index of the three experiments and is measurement error of experiment-. Fig.-1(b) shows contour of the significance in case each experiment measures the disappearance with 0.5% accuracy. In this case, can be determined with precision of with two (one) dimensional uncertainty. The large difference between the one dimensional error and the two dimensional error is because the shape of one contour island has long tail as shown in fig.-1(b). Since there are two parameters to measure, at least three experiments are necessary to redundantly measure the parameters.
In the actual analysis, is not directly written in papers and it is calculated from measured and flux-weighted mean distance . In their papers, were derived by assuming the MINOS MINOS_dm31_11 . Relations between these parameters and the disappearance probability, and allowed line are shown below.
| (16) |
The calculated disappearance probabilities are shown in table-1 together with other parameters.
| Item | Double Chooz | Daya Bay | RENO |
|---|---|---|---|
| [km] | 1.05 | 1.65 | 1.44 |
The were measured using both near and far detector at Daya Bay and RENO but only far detector was used in Double Chooz experiment. It is important to point out that although the reactor experiments assume to extract , this analysis is independent of the assumption for the first order. If the experiments used different , they would obtain different but the calculated by the equation (16) would be the same. was used just as a reference point. Fig.-2 shows the combination of the three reactor experiments calculated this way.
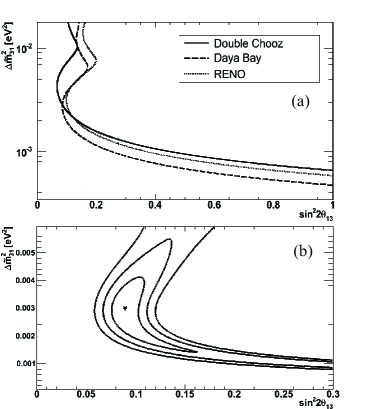
The most probable oscillation parameters and their errors are,
| (17) |
where the errors are for two (one) dimensional uncertainty. This result is consistent with within one and there is no deviation from 3 flavor oscillation within this accuracy. The most probable value coincides with the Daya Bay result but this has meaning that it was derived without assuming . The minimum is 0.43 with one degree of freedom which means that the results of three reactor experiments are consistent with each other.
Baseline dependence of observed disappearance probability and various expectation lines are shown in fig.-3.
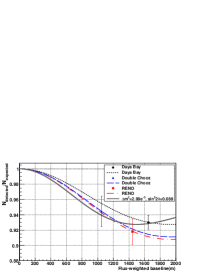
This figure clearly shows the relation of the calculated disappearance probabilities and expected oscillation patterns. The meaning of disappearance probability is also described in its caption. In the near future, errors of the experiments are expected to improve much and the oscillation pattern will be determined much more precisely.
V Future possibilities
It is important to evaluate how precisely we can measure since it may resolve the mass hierarchy comparing with in the future. In order to make the most of the reactor complementarity, we studied a case to add a fourth experiment and calculated an optimum baseline to measure by combining with the current three experiments. Fig.-4 shows dependence of the two dimensional uncertainty on baseline of the fourth experiment.
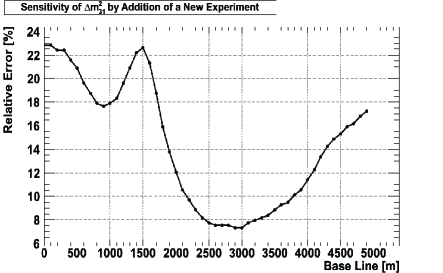
The accuracy improves rapidly when exceeds Daya Bay baselines of 1.6km and reaches to 7% at 2.5 km. This is because that the tail of the island in the sensitivity contour plot vanishes thanks to the almost perpendicular intersection of the fourth allowed line. Fig.-5 shows sensitivities with the fourth experiment with baseline 2.5 km. Since the combined allowed region no more has tails, one and two dimensional errors become similar.
This baseline is mere 1.5 times of Daya Bay far detector baselines and thus it is not unrealistic.
After detailed energy calibrations are finished, the current reactor experiments will perform spectrum shape analysis to extract .
Since the shape analysis and the baseline analysis use independent information, the accuracy of the is expected to improve by combining them.
However, in order to determine the mass hierarchy, one step more improvement of the accuracy will be needed for both and .
VI Summary
In this paper, measurements of by using the baseline differences between currently running reactor neutrino experiments were studied and we obtained following results.
(1) About motivations, independent measurement of is important with following reasons.
(i) The standard three flavor oscillation scheme can be tested.
(ii) Consistency among results from reactor neutrino experiments can be checked.
In order to perform the consistency check, at least three experiments are necessary.
(iii) It may resolve mass hierarchy and give information of in future experiments.
(iv) The reactor complementarity method uses independent information from spectrum shape analysis and accuracy of will improve if they are combined.
(2) The current data from Daya Bay, RENO and Double Chooz were combined and
eV2 was obtained, where the first (second) error was two (one) dimensional uncertainty.
This is consistent with measured by the accelerator experiment.
Minimum was small which shows that the results of the three experiments were consistent with each other.
(3) It was demonstrated that could be measured with precision
23(9) % by combining the three experiments if the error for their disappearance probabilities would reach 0.5%.
(4) A new detector with baseline 2.5 km will reduce both the one and two dimensional uncertainties of to by combining with the current three reactor experiments.
Acknowledgement
This work was supported by Ministry of Education, Culture, Sport and Technology of Japan; Grant-in-Aid for Specially Promoted Research (20001002) and GCOE programs of Tohoku Univ. We appreciate Dr. H. Nunokawa, Dr. H. Watanabe, Dr. F. Kaether, Dr. P. Chimenti and Double Chooz Japan group for useful discussions and comments.
References
- (1) K. Nakamura et al. (Particle Data Group), J. Phys. G 37, 075021 (2010).
- (2) M. Apollonio et al. (Chooz Collaboration) Phys. Lett. B466(1999)415.
- (3) K. Abe et al. (T2K Collaboration), Phys. Rev. Lett.107 (2011) 041801.
- (4) P. Adamson et al. (MINOS Collaboration), Phys. Rev. Lett. 107, 181802 (2011).
- (5) Y. Abe et al. (Double Chooz Collaboration), Phys. Rev. Lett.108 (2012) 131801.
- (6) F.P. An et al. (Daya Bay Collaboration), Phys. Rev. Lett. 108 (2012) 171803.
- (7) J.K. Ahn et al. (RENO Collaboration), Phys. Rev. Lett. 108 (2012) 191802.
- (8) M. Ishitsuka, Invited talk on ’Double Chooz Results’, http://neu2012.kek.jp/.
- (9) D. Dwyer, Invited talk on ’Daya Bay Results’, http://neu2012.kek.jp/.
- (10) T. Nakaya, Invited talk on ’Results from T2K’, http://neu2012.kek.jp/.
- (11) R. Nichol, Invited talk on ’Final MINOS Results’, http://neu2012.kek.jp/.
- (12) P. Adamson et al. (MINOS Collaboration), Phys. Rev. Lett. 106: 181801, (2011).
- (13) T.J.C. Bezerra, H. Furuta and F. Suekane, Neutrino2012, Poster ID.250-1, 4.June.2012, http://neu2012.kek.jp/.
- (14) G.L. Fogli, Invited talk on ’Global Analysis of Neutrino Oscillations’, http://neu2012.kek.jp/.
- (15) H. Nunokawa et al. Phys. Rev. D72 (2005), 013009.
- (16) Y. Declais et al. Phys. Lett. B 338 (1994), 383.
- (17) Th.A. Mueller et al. Phys.Rev. C83 (2011) 054615.
- (18) P. Vogel and J.F. Beacom, Phys. Rev. D 60, 053003(1999).
- (19) M. Aoki et al. (KASKA collaboration.) hep-ex/0607013, (2006).
- (20) H. Minakata et al. Phys. Rev. D 68, 033017 (2003) and Erratum Phys. Rev. D 70, 059901(E).
- (21) K. Anderson et al. (International Reactor Working Group), hep-ex/0402041, (2004).
- (22) Yu. Kozkov, L. Mikaelyan, V. Sinev, hep-ph/0109277, (2001).
- (23) F. Boehm et al. Phys. Rev. D64 (2001) 112001.
- (24) S-B. Kim, Invited talk on ’Results from RENO’, http://neu2012.kek.jp/.