H-alpha survey of nearby dwarf galaxies
Abstract
We present the imaging data and flux measurements for 30 dwarf galaxies in the Local volume. The fluxes are used to derive the galaxy star formation rate, SFR. The sample of observed galaxies is characterized by the following parameters: the median distance of 7.5 Mpc, the median blue absolute magnitude of , and median SFR of –2.0 dex. Two dSph members of the Local Group: Cetus and Leo IV do not show signs of star formation on the rate of –5.4 dex and –7.0 dex, respectively. The BCD galaxy ESO 553-46 has one of the highest specific SFR among the Local volume galaxies.
keywords:
dwarf galaxies: star formation1 Introduction
Since 2004, a survey program to map emission in galaxies belonging to the Local volume (LV) with distance Mpc has been underway using the 6-m telescope at the Special Astrophysical Observatory of Russian Academy of Sciences (SAO RAS). This project is approaching completeness, and the basic results have been published in a series of papers: Karachentsev et al.(2005), Kaisin & Karachentsev (2006, 2008), Kaisin et al. (2007, 2011), and Karachentsev & Kaisin (2007, 2010). In parallel to our survey, similar observations of nearby galaxies in the line were performed also in Cambridge and Arizona universities, which review is published by Kennicutt et al. (2008). At present, the degree of completeness of the survey of the LV objects exceeds 90% in the Northern hemisphere, but the observations in the Southern hemisphere have not been so successful so far. Essential input to the survey of northern LV galaxies was introduced by observations with the 6-meter BTA telescope of SAO RAS. For a continuation of the survey into the southern sky we used facilities of the 2-meter telescope of Girawali observatory (IUCAA) situated at the geographic latitude of . In this paper we present results from the observing runs during 2009-2010, which have yeilded fluxes and SFR for 30 nearby dwarf galaxies.
2 Observations and image processing
Observations of the nearby dwarf galaxies were performed using the 2-m telescope at the IUCAA Girawali Observatory, located near Pune, India. The average seeing was 1.5′′ during most of the observing period. Images of the galaxies were recorded with the IUCAA Faint Object Spectrograph and Camera instrument, equipped with a EEV CCD which provides a 10.5′ field of view with a resolution of 0.31′′ per pixel. The images were obtained via an interference filter with an effective wavelength 6563Å and bandwidth FWHM = 84Å, and also with the standard wide-band -filter to subtract a continuum. The typical exposure time was 1200 sec in the line and 600 sec in the continuum. Since the range of radial velocities in our sample is small, we used one and the same filters for all the observed objects.
The ESO-MIDAS astronomy data reduction package was used to process our obtained data. To confirm the quality of the results, comparisons between different nights and standard stars were done. The observational data were processed in the standard way that included: bias subtracting, flat-fielding by twilight flats, removing cosmic rays, and the sky background subtracting. The next operation was to align the emission-line image and continuum ones. Here, PSF matching was done to match the resolutions of the - image to continuum images. Then the images in the continuum were normalized to images using 10 – 20 stars and subtracted. The measured fluxes of the galaxies were calibrated with spectrophotometric standard stars from Hamuy et al. (1992, 1994) obtained in the same night. The internal errors for the flux measurements were typically about 0.10 dex. The major contribution to the error was from variable atmospheric conditions. The conditions of our observations are given in the column 11 Table 1, colon means that the sky was not photometric. We did not correct fluxes for the emission of the [NII] doublet, which is likely to be small, 0.05 dex, in the case of dwarf galaxies (Lee et al. 2009).
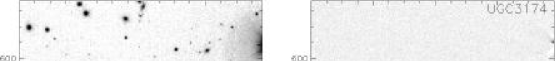
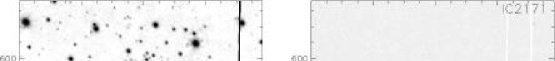
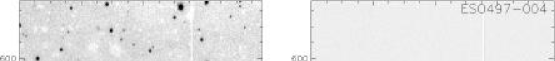
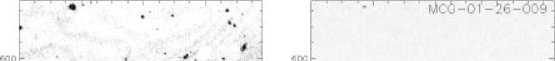
Images of the galaxies we have observed are shown as a mosaic in Fig.1. The left and right images of each galaxy correspond to the plus continuum and in the minus continuum. The angular scale and north and east directions are indicated by the horizontal bars and by the arrows.
The main characteristics of the observed galaxies are listed in Table 1. The table columns contain: (1) — galaxy name; (2) — equatorial coordinates for epoch J2000.0; (3) — morphological type from de Vaucouleurs digital classification; (4) — radial velocity relative to the Local Group centroid (in km s-1); (5) — distance to the galaxy in Mpc with indication of the method used: “rgb” — via the tip of red giant branch, “tf” —- from the Tully-Fisher relation, “mem” — from a membership of galaxy in a group, “h” — via the radial velocity for the Hubble parameter km s-1Mpc-1; (6, 7) — the observed integrated and extinction-corrected flux of the galaxy on a logarithmic scale in units of [erg/cm2/s], here the Galactic extinction was accounted according to Schlegel et al. (1998) and the internal extinction via equation (5) from Karachentsev et al. (2004) assuming the extinction in to be 0.538 of extinction in the –band; (8) — integrated star formation rate in the galaxy calculated from canonical relation [SFR] = 0.945, where the distance to it is expressed in Mpc (Kennicutt, 1998); (9) — absolute - magnitude of the galaxy corrected for extinction; (10) — logarithm of the hydrogen mass of the galaxy taken from HIPASS (Meyer et al. 2004, Koribalski et al. 2004), (11) — observation conditions.
3 Some individual properties of the observed galaxies
Cetus dSph. This dwarf spheroidal galaxy is a peripheric companion to Andromeda (M 31) being on projected distance of 620 kpc from it. Like KKR 25 and Apples I, Cetus is a rare example of isolated dSph system having not any normal galaxy within 0.5 Mpc. Bouchard et al. (2006) found an HI–cloud probably associated with the dwarf. emission from the Cetus dSph is not detected by us. History of star formation in Cetus was studied by Monelli et al. 2010 basing on deep HST/ACS observations.
UGC 1056. A blue compact dwarf (BCD), being a companion to the bright spiral NGC 628. and UV emissions are concentrated in its core. It was imaged in by Kennicutt et al. 2008.
ESO 483-013. An isolated BCD galaxy with emission in the center. It is mistakenly classified by NED as lenticular type. It was imaged in by Kennicutt et al. 2008.
UGC 3174 = DDO 34. A dwarf spiral galaxy with a dozen small HII- regions. It was imaged in by Kennicutt et al. 2008.
ESO 553-046. An isolated BCD galaxy with an extremely high star formation rate per luminosity unit.
UGCA 127 sat. A dwarf irregular galaxy without radial velocity. Probably, it is a companion to the spiral UGCA 127, which distance derived from Tully-Fisher relation was ascribed to the companion itself. On the western side of the galaxy disc there is an unresolved HII region apart from the total diffuse emission.
WHI B0619-07. This dwarf spiral galaxy residing in a zone of strong extinction is an another companion to UGCA 127. A bright star is projected into its central part.
ESO 490-017. A nearby dIr galaxy, whose distance was determined via the tip of red giant branch (Karachentsev et al. 2003). The HI map and velocity field of ESO 490-017 were obtained with GMRT by Begum et al. 2008.
CGMW1-260 and IC 2171. Both the Sdm galaxies have similar radial velocities and distance estimates from TF-relation.
NGC 2283. This is a Scd galaxy with a majority of compact HII- regions. Judging to its radial velocity and TF-distance, NGC 2283 belongs to a scattered group at low galactic latitude, , together with two previous galaxies.
KKSG 9. A BCD galaxy with a high hydrogen mass-to-luminosity ratio. Probably, it has an extended HI- envelope that may be verified by observations in the HI line with aperture synthesis. The distance to KKSG 9 was estimated from its apparent membership in the NGC 2283 group.
ESO 558-011. A galaxy of Magellanic (Sm) type with faint HII-regions.
HIPASS J0801-21. A dwarf irregular galaxy but without signs of emission. Its coordinates in NED are given with an error.
ESO 495-008 and ESO 497-004. Both the galaxies with low radial velocities are situated outside the Local volume, judging to their TF-distance estimates.
HIPASS J0916-23b = ESO 497-035. A companion to the spiral galaxy NGC 2835.
ESO 565–003 and 6dFJ0939351-250735. Isolated dIr galaxies with small emission knots.
6dFJ0956376-092911. A single BCD galaxy undetected in HIPASS.
KKSG 15, MCG-01-26-009, KKSG 17, and UGCA 193. Probable companions to the lenticular galaxy NGC 3115. UGCA 193 was imaged in by Kennicutt et al. 2008.
UGC 6145. This is a dIr companion to the spiral NGC 3521. It shows faint diffuse emission. The HI map and velocity field of ESO 490-017 were obtained with GMRT by Begum et al. 2008.
Leo IV. A dwarf spheroidal companion to the Milky Way recently discovered by Belokurov et al (2007). It does not show any signs of emission. Its structure and star formation history was studied by Sand et al. 2010. A probable companion to Leo V (de Jong et al. 2010.
KKSG 33. A dSph companion to the “Sombrero” (NGC 4594) without signs of emission in HI nor .
IC 3647 = KDG 180 = VCC 1857. A dSph galaxy with unreliably measured radial velocity from Binggeli et al. 1985. It is a probable member of the Virgo cluster without apparent emission in and HI.
NGC 4700. This Sd galaxy has a radial velocity being much more than the expected one under TF-distance of 6.5 Mpc.
2MFGC 15085. One of few galaxies with relatively low radial velocity situated in front of the Local Void center. A faint diffuse companion is seen NW to it.
4 Discussion
Of the 30 galaxies in Table 1, there are 4 objects: UGC 1056, ESO 483-013, UGC 3174, and UGCA 193 for which the fluxes have been measured by others. All four estimates were made by Kennicutt et al. (2008). A comparison of our and their (K08) estimates shows that the average arithmetic difference , and the mean square difference of the logarithm of the fluxes is 0.16. This indicates a satisfactory agreement of the independent measurements (in spite of the imperfect weather conditions), although the external flux error turns out to be about 1.5 times of the internal one.
The objects observed by us are characterized by a large diversity of luminosity, morphological types and other parameters. The median distance to them is 7.5 Mpc, the median absolute blue magnitude is , and the median star formation rate is log[SFR] = –2.0. Two dwarf spheroidal member of the Local group: Cetus and Leo IV do not show any signs of current star formation on the level of /year, while the Sc galaxy NGC 2283 transform its gas into stars with a rate of /year.
The distribution of the observed galaxies versus their absolute magnitude and SFR is presented in Fig 2. (squares). The galaxies with only an upper limit for the flux are not indicated in the figure. For comparison, we also present another 450 galaxies from the Local volume (), shown by circles. The SFR data for them are taken from literature. The line corresponds to a constant SFR per unit luminosity.
Another diagram, is presented in Fig 3, where the global SFR of galaxies is compared with their mass of neutral hydrogen . The galaxies with only an upper limit for the SFR or are not indicated. In this diagram the dashed line corresponds to a fixed SFR per unit and the solid line traces the known Kennicutt- Schmidt relatioship .
As it is seen from the data of columns (8) – (10) of Table, the star formation rate of a galaxy correlates with its luminosity, as well as with the amount of neutral hydrogen. To characterize the evolution status of a galaxy one can use the “Past-Future” diagram {}, where the dimensionless and distance independent parameters and determine the productivity of star formation in the past over the whole cosmic time T = 13.7 Gyrs, and for how long the star formation can continue in future with the present gas resource. Actually, the parameter is equivalent to the widely used ”specific star formation rate” normalized to the cosmic time T, and the parameter corresponds to the time scale to exhaust the HI mass (in units of T), also often used by many authors. The titles of {} quadrants indicate conditionally an evolution state of galaxies in them.
For instance, a galaxy with the constant SFR and the constant mass-to-luminosity ratio locates in the origin of the {}- plane if it is able to reproduce its observed luminosity over the cosmic time T, and also has the HI amount to keep the observed SFR during the next T-term.
Most of bulgeless spiral galaxies and irregular dwarfs on the {} diagram are concentrated around the origin {=0}. Therefore, bulk of the local late type galaxies reside at a middle-way of their star forming evolution.
Nevertheless, the diagnostic diagram in Figure 4 exhibits a significant scatter of galaxies on these parameters. As one can see, the sample of galaxies in Fig.4 is slightly elongated along the diagonal . Such a feature appears when the star formation in dwarf galaxies (they amounts a majority in our sample) is characterized by burst activity changing a rate of star formation over an order of magnitude. In particular, we may consider the BCD galaxy ESO 553-046 to be just in a stage of star formation burst. Under the present value of SFR, the galaxy is able to reproduce its total luminosity during only 1.5 Gyrs, and its gas resource would be sufficient to keep the present star formation rate on the time scale of the cosmic age. Many other examples of nearby dwarf galaxies currently undergoing global starbursts are presented by Lee et al. (2009)
Note that Stinson et al. (2007) simulated evolution of dwarf irregular galaxies taking into account effects of gas outflows due to the wind from SNs, and found cyclic bursts of star formation on the scale of 0.3 Gyr with an amplitude of about (2-3) magnitudes for dwarf systems of very low mass. On the other hand, as it was shown by Lee et al. (2009), the dwarfs that are currently experiencing massive global bursts consist of only 6/their number, and bursts are responsible for about a quarter of the total star formation in the dwarf population.
The ”Replenished Catalog of Nearby Galaxies” (Karachentsev et al. 2012) contains 825 galaxies residing in the Local Volume. Among them, there are about 500 galaxies with measured H-alpha fluxes and about 700 galaxies having estimates of SFR from FUV- magnitudes measured with GALEX (Martin et al. 2005). We shall use this extended Local Volume sample to study star formation properties of nearby galaxies in more details.
Acknowledgements We thank the referee for valuable comments. This work was supported by RUS–IND RFBR grant 10–02–92650, RFBR grant 10–02–00123 and the Ministry of Education and Science of. the Russian Federation under contract 14.740.11.0901
References
- [1] Begum A., Chengalur J.N., Karachentsev I.D., et al. 2008, MNRAS, 386, 1667
- [2] Belokurov V., Zucker D.B., Evans N.W., et al, 2007, ApJ, 654, 897
- [3] Binggeli B., Sandage A., Tammann G.A., 1985, AJ, 90, 1681
- [4] Bouchard A., Carignan C., Staveley-Smith L., 2006, AJ, 131, 2913
- [5] de Jong J.T., Martin N.F., Rix H.W., et al. 2010, ApJ, 710, 1664
- [6] Hamuy M., Suntzeff N.B., Heathcote S.R. et al, 1994, PASP, 106, 566
- [7] Hamuy M., Walker A.R., Suntzeff N.B., et al, 1992, PASP, 104, 533
- [8] Kaisin S.S., Kasparova A.V., Kniazev A.Yu., Karachentsev I.D., 2007, Letters to AZh, 33, 1
- [9] Kaisin S.S., Karachentsev I.D., 2006, Astrofizika, 49, 337
- [10] Kaisin S.S. & Karachentsev I.D., 2008, A&A, 479, 603
- [11] Kaisin S.S., Karachentsev I.D., Kaisina E.I., 2011, Astrofizika, 54, 353
- [12] Karachentsev I.D., Sharina M.E., Dolphin A.E. et al, 2003, A&A, 398, 467
- [13] Karachentsev I.D., Kaisin S.S., Tsvetanov Z., Ford H., 2005, A&A, 434, 935
- [14] Karachentsev I.D., Kaisin S.S., 2007, AJ, 133, 1883
- [15] Karachentsev I.D., Kaisin S.S., 2010, AJ, 140, 1241
- [16] Karachentsev I.D., Karachentseva V.E., Huchtmeier W.K., Makarov D.I., 2004, AJ, 127, 2031
- [17] Karachentsev I.D., Makarov D.I., Kaisina E.I., 2012, Replenished Catalog of Nearby Galaxies, in preparation
- [18] Kennicutt R.C., Lee J.C., Funes J.G. et al., 2008, ApJS, 178, 247
- [19] Kennicutt R.C., 1998, ARA& A, 36, 189
- [20] Koribalski B.S., Staveley-Smith L., Kilborn V.A., et al. 2004, AJ, 128, 16
- [21] Lee J.C., Kennicutt R.C., Funes J.G. et al., 2009, ApJ, 692, 1305
- [22] Martin D.C., et al. 2005, ApJ, 619, L1
- [23] Meyer M.J., Zwaan M.A., Webster R.L., et al. 2004, MNRAS, 350, 1195
- [24] Monelli M., Hidalgo S.L., Stetson P.B., et al. 2010, ApJ, 720, 1225
- [25] Sand D.J., Seth A., Olszewski E.W., et al. 2010, ApJ, 718, 530
- [26] Schlegel D.J., Finkbeiner D.P. & Davis M., 1998, ApJ, 500, 525
| Name | RA Dec. | obs. | |||||||||
|---|---|---|---|---|---|---|---|---|---|---|---|
| (2000.0) | Mpc | obs | corr | corr | cond. | ||||||
| (1) | (2) | (3) | (4) | (5) | (6) | (7) | (8) | (9) | (10) | (11) | |
| Cetus | 002611.0110240 | 1 | 26 | 0.78 | rgb | 14.30 | 14.28 | 5.53 | 10.18 | 5.87 | |
| UGC 1056 | 012847.2164117 | 9 | 774 | 7.3 | mem | 12.73 | 12.67 | 1.97 | 14.82 | 7.64 | |
| ESO 483-013 | 041241.1230932 | 9 | 782 | 7.4 | tf | 12.59 | 12.54 | 1.83 | 15.51 | 7.62 | |
| UGC 3174 | 044834.5001430 | 8 | 609 | 8.3 | h | 12.79 | 12.70 | 1.89 | 15.60 | 8.38 | |
| ESO 553-046 | 052705.7204041 | 9 | 370 | 5.1 | h | 11.96 | 11.92 | 1.53 | 14.13 | 7.22 | |
| UA 127sat | 062054.8083901 | 10 | — | 7.5 | mem | 13.64 | 12.88 | 2.26 | 16.00 | — | : |
| WHI B0619 | 062213.8075016 | 8 | 586 | 8.4 | tf | 12.87 | 12.28 | 1.46 | 17.73 | 8.94 | |
| ESO 490-017 | 063756.6255959 | 10 | 268 | 4.23 | rgb | 12.36 | 12.29 | 2.07 | 14.46 | 7.55 | |
| CGMW1-260 | 063800.1150122 | 8 | 542 | 9.9 | tf | 12.67 | 12.30 | 1.34 | 18.02 | 8.63 | : |
| IC 2171 | 064427.3175557 | 8 | 565 | 9.9 | tf | 12.53 | 12.09 | 1.13 | 16.87 | 8.38 | |
| NGC 2283 | 064552.7181237 | 6 | 622 | 10.0 | tf | 11.49 | 11.11 | 0.14 | 18.82 | 9.43 | |
| KKSG 9 | 064656.9175629 | 9 | 477 | 10.0 | mem | 13.29 | 12.85 | 1.89 | 15.62 | 8.63 | |
| ESO 558-011 | 070656.8220226 | 8 | 496 | 6.7 | tf | 12.83 | 12.47 | 1.85 | 16.39 | 7.87 | |
| HIPASS 0801-21 | 080125.4215951 | 10 | 463 | 6.4 | h | 14.38 | 14.17 | 3.59 | 12.79 | 7.54 | |
| ESO 495-008 | 082100.7234653 | 10 | 512 | 17.3 | tf | 13.32 | 13.21 | 1.79 | 15.62 | 8.26 | : |
| ESO 497-004 | 090303.1234830 | 8 | 519 | 14.5 | tf | 13.76 | 13.54 | 2.25 | 15.46 | 8.46 | |
| HIPASS 0916-23b | 091658.0231647 | 10 | 542 | 9.3 | mem | 13.76 | 13.66 | 2.75 | 14.47 | 7.42 | |
| ESO 565-003 | 092309.9201003 | 10 | 549 | 7.6 | h | 13.21 | 13.15 | 2.42 | 14.14 | 7.33 | |
| 6dF J0939351 | 093935.0250735 | 10 | 440 | 6.0 | h | 13.07 | 13.02 | 2.49 | 13.64 | 6.97 | |
| 6dF J0956376 | 095637.6092911 | 9 | 355 | 4.9 | h | 13.79 | 13.73 | 3.38 | 12.84 | 6.75 | |
| KKSG 15 | 095510.5061612 | 10 | 554 | 9.7 | mem | 13.79 | 13.75 | 2.81 | 14.97 | 7.77 | |
| MCG-01-26-009 | 100133.6063130 | 10 | 510 | 9.7 | mem | 13.30 | 13.27 | 2.33 | 13.98 | 7.71 | |
| KKSG 17 | 100138.4081456 | 10 | 203 | 9.7 | mem | 14.12 | 14.07 | 3.13 | 14.78 | 7.72 | |
| UGCA 193 | 100236.2060043 | 7 | 425 | 9.7 | mem | 12.94 | 12.82 | 1.88 | 15.83 | 8.54 | |
| UGC 6145 | 110535.0015149 | 10 | 533 | 10.7 | mem | 14.16 | 14.11 | 3.08 | 13.94 | 7.97 | |
| Leo IV | 113257.0003200 | 3 | 59 | 0.16 | rgb | 14.57 | 14.55 | 7.17 | 4.63 | 4.23: | |
| KKSG 33 | 124008.9122153 | 3 | — | 9.3 | mem | 14.40 | 14.36 | 3.45 | 11.54 | 6.99 | |
| IC 3647 | 124053.1102834 | 1 | 528: | 7.2 | h | 14.31 | 14.29 | 3.61 | 14.90 | 6.44 | |
| NGC 4700 | 124907.6112441 | 7 | 1196 | 6.5 | tf | 12.54 | 12.44 | 1.84 | 16.92 | 8.32 | |
| 2MFGC 15085 | 194311.7065621 | 8 | 1654 | 16.7 | tf | 12.94 | 12.60 | 1.18 | 17.19 | 9.14 | |