Starbursts and black hole masses in X-shaped radio galaxies:
Signatures of a merger event?
We present new spectroscopic identifications of 12 X-shaped radio galaxies and use the spectral data to derive starburst histories and masses of the nuclear supermassive black holes in these galaxies. The observations were done with the 2.1-m telescope of the Observatorio Astronómico Nacional at San Pedro Mártir, México. The new spectroscopic results extend the sample of X-shaped radio galaxies studied with optical spectroscopy. We show that the combined sample of the X-shaped radio galaxies has statistically higher black-hole masses and older episodes of star formation than a control sample of canonical double-lobed radio sources with similar redshifts and luminosities. The data reveal enhanced star-formation activity in the X-shaped sample on the timescales expected in galactic mergers. We discuss the results obtained in the framework of the merger scenario.
Key Words.:
Galaxies: kinematics and dynamics – Galaxies: formation – Galaxies: nuclei – Black hole physics1 Introduction
A significant fraction of the most powerful FRII (Fanaroff Riley type II; Fanaroff & Riley 1974) radio galaxies exhibit two pairs of misaligned radio lobes associated with the same parent galaxy (Leahy & Williams 1984), giving these galaxies a peculiar X-shaped appearance, which is remarkably different from the “canonical” double-lobed morphology of radio galaxies. Hence, these objects are often branded ‘winged’ or ‘X-shaped’ radio galaxies (Leahy & Williams 1984; Leahy & Parma 1992). A recent merger of two supermassive black holes (SMBHs), where the wings constitute the relic emission of the past radio jets, is one of several scenarios proposed to explain this peculiar radio morphology (e.g., Rottmann 2001; Merritt & Ekers 2002; Komossa 2006; Gergely & Biermann 2009; Hodges-Kluck et al. 2010b; Mezcua et al. 2011). Alternative models employ jet-axis reorientation (e.g., Dennett-Thorpe et al. 2002), two unresolved active galactic nuclei (AGN; Lal & Rao 2007), backflow of material from the main lobes into the wings (e.g., Leahy & Williams 1984; Capetti et al. 2002; Hodges-Kluck et al. 2010a; Landt et al. 2010; Hodges-Kluck & Reynolds 2011), or non-ballistic precession assuming a pre-merger state of the two black holes (Gong 2008; Gong et al. 2011). The existence of very few X-shaped sources with FRI edge-darkened radio lobes (Saripalli et al. 2008; Saripalli & Subrahmanyan 2009) was initially used as a strong argument against the backflow scenario. However, the presence in most of the FRI X-shaped galaxies of double-double morphologies indicative of a renewal of jet activity, together with an alignment between the main radio axis and the major axis of the host galaxy, led to the proposal of a common formation mechanism for FRI and FRII X-shaped galaxies via backflows (Saripalli & Subrahmanyan 2009). The required duration of these backflows is, however, too close to the typical radio-source lifetime of 108 yr (e.g., Rottmann 2001; Lal & Rao 2007), which again argues against the backflow scenario.
Each of the models mentioned above thus has difficulties in explaining the entire range of the observed properties of the X-shaped radio galaxies (see Gopal-Krishna et al. 2010 for a review). If the observed X-shaped morphology results from a coalescence of a pair of SMBHs, the imprints of the preceding galactic merger should be observed in the X-shaped radio sources in the form of early-type host galaxies (Toomre 1977), statistically higher black hole (BH) masses, and enhanced star-formation and nuclear activity (e.g., Kauffmann & Haehnelt 2000; Hopkins et al. 2008). It would therefore be relevant to investigate whether BH masses and star-formation activities differ between X-shaped radio galaxies and canonical double-lobed radio sources. We initiated such a study by analyzing the optical spectra of 29 X-shaped sources and 36 radio-loud control sources (cf., Mezcua et al. 2011) . The results revealed that all the X-shaped sources analyzed are hosted by early-type galaxies, and that the X-shaped sample has a statistically higher mean BH mass and older bursts of star formation than the control sample of canonical radio galaxies (Mezcua et al. 2011; hereafter M11). A total of 52 X-shaped radio galaxies have been spectroscopically identified so far in several studies (Cheung et al. 2009; Landt et al. 2010), but not all of these observations are suitable for detailed spectral analysis. To increase the statistical significance of our studies, we identified a sample of 13 X-shaped radio sources with bright optical nuclei suitable for optical spectroscopy observations. We present here the results of the spectroscopic observations and discuss them in the context of physical models proposed to explain the nature of the X-shaped radio galaxies.
The objects selected and the optical observations of the sample are described in Sect. 2. Procedures applied for the analysis of the measurements are explained in Sect. 3. The results and discussion are presented in Sects. 4 and 5, respectively. Throughout the paper, we assume a CDM cosmology with parameters , , and .
2 Observations and data reduction
The observed sample comprises 13 X-shaped radio galaxies retrieved from a list of 100 candidates (Cheung 2007). We selected all the objects with bright (mR 19), optical counterparts for which neither spectroscopic redshifts had been reported nor spectra were available in the Sloan Digital Sky Survey (SDSS), and which were observable during the period of the observations (i.e., across a range of right ascension between 07:00:00 and 17:00:00).
Optical spectroscopy observations of the sample were carried out on 20-23 March 2009 with the 2.1-meter telescope of the Observatorio Astronómico Nacional at San Pedro Mártir (OAN-SMP), Baja California, México. The Boller Chivens spectrograph was tuned to the 4000 to 8000 range (grating 300 l/mm), with a spectral dispersion of 4.0 0.3 /pix, corresponding to 8.0 1.2 full width at half maximum (FWHM), derived from the FWHM of different emission lines of the arc-lamp spectrum. The instrumental resolution estimated for each object from the FWHM of the night-sky line at 5575 is in the range 9-14 . A 25 slit oriented along right ascension was used. To calibrate the spectral measurements, the spectrophotometric standard star Feige 34 was observed two times during every night of the observing run. The airmass of the observations ranged between 1.0 and 1.3.
For each target source, two or three exposures were taken, with a typical exposure duration of 1800 s (see Table 1). The data reduction was carried out with the IRAF111IRAF is distributed by the National Optical Astronomy Observatories operated by the Association of Universities for Research in Astronomy, Inc. under cooperative agreement with the National Science Foundation. software following standard procedures. The spectra were bias-subtracted and corrected with dome flat-field frames. Cosmic rays were removed interactively from all images. Arc-lamp (CuHeNeAr) exposures were used for the wavelength calibration. A spline function was fitted to determine the dispersion function (wavelength-to-pixel correspondence). Sky emission lines located at known wavelengths were removed during the calibration in wavelength. The absolute flux-calibration accuracy of the spectra, provided by the standard star calibration, is about 15%. The relative flux-calibration uncertainty, estimated as the difference between the normalized true and estimated flux-calibration curves of the standard star, is for all nights.
| Name | mR | Obs. date | Exp. time |
|---|---|---|---|
| (1) | (2) | (3) | (4) |
| J0813+4347 | 16.1 | 2009 Mar 20 | 2 1800 |
| 2009 Mar 22 | 2 1800 | ||
| J0838+3253 | 16.9 | 2009 Mar 21 | 2 1800 |
| 2009 Mar 23 | 2 1800 | ||
| J0924+4233 | 17.8 | 2009 Mar 23 | 2 1800 |
| J1008+0030 | 15.8 | 2009 Mar 20 | 2 1800 |
| 2009 Mar 22 | 2 1800 | ||
| J1055-0707 | 17.6 | 2009 Mar 20 | 3 1800 |
| J1200+6105 | 18.3 | 2009 Mar 23 | 2 1800 |
| J1201-0703 | 16.4 | 2009 Mar 22 | 2 1800 |
| 2009 Mar 23 | 2 1800 | ||
| J1258+3227a | 17.0 | 2009 Mar 20 | 2 1800 |
| J1351+5559 | 15.1 | 2009 Mar 22 | 2 1800 |
| 2009 Mar 23 | 1 1800 | ||
| J1408+0225 | 18.4 | 2009 Mar 22 | 3 1800 |
| J1459+2903 | 16.5 | 2009 Mar 21 | 2 1800 |
| J1537+2648 | 18.3 | 2009 Mar 22 | 2 1800 |
| 2009 Mar 23 | 2 1800 | ||
| J1606+0000 | 15.0 | 2009 Mar 21 | 2 1800 |
Column designation: (1) – object name based on J2000.0 coordinates; (2) – apparent magnitude R, taken from Cheung (2007); (3) observation date; (4) exposure time, in seconds. Notes: – Optical misidentification in Cheung et al. (2009). The spectrum of this object corresponds to a K-type star and not a X-shaped radio galaxy.
3 Analysis of the spectra
The optical spectra were used to identify the most prominent emission/absorption lines, determine the galaxy redshifts, obtain mass estimates for the nuclear SMBH, and reconstruct histories of star-formation activity in the host galaxies.
Since most of the observed spectra of the target objects do not show strong emission lines, we determined the redshift from the Ca II H 3968 and K 3934, G band 4302, Mg Ib 5175, and Na Id 5896 absorption lines.
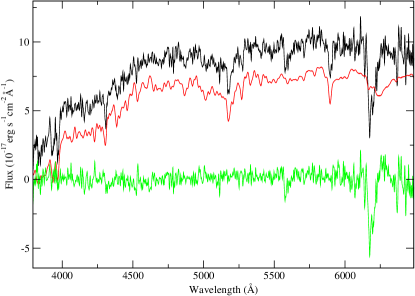
We used the stellar population synthesis code STARLIGHT (Asari et al. 2007; Cid Fernandes et al. 2004, 2005, 2007; Mateus et al. 2006) to model the observed spectra. The best fit was obtained by constructing a linear combination of simple stellar populations (SSPs) from the stellar library of Bruzual & Charlot (2003) and adding a power-law component representing the AGN continuum emission (see Fig. 1; e.g., León-Tavares et al. 2011).
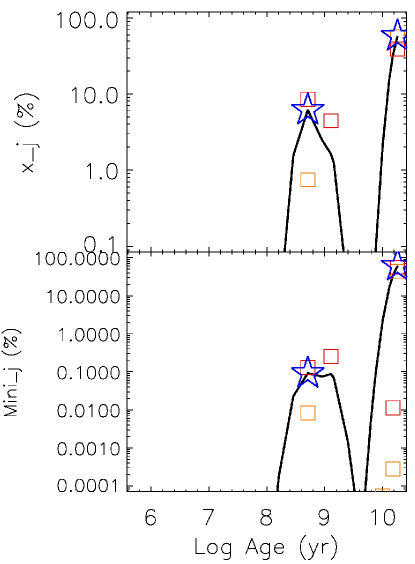
The STARLIGHT model for the observed spectra yields an estimate of stellar velocity dispersion , which we corrected by taking into account the spectral resolution of each object, and from which we derived the BH mass using the empirical relation (Gebhardt et al. 2000; Tremaine et al. 2002), and the light fraction, mass fraction, age, and metallicity of the stellar populations used in the fit. We used these parameters to derive starburst histories and apply Gaussian smoothing to the individual starburst events in order to determine the epoch of the most recent starburst episode (see Fig. 2). A quality factor was derived from the of the modeled spectra in order to quantify the reliability of the fit. Fits with can be considered reliable (see M11 for details).
We estimated the rest-frame continuum flux at 5100 Å from the SDSS photometry (Wu & Liu 2004). To assess the spectral classification of the X-shaped radio galaxies, we measured the Ca II break (C) of their absorption optical spectrum (Landt et al. 2002) as done in M11.
Finally, we determined the dynamic age () of the high-surface-brightness (active) radio lobes using , where is the angular size in the FIRST image, converted to linear size assuming that the sources are in the plane of the sky, and is the lobe advance speed. We adopted , as obtained from observations of the aging of the synchrotron radiation spectrum in radio galaxies (e.g., Scheuer 1995; Tingay et al. 1998).
Assuming that the fueling of the low-surface-brightness lobes of the X-shaped sources had stopped after the high-surface ones were activated, the dynamic age of the passive lobes during their active stage can be estimated as
| (1) |
where is the angular size of the low-surface brightness lobes, converted to linear size assuming that the sources are in the plane of the sky, and is their expansion speed during the inactive stage. We use in our calculation.
4 Results
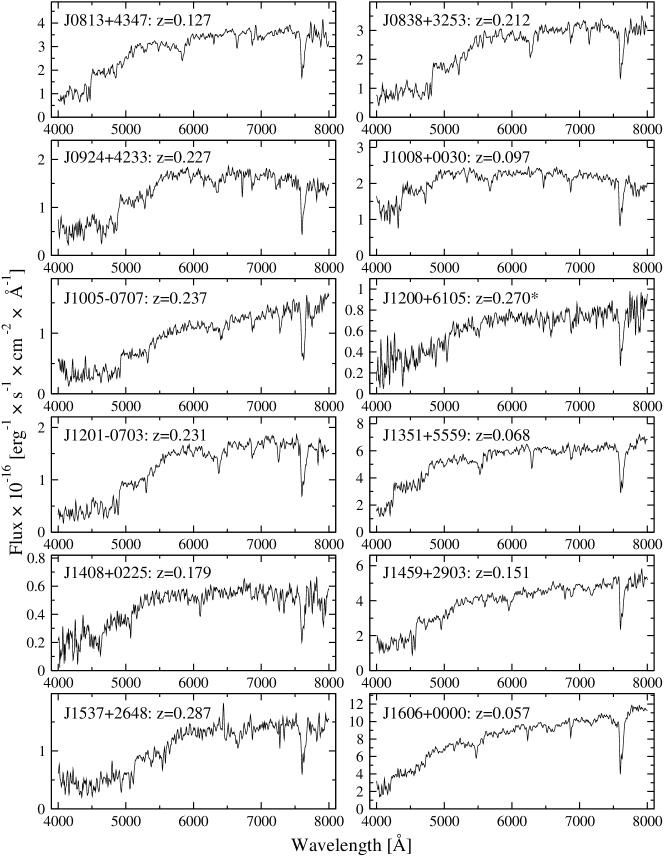
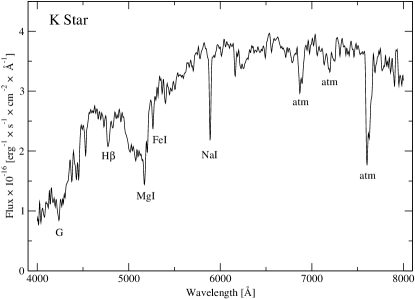
The new data provide the first spectroscopic identifications and redshifts for 8 X-shaped radio galaxies (J1008+0030, J1055-0707, J1200+6105, J1201-0703, J1351+5559, J1408+0225, J1459+2903, and J1537+2648). New spectra were obtained for another 4 X-shaped sources (J0813+4347, J0838+3253, and J0924+4233, spectroscopically identified in the SDSS, Adelman-McCarthy et al. 2007, and for J1606+0000, identified by Best et al. 1999). The difference between our redshifts and the ones obtained previously are . The spectrum of these 12 sources is shown in Fig. 3. With the new identifications, the total number of X-shaped radio galaxies spectroscopically identified is increased to 60. The last object of our sample, J1258+3227, shows the typical stellar lines of a K-type star (G band, H, Mg I, Fe I, and Na I absorption lines; Fig. 4), indicating that there has been a likely misidentification (as also suggested by Cheung et al. 2009). This object is excluded from further analysis. Combined results from the fits to the optical spectra, the BH mass calculations, the epochs of the most recent starburst, and the age estimates for the radio lobes are presented in Table 2. The columns listed are: object name based on J2000.0 coordinates (Col. 1), other common catalog names (Col. 2), stellar velocity dispersion (Col. 3), BH mass derived from (Col. 4), optical luminosity of the AGN (Col. 5) and of the host galaxy (Col. 6), radio luminosity (Col. 7), dynamic age of the radio lobes (Col. 8), most recent starburst age (Col. 9), the value of Ca II break factor (Col. 10), spectroscopic redshift (Col. 11), and quality factor of the STARLIGHT fit (Col. 12). The total (active passive lobe) age of the radio emission is given in brackets in Col. 8. The objects J0813+4347, J0838+3253, and J0924+4233 were previously analyzed in M11. We report here their new values of stellar velocity dispersion, BH mass, most recent starburst age, Ca II break factor, spectroscopic redshift, and quality factor () of the STARLIGHT fit derived from the new spectra. The new fits have higher values of than in previous analysis and are used for the combined statistical study.
The addition of the new spectroscopical identifications to the X-shaped sample of M11 provides an extended X-shaped sample of 38 sources. This extended sample is considered from now on for the statistical comparison against a control sample consisting of 36 radio-loud sources with redshift z0.3, and covering the same range of optical and radio luminosities as the X-shaped sample. A control subsample of elliptical radio-loud sources with values of and that qualify as early-type galaxies according to color-color diagnostics (i.e., location above the u-r galaxy type separator in a color-color diagram; Strateva et al. 2001) is also considered for the statistical comparison (selection of both samples is described in detail in M11). The morphological classification based on visual inspection of SDSS images of this subsample of elliptical control sources agrees with the one based on the Ca II break and color-color diagram.
4.1 Luminosity matching
To provide a closer statistical matching between the target and control samples, we used tight radio and optical luminosity matching between the two samples.
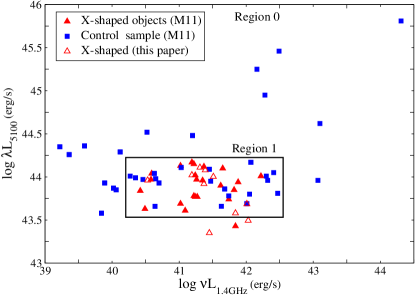
We derived the optical luminosities of all of the 12 X-shaped radio galaxies except for two (J1055-0707 and J1201-0703), whose rest-frame continuum flux at 5100 Å cannot be estimated owing to their lack of SDSS photometry. These sources are excluded from the statistical study. Figure 5 compares the radio and optical luminosities in the combined target and control samples (with the new X-shaped objects marked). All new sources fall in the common range of luminosities and , defined in M11 as Region 0, and eight of them fall within a tighter range of luminosities called Region 1 (with and ; see M11 for further details of the region definition).
The Kolmogorov-Smirnov (KS) test applied to the optical and radio luminosities of the extended X-shaped sample and the control sample in Region 0 gives a probability that the two samples are drawn from the same parent distribution. In Region 1, the KS-test indicates that the probability that the two samples are the same is 87 for the optical luminosity and 19 for the radio luminosity. Therefore, the KS tests suggest that the X-shaped and control sample sources are indistinguishable in terms of optical and radio luminosities within Region 1.
4.2 Host type
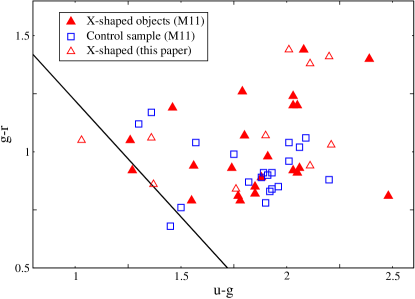
The new spectra present typical features of early-type galaxies, showing strong metal absorption lines but no optical emission lines, and with values of the Ca II break of CCaII 0.3 in all the sources, and CCaII 0.4 in 10 of them (see Table 2, Col. 10). These values ensure that the galaxy is dominated by the thermal spectrum of the host rather than the non-thermal spectrum of an active nucleus or a relativistic jet. The host galaxy type can be inferred using a color-color diagram, obtained from the SDSS , , and -band photometry. We apply a color-color distinction (Strateva et al. 2001) to identify the type of the host galaxy in the 10 new X-shaped sources considered for the statistical analysis. The combined plot presented in Fig. 6 shows that the new sources also qualify as early-type galaxies.
4.3 Black hole masses
From the individual estimates of the BH mass, we calculated the mean BH mass in the extended X-shaped sample, , and derived its ratio to the mean BH mass in the control samples . The resulting ratio is for the X-shaped/control samples and for the X-shaped/control (ellipticals) samples. These values increase to and , respectively, in the tighter Region 1. The ratios obtained are similar to the ones obtained for the previously published sample of M11, for which were found in both Regions 0 and 1. The median ratios are for the X-shaped/control samples and for the X-shaped/control (ellipticals) samples in Region 0, and and , respectively, in the tighter Region 1. While the difference between the mean and the median values of the mass ratios is significant, it should be noted that application of the median is best justified for samples featuring a small number of strong outliers, which is not the case for any of our samples. Furthermore, the KS-test applied to the BH mass distribution of the X-shaped and control sample gives probabilities of 85 and 96 that the two samples differ significantly in Regions 0 and 1, respectively, confirming the difference between BH masses in the two samples expressed by the mean values of the mass.
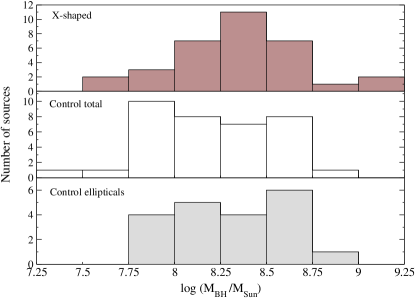
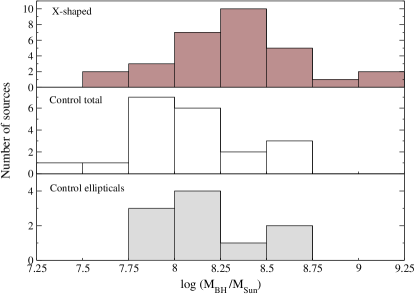
The differences between the BH masses of the two samples are further illustrated by the distribution of BH masses in Figs. 7- 8. The histograms of the mass distributions for the X-shaped and control samples in Regions 0 and 1 underline the trend of the X-shaped objects having statistically higher BH masses than the control sample. About 85 of the X-shaped sources in Region 0 and 83 in Region 1 have M M⊙. The percentages for the control sample objects are 67 and 55 in Regions 0 and 1, respectively. These results lend further support to the merger scenario in which a BH coalescence could explain the higher BH masses obtained in the X-shaped sample and be the possible origin of the X-shaped morphology.
4.4 Starbursts
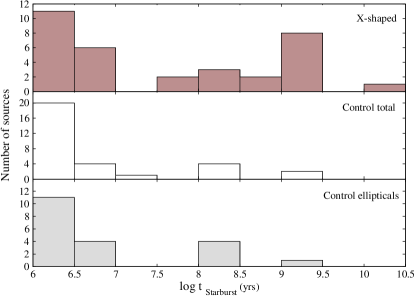
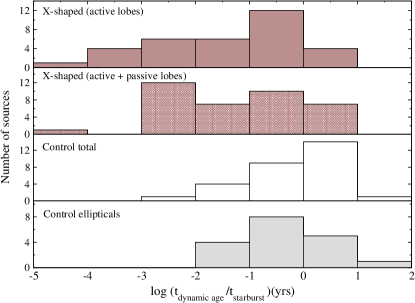
Distributions of the ages of the most recent starburst are compared in Fig. 9 for the extended X-shaped sample and the control samples. Both samples present a peak of starburst activity in the range of - years. The X-shaped sample notably exhibits a more prominent spread in the starburst ages, with 50% of the sources having a starburst activity older than years. The addition of the new galaxies to the X-shaped sample of M11 not only confirms this trend but also reveals a secondary peak between - years in the distribution of starburst ages of the extended X-shaped sample (see Fig. 9). The most recent peak of star formation, which is present in all three samples, could be related to the current jet activity (e.g., Rees 1989; Labiano et al. 2008; Silk & Norman 2009). The secondary peak, which is only present in the extended X-shaped sample, cannot be linked to the active lobes as their oldest dynamic age is years (see Table 2, col. 8). This strong starburst activity can only possibly be related to an event that occurred before the active lobes were formed. A delay between a merger-driven starburst and AGN activity is shown in recent studies (e.g., Schawinski et al. 2010; Blecha et al. 2011). This scenario can be tested by comparing the starburst ages to the dynamic ages of the radio lobes for both the X-shaped and control samples. Histograms of the logarithmic ratio of the dynamic age to the most recent starburst age are shown in Fig. 10. The X-shaped sources tend to have older starburst ages than the dynamic ages of the radio lobes, while these two ages are comparable in the control sample. This trend in the X-shaped sample is observed for both the active lobes alone and the active plus passive lobes (see Fig. 10). The mean logarithmic ratio of the extended X-shaped sample is , while that of the control sample is . According to the KS-test, the starburst ages of the X-shaped sample and the control sample differ with a probability of in both Regions 0 and 1. Considering the subsample of only control ellipticals, the KS-test gives a somewhat lower probability of of the X-shaped objects being different from the control sample.
Since the dynamic ages have been derived from the linear sizes of the radio lobes, we check for differences in the linear size distributions of the X-shaped and control samples. The KS-test finds that the linear size distributions differ with a probability of 87%. This difference is confirmed by the mean values of the distributions, which are (0.22 0.02) Mpc for the X-shaped sample and (0.5 0.2) Mpc for the control sample. The median values are 0.18 Mpc and 0.3 Mpc, respectively. We also study a possible dependence of the linear size with the BH mass and starburst age, but no dependences are found for any of the two samples.
5 Discussion
The origin of the X-shaped morphology in X-shaped radio galaxies is a matter of ongoing debate. Some recent studies in the X-rays (Hodges-Kluck et al. 2010b) and optical (Mezcua et al. 2011) bands and some theoretical models (Gong et al. 2011) favor a recent merger of two supermassive black holes as the most plausible scenario. Other studies (Hodges-Kluck et al. 2010a; Landt et al. 2010) propose a backflow from the active lobes into the wings to explain the peculiar morphology of X-shaped radio galaxies.
In this paper, we have presented the largest statistical study to date of the BH mass and starburst activity in X-shaped radio sources. The properties of a sample of 38 X-shaped radio galaxies have been compared to those of a control sample of 36 radio-loud active nuclei, by applying stringent luminosity and color criteria to provide the closest match between the two samples. The results suggest that a galactic merger is a more likely explanation of the origin of X-shaped sources. The merger hypothesis is further supported by the finding that all of the X-shaped objects studied are hosted by early-type galaxies, which are expected to have undergone at least one major merger event over the course of their evolution (Toomre 1977).
Histograms of the BH mass distribution for the X-shaped and control samples show that X-shaped radio galaxies tend to have higher MBH than the control sample. The ratio of the mean MBH for the two samples confirms the trend observed, with the X-shaped sample having a mean BH mass that is times higher than the one of the control sample in a tight common range of radio and optical luminosities. The higher average BH mass in the galaxies hosting the X-shaped radio sources may result from a major merger event and the consequent coalescence of the two central black holes, which could be the origin of the winged morphology observed in the radio maps.
The occurrence of a merger event in the X-shaped radio galaxies should be reflected in their starburst histories. The age of the most recent burst of star formation and the dynamic age of the radio lobes was thus studied for both the X-shaped and the control samples. The most recent episodes of starburst activity were found to be statistically older in the X-shaped sample than those found for the control sample, with 50 of the X-shaped sources having starburst ages older than 108 years. In the X-shaped sources, the most recent starburst occurred before the active lobes were formed. Of particular interest is the peak observed in the distribution of the most recent starburst ages of the X-shaped sample at ages of 109–109.5 years (1-3 Gyr). This peak suggests that there has been enhanced star formation due to a merger event, which implies a time delay of 1-3 Gyr between the peak of starburst activity and the end of the merger. This timescale agrees with the time delay of 2 Gyr found by hydrodynamical simulations of galaxy mergers (Lotz et al. 2008), and with the timescales of 0.5-2 Gyr found observationally for individual objects (e.g., Tadhunter et al. 2005; Emonts et al. 2006). On the other hand, the jet dynamic age of 106 yrs derived for the X-shaped sources also agrees with the time delay between the merger event and the onset of the radio-AGN triggered activity found by other studies to be 106 years (e.g., Emonts et al. 2006). These results assume a jet advance speed of 0.1c. Estimates of the lobe advance speed based on synchrotron aging studies can reach 0.2c for the most powerful radio galaxies, while the study of three samples of very powerful radio sources yielded estimates below 0.1c (with a poor statistical significance; i.e., Scheuer 1995). The use of an advance speed as low as 0.01c in our calculations would increase the dynamic age of the active lobes by an order of magnitude. However, this would not affect the results derived from the ratio of dynamic to starburst ages, which would still indicate that the most recent starburst activity occurred before the active lobe formation. This result is also essentially unchanged when an advance speed of 0.2c is used.
All the results obtained in our study strengthen the hypothesis that X-shaped radio galaxies were formed by mergers. More detailed studies of star formation and gas kinematics in these objects will yield stronger constraints of this scenario.
Acknowledgments
The authors are grateful to the suggestions of the anonymous referee, which helped to improve the manuscript. The authors thank M. Karouzos for insightful comments and discussions. M. Mezcua was supported for this research through a stipend from the International Max Planck Research School (IMPRS) for Astronomy and Astrophysics at the Universities of Bonn and Cologne. This work was supported by the CONACYT research grant 54480 and 151494 (México). The STARLIGHT project is supported by the Brazilian agencies CNPq, CAPES, and FAPESP and by the France-Brazil CAPES/Cofecub program.
| Name | |||||||||||
| J2000 | Other | [km/s] | [] | [erg/s] | [erg/s] | [erg/s] | [yr] | [yr] | |||
| (1) | (2) | (3) | (4) | (5) | (6) | (7) | (8) | (9) | (10) | (11) | (12) |
| J08134347 | 274 83 | 8.7 0.5 | -a | 44.11 | 41.31 | 6.29 (6.49) | 9.11 | 0.45c | 0.127 | 259 | |
| J08383253 | 237 79 | 8.4 0.6 | -a | 43.92 | 41.37 | 6.59 (6.76) | 8.71 | 0.50 | 0.212 | 88 | |
| J09244233 | 266 102 | 8.6 0.7 | -a | 43.58 | 41.84 | 6.54 (6.77) | 9.11 | 0.42c | 0.227 | 117 | |
| J10080030 | 340 41 | 9.1 0.2 | 41.73 1.37 | 44.02 | 41.19 | 5.61 (5.93) | 6.00 | 0.32 | 0.097 | 709 | |
| J10550707 | 261 46 | 8.6 0.3 | -a | -b | 42.24 | 6.14 (6.30) | 7.40 | 0.47 | 0.237 | 72 | |
| J12006105 | 165 74 | 7.8 0.8 | 43.27 0.20 | 43.69 | 42.01 | 6.08 (6.31) | 6.70 | 0.29 | 0.270 | 115 | |
| J12010703 | 303 43 | 8.9 0.2 | -a | -b | 41.71 | 5.94 (6.25) | 8.71 | 0.50 | 0.231 | 149 | |
| J13515559 | 228 78 | 8.4 0.6 | -a | 43.96 | 40.53 | 5.42 (5.71) | 7.00 | 0.49 | 0.068 | 116 | |
| J14080225 | 266 53 | 8.6 0.3 | 41.53 1.24 | 43.35 | 41.45 | 5.67 (6.01) | 10.26 | 0.39 | 0.179 | 313 | |
| J14592903 | 153 77 | 7.7 0.9 | 41.97 4.57 | 44.00 | 41.51 | 5.98 (6.12) | 6.94 | 0.38 | 0.151 | 142 | |
| J15372648 | 219 42 | 8.3 0.3 | -a | 43.49 | 42.03 | 6.05 (6.33) | 9.11 | 0.40 | 0.287 | 33 | |
| J16060000 | 4C00.58 | 227 37 | 8.3 0.3 | 42.84 0.27 | 44.08 | 41.39 | 5.50 (5.71) | 6.00 | 0.41c | 0.057 | 51 |
Column designation: (1) – object name based on J2000.0 coordinates; (2) – other common catalog names; (3) – stellar velocity dispersion obtained from STARLIGHT; (4) – black hole mass obtained from ; (5) – 5100 Å continuum luminosity from STARLIGHT; (6) – 5100 Å continuum luminosity from SDSS photometry; (7) – 1.4 GHz radio luminosity; (8) – dynamic age of the active (active+passive) lobes; (9) – age of the most recent starburst; (10) – value of Ca II break factor; (11) – spectroscopic redshift; (12) – quality factor. Notes: – STARLIGHT could not fit the continuum luminosity; – no SDSS photometry available; – values of Ca II break from Landt et al. (2010).
References
- Adelman-McCarthy et al. (2007) Adelman-McCarthy, J. K., Agüeros, M. A., Allam, S. S., et al. 2007, ApJS, 172, 634
- Asari et al. (2007) Asari, N. V., Cid Fernandes, R., Stasińska, G., et al. 2007, MNRAS, 381, 263
- Best et al. (1999) Best, P. N., Röttgering, H. J. A., & Lehnert, M. D. 1999, MNRAS, 310, 223
- Blecha et al. (2011) Blecha, L., Cox, T. J., Loeb, A., & Hernquist, L. 2011, MNRAS, 412, 2154
- Bruzual & Charlot (2003) Bruzual, G. & Charlot, S. 2003, MNRAS, 344, 1000
- Capetti et al. (2002) Capetti, A., Zamfir, S., Rossi, P., et al. 2002, A&A, 394, 39
- Cheung (2007) Cheung, C. C. 2007, AJ, 133, 2097
- Cheung et al. (2009) Cheung, C. C., Healey, S. E., Landt, H., Verdoes Kleijn, G., & Jordán, A. 2009, ApJS, 181, 548
- Cid Fernandes et al. (2007) Cid Fernandes, R., Asari, N. V., Sodré, L., et al. 2007, MNRAS, 375, L16
- Cid Fernandes et al. (2004) Cid Fernandes, R., Gu, Q., Melnick, J., et al. 2004, MNRAS, 355, 273
- Cid Fernandes et al. (2005) Cid Fernandes, R., Mateus, A., Sodré, L., Stasińska, G., & Gomes, J. M. 2005, MNRAS, 358, 363
- Dennett-Thorpe et al. (2002) Dennett-Thorpe, J., Scheuer, P. A. G., Laing, R. A., et al. 2002, MNRAS, 330, 609
- Emonts et al. (2006) Emonts, B. H. C., Morganti, R., Tadhunter, C. N., et al. 2006, A&A, 454, 125
- Fanaroff & Riley (1974) Fanaroff, B. L. & Riley, J. M. 1974, MNRAS, 167, 31P
- Gebhardt et al. (2000) Gebhardt, K., Bender, R., Bower, G., et al. 2000, ApJ, 539, L13
- Gergely & Biermann (2009) Gergely, L. Á. & Biermann, P. L. 2009, ApJ, 697, 1621
- Gong (2008) Gong, B. 2008, MNRAS, 389, 315
- Gong et al. (2011) Gong, B. P., Li, Y. P., & Zhang, H. C. 2011, ApJ, 734, L32+
- Gopal-Krishna et al. (2010) Gopal-Krishna, Biermann, P. L., Gergely, L. Á., & Wiita, P. J. 2010, ArXiv e-prints
- Hodges-Kluck & Reynolds (2011) Hodges-Kluck, E. J. & Reynolds, C. S. 2011, ApJ, 733, 58
- Hodges-Kluck et al. (2010a) Hodges-Kluck, E. J., Reynolds, C. S., Cheung, C. C., & Miller, M. C. 2010a, ApJ, 710, 1205
- Hodges-Kluck et al. (2010b) Hodges-Kluck, E. J., Reynolds, C. S., Miller, M. C., & Cheung, C. C. 2010b, ApJ, 717, L37
- Hopkins et al. (2008) Hopkins, P. F., Hernquist, L., Cox, T. J., & Kereš, D. 2008, ApJS, 175, 356
- Kauffmann & Haehnelt (2000) Kauffmann, G. & Haehnelt, M. 2000, MNRAS, 311, 576
- Komossa (2006) Komossa, S. 2006, Mem. Soc. Astron. Italiana, 77, 733
- Labiano et al. (2008) Labiano, A., O’Dea, C. P., Barthel, P. D., de Vries, W. H., & Baum, S. A. 2008, A&A, 477, 491
- Lal & Rao (2007) Lal, D. V. & Rao, A. P. 2007, MNRAS, 374, 1085
- Landt et al. (2010) Landt, H., Cheung, C. C., & Healey, S. E. 2010, MNRAS, 408, 1103
- Landt et al. (2002) Landt, H., Padovani, P., & Giommi, P. 2002, MNRAS, 336, 945
- Leahy & Parma (1992) Leahy, J. P. & Parma, P. 1992, in Extragalactic Radio Sources. From Beams to Jets, ed. J. Roland, H. Sol, & G. Pelletier, 307–308
- Leahy & Williams (1984) Leahy, J. P. & Williams, A. G. 1984, MNRAS, 210, 929
- León-Tavares et al. (2011) León-Tavares, J., Valtaoja, E., Chavushyan, V. H., et al. 2011, MNRAS, 411, 1127
- Lotz et al. (2008) Lotz, J. M., Jonsson, P., Cox, T. J., & Primack, J. R. 2008, MNRAS, 391, 1137
- Mateus et al. (2006) Mateus, A., Sodré, L., Cid Fernandes, R., et al. 2006, MNRAS, 370, 721
- Merritt & Ekers (2002) Merritt, D. & Ekers, R. D. 2002, Science, 297, 1310
- Mezcua et al. (2011) Mezcua, M., Lobanov, A. P., Chavushyan, V. H., & León-Tavares, J. 2011, A&A, 527, A38
- Rees (1989) Rees, M. J. 1989, MNRAS, 239, 1P
- Rottmann (2001) Rottmann, H. 2001, PhD thesis, Univ. Bonn
- Saripalli & Subrahmanyan (2009) Saripalli, L. & Subrahmanyan, R. 2009, ApJ, 695, 156
- Saripalli et al. (2008) Saripalli, L., Subrahmanyan, R., Laskar, T., & Koekemoer, A. 2008, ArXiv e-prints
- Schawinski et al. (2010) Schawinski, K., Dowlin, N., Thomas, D., Urry, C. M., & Edmondson, E. 2010, ApJ, 714, L108
- Scheuer (1995) Scheuer, P. A. G. 1995, MNRAS, 277, 331
- Silk & Norman (2009) Silk, J. & Norman, C. 2009, ApJ, 700, 262
- Strateva et al. (2001) Strateva, I., Ivezić, Ž., Knapp, G. R., et al. 2001, AJ, 122, 1861
- Tadhunter et al. (2005) Tadhunter, C., Robinson, T. G., González Delgado, R. M., Wills, K., & Morganti, R. 2005, MNRAS, 356, 480
- Tingay et al. (1998) Tingay, S. J., Jauncey, D. L., Reynolds, J. E., et al. 1998, AJ, 115, 960
- Toomre (1977) Toomre, A. 1977, in Evolution of Galaxies and Stellar Populations, ed. B. M. Tinsley & R. B. Larson, 401–+
- Tremaine et al. (2002) Tremaine, S., Gebhardt, K., Bender, R., et al. 2002, ApJ, 574, 740
- Wu & Liu (2004) Wu, X. & Liu, F. K. 2004, ApJ, 614, 91