A two-layer team-assembly model
for invention networks
Abstract
Companies are exposed to rigid competition, so they seek how best to improve the capabilities of their innovations. One strategy is to collaborate with other companies in order to speed up their own innovations. Such inter-company collaborations are conducted by inventors belonging to the companies. At the same time, the inventors also seem to be affected by past collaborations between companies. Therefore, interdependency of two networks, namely inventor and company networks, exists.
This paper discusses a model that replicates two-layer networks extracted from patent data of Japan and the United States in terms of degree distributions. The model replicates two-layer networks with the interdependency. Moreover it is the only model that uses local information, while other models have to use overall information, which is unrealistic. In addition, the proposed model replicates empirical data better than other models.
keywords:
Network , Layer , Group , Patent , Inventor1 Introduction
Companies increasingly need to maximize the capacity of innovations because of growing competition [1, 2], and they consider the core of that capacity to be knowledge [3, 4, 5]. One strategy to acquire knowledge is to collaborate with other companies because collaborations enable companies to capitalize on external knowledge [6, 7] and speed up innovations [3]. Commensurate with this, companies now place more importance on collaborations [8], and the number of co-patents between companies is increasing [9]. However, companies cannot unlimitedly acquire knowledge from other companies since they have different corporate cultures and unique tacit knowledge [10]. Therefore, companies must have a strategy to carefully choose their collaborators.
Much research has been done on generative models of collaboration networks in order to understand collaboration dynamics [11, 12, 13, 14]. When inventors or authors of papers collaborate, it has been found that they can create higher quality work than those authored by solo authors [15]. Also, inter-organizational work has more impact than intra-organizational work [16]. These previous studies focused on one-layer networks.
The collaborations in companies are conducted by individuals (i.e., developers or researchers) belonging to the companies. At the same time, the inventors seem to be affected by past collaborations between companies. Therefore, interdependency of two networks would be exist, i.e., individual and company networks.
Here, the author proposes a model of two-layer networks, where upper networks are expressed by aggregations of nodes and links belonging to lower networks. This model replicates networks extracted from patent data of Japan and the United States in terms of degree distributions. Although a lot of previous studies [17, 18, 19, 20, 21, 22, 23, 24, 25] have investigated two-layered networks, the proposed model can replicate the observed data better in degree distributions than those previous models. Also, the model only uses local information, while other models have to use overall information, which is an unrealistic set-up in complex networks.
This paper is organized as follows. The next section presents the data used in this study. In section 3, the model is proposed, and how it can replicate the observed networks is verified. Finally, a summary is provided.
2 Data
Patents are useful for understanding what innovations occur over time [26]. Using a massive data set enables us to understand the tendency of innovations. Patent data from Japan (JP) and the United States (US) are used as data sets [4, 27] in this paper.
The identifications (IDs) of rights holders and inventors are necessary to conduct this study. Assigning IDs to the rights holders is easy because their names and addresses give us sufficient information. Companies are extracted from the rights holders based on their names. The corporate statuses in the rights holders’ names provide the information in the JP data set. The US data set contains information that has already been added. In contrast, inventors are identified by name, address, and company. The details of the process are explained in A.
Another process is conducted to connect each inventor with a company. An inventor is connected to a company, (1) if an inventor can be found on a patent applied for by a certain company, or (2) if an inventor can be found in patents jointly applied for by companies and there is only one common company in the companies. Since most Japanese inventors’ addresses contain names of companies, that information is also used.
It has been more common for teams of inventors to apply for patents, and such patents statistically have better impact (more citations) than those authored by solo inventors [15]. However, it is less common for more than one company to jointly apply for patents. This is because no company can sell or license a patent jointly applied for without the consent of the others. Also, joint applications are more costly than other solutions such as solo applications with contracts for sharing benefits, and consequently, joint applications between companies are considered to be “second best” [8]. The number of patents jointly applied for by multiple companies account for 1.5% of all patents in the United States and 7.8% in Japan.
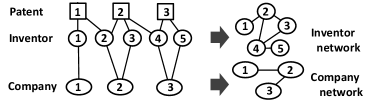
Table 1 summarizes the fundamental data from the two data sets with the number of patents, inventors, and companies. Figure 1 shows how two-layer networks are created from the data sets. The left of Figure 1 shows an example for three patents, five inventors, and three companies. One or more inventors apply for a patent, and each inventor works for a company. On the basis of the tripartite network on the left, we can create two different projected networks for the inventors and the companies. The inventor network is a network where every combination of inventors has a link if they have at least one patent in common. The company network is defined in the same way. If inventors who apply for a patent belong to different companies, the companies have a link.
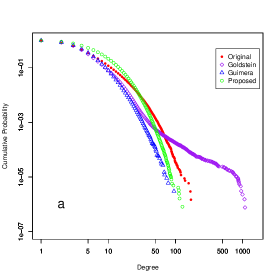
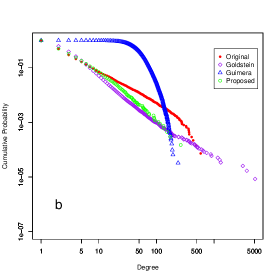
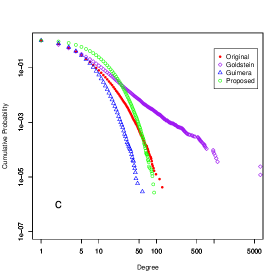
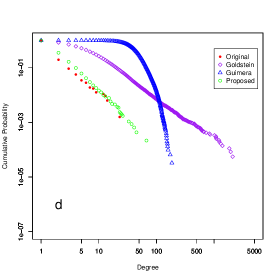
Figure 2 plots the cumulative probability distributions of degree. Original consists of the plots for the observed data. The other plots are the results of models explained in a later section. The figure plots the inventor and company networks for Japan and the U.S. A degree is a measure to count the number of links a certain node has. The figure indicates that the distributions for inventors decay faster than a power law. Previous studies found collaboration networks have the same distributions as those in this paper [11, 28] or power laws [29]. The plots of the company networks seem to be fitted by lines, i.e., power-law distributions. A previous study already found that the collaboration networks of organizations in Japanese patents have power-law distributions [30].
3 Model
On the basis of the observations thus far, the author proposes a model that replicates observed networks from the perspective of degree distributions.
This paper focuses on two-layer networks that involve inventors and companies. To date, numerous generative models for networks have been developed [31]. To replicate the networks in this paper, a generative model has to (1) explicitly assign a group (company) to each node of a replicated network, and (2) replicate not only a node (inventor) network but also a group network.
Grönlund et al. proposed a modified seceder model to illustrate real social networks [20]. Jin et al.’s model was based on the dynamics that people actually meet [17]. Boguá introduced the concept of social distance and found models that could reproduce real social networks [19]. These models treat the formation of groups in observed networks and seem similar to the model that will be proposed. However, they create networks of individuals and detect groups of individuals after creating individual networks [32, 33, 34]. This means groups are not explicitly given. As previously mentioned, the proposed model has to explicitly provide a group to each node (item (1)). Therefore, these studies are different from this study.
There are some models that provide groups to nodes beforehand when they produce networks. Motter et al. considered the correlation of friendships, the positions in groups, and the correlation of positions in groups [18]. Kimura et al. demonstrated that their model improved the prediction of real networks by incorporating directional attachments and community structures [21]. These models seem similar to the model that will be proposed, but their organizational structures are given and do not grow (item (2)).
Li and Chen also analyzed their theoretical model that satisfies both items (1) and (2). They showed that the degree distribution of the model was a power law in both nodes and groups [23]. As explained in the previous section, the degree distributions of the inventors are not a power law. Therefore, their model cannot be applied either.
This section was a survey of relevant but inapplicable studies. The following section, on the other hand, presents two relevant models that have already been proposed and are important as a comparison.
3.1 Goldstein et al.’s model
Goldstein et al. proposed a model to replicate paper-author networks with groups of authors [22]. Their model satisfies both items (1) and (2) in the previous section. It is important to point out that they did not investigate structures of networks created between groups. Goldstein et al.’s model is comparable to the model proposed in this paper.
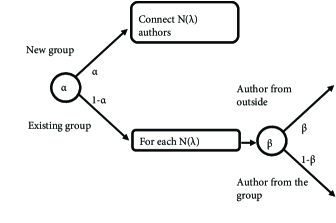
Figure 3 is a diagram that the author drew to describe the model. When a paper is created, there is probability that a new author group will be created with new members, where is a constant. The number of authors in the paper, , is the first author plus a Poisson-distributed number of additional authors. This one-shifted Poisson distribution has parameter . The probability of the one-shifted Poisson distribution, , is given by
| (1) |
where is the number of authors and is the probability of a paper having authors.
If no new group is created, an existing author group is chosen using the following probability distribution:
| (2) |
where is the number of papers that this group has published, is the total number of papers in the network, and is the probability of an existing group having authored a paper.
When adding each author, there is probability to choose an author from another group. After choosing a group, a selection of the author is done by using another preferential process. The probability of selecting author in the group is
| (3) |
where is the number of papers written by author , is the sum of the number of authorships of authors in the group, and is the number of authors in the group.
Goldstein et al.’s model is simple and comparable to the model the author will propose. However, it is to be noted that Goldstein et al.’s model requires overall information to calculate Eq. (2) and (3). The availability of overall information is normally unrealistic because collaboration networks are vast and complex.
3.2 Guimera et al.’s model
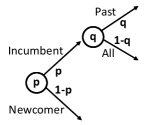
The model proposed later is based on Guimera et al.’s model [28], which aims to replicate the self-assembly of creative teams and has two parameters, which are of the fraction of newcomers in new productions () and the tendency of incumbents to repeat previous collaborations ().
Figure 4 outlines the process of how the model progresses. The model has an endless pool of newcomers. Newcomers become incumbents after being selected. The model adds members to a team according to 111 There are various ways of creating the sequence for : e.g., keep constant, or draw from the observed distribution. The latter is used in this paper. . Probability indicates a member drawn from the pool of incumbents. If a member has already been chosen from the pool of incumbents and there is already another incumbent that is already connected but has not been chosen, a new member is chosen with probability from the incumbents. Otherwise, a member is chosen from all the incumbents. The process is repeated times for each team.
3.3 The proposed model
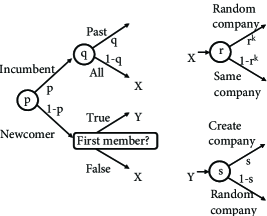
The purpose of this paper is to propose a new model based on Guimera et al.’s model that can replicate the two-layered networks obtained from the empirical data better than the models studied previously. Figure 5 outlines the proposed model. Guimera et al.’s model remains at the top left. The model contains a new process for choosing companies (X) and creating companies (Y). There is a branch when an inventor is a newcomer. If the inventor is the first member of a team, Y is executed. If it is not, X is executed. X has a parameter, . Here, , where is the number of companies already included in the patent, is the probability of choosing a company from the pool of all existing companies. Then, the newcomer or the incumbent is assigned to the chosen company. If is not true, the same company that one of the members already belongs to is chosen for the newcomer or the incumbent. Y has a parameter, , which is the probability of creating a new company. Then, the newcomer is assigned to the chosen company. If is not true, a company is randomly chosen from the pool of all existing companies, and then the newcomer is assigned to it.
3.4 Simulation results and discussion
The author applied Goldstein et al.’s, Guimera et al.’s, and the proposed models to replicate two-layer networks observed in the empirical data in order to see how the proposed model improves on the replication compared to previous models. The comparison was conducted after tuning parameters of each model. The tuned parameters were , , , and for Goldstein et al.’s model, and for Guimera et al.’s model, and , , , and for the proposed model.
The tuning was conducted through simulated annealings [35]. Parameters are initially set according to values that seem to be the closest values that can be obtained from the observed data.
The initial values of the parameters in Goldstein et al.’s model were , , , and for Japanese data and , , , and for the U.S. data. The sizes of steps to search neighborhoods in simulated annealings were 0.01 for and , 0.1 for , and 1 for . The following observed values were used as initial values. The probability where new companies are found in patents was used as . The average fraction of another company’s inventor was used as . Since is a parameter of the one-shifted Poisson distribution Eq. (1), can be obtained through the least squares method to fit the one-shifted Poisson distribution to the distribution of the number of authors. The average of the number of authors in patents was used as .
Two parameters, and , which are necessary to run Guimera et al.’s model, were initially set as and for Japanese data and and for the U.S. data. The sizes of steps were 0.01 for and . The author calculated the fraction of newcomers to members in every patent and the average of the fractions was used as . The author also calculated the fractions of repeated collaborations to all collaborations in every patent, and then the average of the fractions was used as . Each inventor was randomly assigned to a company from a pool in the simulation. The pool had the same number of companies as the observed data.
New parameters in the proposed model, namely, and , were initially set as and for Japanese data and as and for the U.S. data. The sizes of steps were 0.01 for and . The author obtained the probability distribution that a newcomer belongs to a different company other than companies already included in the patent. Then, was set through the least squares method for the distribution. was set to the probability that a new inventor belongs to a new company. The other initial settings were the same as those in the simulations of Guimera et al.’s model.
The simulated annealing created and evaluated the networks 1,000 times. A probability to adopt worse parameters than the current parameters exponentially decayed as the repetitions progress. Every repetition of the simulated annealing created 1,696,635 patents to replicate Japanese networks and 722,350 patents to replicate the U.S. networks.
To evaluate the replicated networks, Kolmogrov-Smirnov (KS) statistic, which indicates distances of two cumulative probability distributions was used. Here, two cumulative probability distributions are drawn from the obtained and replicated networks. Since there are two different networks to evaluate, i.e., inventor and company networks, the sum of KS statistics of the two networks was used as an evaluation value.
Table 2 lists the results of the parameter fitting. The Total column indicates the sums of KS statistics of inventor and company networks, which were used as evaluation values in the simulated annealings. The KS statistics are given for the inventor’s and company’s cumulative degree distributions for Goldstein et al.’s, Guimera et al.’s, and the proposed models. The smaller a KS statistic is, the closer two distributions drawn from a replicated and the observed networks are.
The total values of Guimera et al.’s model in Table 2 show that the model is not comparable to the others. The fitted parameters are and for Japanese data and and for the U.S. data. Although Guimera et al.’s model was able to replicate the inventor’s network well, it has large KS statistics in company networks. Figure 2 also shows large deviations from the original data in company networks. Since all inventors are randomly assigned to companies in the simulations, similar numbers of inventors are assigned to all companies. Therefore, the company distribution does not match the observed one.
On the other hand, Goldstein et al.’s model seems to be comparable to the proposed model. The fitted parameters are , , , and for Japanese data and , , , and for the U.S. data. The evaluation value in the JP data is superior to the one in the proposed model (Table 2). However, we can see large deviations from the observed data in the inventors’ network in Figure 2. This is because KS statistics are absolute values, and they evaluate the tails of distributions less. This large deviation in the tail shows that Goldstein et al.’s model does not seem to be a better model than the proposed model.
The proposed model appears to be able to replicate the observed networks better, although the proposed model does not always show better performance than Goldstein et al.’s model in the KS statistics. It is clear from Figure 2 that the proposed model does not have as large a deviation as the other models. The fitted parameters are , , , and for Japanese data and , , , and for the U.S. data. Note that the proposed model does not require overall information, which Goldstein et al.’s model requires. Since overall information is unrealistic, this is one point of improvement of the proposed model.
Since the model replicates the degree distributions of inventors and companies better than the other models, the characteristics of the proposed model may help to understand the mechanism for choosing the partners as inventors and companies. The following three characteristics can be deduced from the proposed model. (1) Inventors with many connections to other inventors have greater possibilities of obtaining other connections in the future; since the results of fitting showed and have large values, the path of and (Figure 5) often happens. Therefore, an inventor with many links is likely to be involved in a team. (2) Companies with many inventors can acquire inter-company connections; a new connection between companies can mainly be obtained from the path where is true, is false, and is true. Since an incumbent is randomly chosen in the process, a company with many incumbents is likely to be chosen. (3) Inter-company connections grow by attracting new connections to the existing inter-company connections; as it has already been mentioned in (1), the path of and often happens. If there is an inter-company team, other inventors tend to be involved in the team. Therefore, inter-company links are likely to increase.
It has to be admitted that the proposed model does not truly replicate the observed data because it cannot pass statistically strict tests, such as a KS test. However, no other models, even for one-layer networks, seem to be able to replicate true distributions either. Therefore, the proposed model can be considered as the first step toward a better model.
4 Summary
This paper attempted to clarify interdependency between inventor and company networks using patent data from Japan and the United States. Also, two different networks were created from tripartite graphs of patents, companies, and inventors.
The author created a model to replicate two-layer networks to understand the interdependent evolution of the networks. The model is based on Guimera et al.’s model and was able to replicate the observed networks better in terms of cumulative degree distributions than other models. A key characteristics of the proposed model is that all processes only use local information, which is not achieved by other models.
References
- Geroski et al. [1993] P. Geroski, S. Machin, J. Reenen, The profitability of innovating firms, The RAND Journal of Economics 24 (1993) 198–211.
- Czarnitzki [2004] D. Czarnitzki, An empirical test of the asymmetric models on innovative activity: who invests more into R&D, the incumbent or the challenger?, Journal of Economic Behavior & Organization 54 (2004) 153–173.
- Grant [1996] R. Grant, Toward a knowledge-based theory of the firm, Strategic management journal 17 (1996) 109–122.
- Hall et al. [2001] B. Hall, A. Jaffe, M. Trajtenberg, The nber patent citations data file: Lessons, insights and methodological tools, National Bureau of Economic Research Working Paper 8498, 2001.
- McEvily and Chakravarthy [2002] S. McEvily, B. Chakravarthy, The persistence of knowledge-based advantage: an empirical test for product performance and technological knowledge, Strategic Management Journal 23 (2002) 285–305.
- Chesbrough [2003] H. W. Chesbrough, Open innovation, Harvard Business School, 2003.
- Laursen and Salter [2006] K. Laursen, A. Salter, Open for innovation: the role of openness in explaining innovation performance among U.K. manufacturing firms, Strategic Management Journal 27 (2006) 131–150.
- Hagedoorn et al. [2003] J. Hagedoorn, H. Kranenburg, R. Osborn, Joint patenting amongst companies - exploring the effects of inter-firm r & d partnering and experience, Managerial and Decision Economics 24 (2003) 71–84.
- Hicks et al. [2000] D. Hicks, A. Breitzman Sr, K. Hamilton, F. Narin, Research excellence and patented innovation, Science and Public Policy 27 (2000) 310–320.
- Nonaka and Lewin [1994] I. Nonaka, A. Lewin, A dynamic theory of organizational knowledge creation, Organization Science 5 (1994) 14–37.
- Newman [2001] M. Newman, The structure of scientific collaboration networks, Proceedings of the National Academy of Sciences of the United States of America 98 (2001) 404–409.
- Barabási and Albert [2002] A. Barabási, R. Albert, Statistical mechanics of complex networks, Reviews of Modern Physics 74 (2002) 47–97.
- Newman [2004] M. Newman, Coauthorship networks and patterns of scientific collaboration, Proceedings of the National Academy of Sciences of the United States of America 101 (2004) 5200–5205.
- Ramasco et al. [2004] J. Ramasco, S. Dorogovtsev, R. Pastor-Satorras, Self-organization of collaboration networks, Physical Review E 70 (2004) 1–10.
- Wuchty et al. [2007] S. Wuchty, B. Jones, B. Uzzi, The increasing dominance of teams in production of knowledge, Science 316 (2007) 1036–1039.
- Jones et al. [2008] B. Jones, S. Wuchty, B. Uzzi, Multi-university research teams: shifting impact, geography, and stratification in science, Science 322 (2008) 1259–1262.
- Jin et al. [2001] E. Jin, M. Girvan, M. Newman, Structure of growing social networks, Physical review. E 64 (2001) 046132.
- Motter et al. [2003] A. Motter, T. Nishikawa, Y.-C. Lai, Large-scale structural organization of social networks, Physical Review E 68 (2003) 1–5.
- Boguá et al. [2004] M. Boguá, R. Pastor-Satorras, A. Díaz-Guilera, A. Arenas, Models of social networks based on social distance attachment, Physical Review E 70 (2004) 1–8.
- Grönlund and Holme [2004] A. Grönlund, P. Holme, Networking the seceder model: Group formation in social and economic systems, Physical Review E 70 (2004) 1–9.
- Kimura et al. [2004] M. Kimura, K. Saito, N. Ueda, Modeling of growing networks with directional attachment and communities, Neural networks 17 (2004) 975–988.
- Goldstein et al. [2005] M. Goldstein, S. Morris, G. Yen, Group-based yule model for bipartite author-paper networks, Physical Review E 71 (2005) 1–6.
- Li and Maini [2005] C. Li, P. Maini, An evolving network model with community structure, Journal of Physics A: Mathematical and General 38 (2005) 9741–9749.
- Chessa et al. [2013] A. Chessa, A. Morescalchi, F. Pammolli, A. P. O. Penner, M. Riccaboni, Is europe evolving toward an integrated research area?, Science 339 (2013) 650–651.
- Morescalchi et al. [2013] A. Morescalchi, F. Pammolli, O. Penner, A. Petersen, M. Riccaboni, Networks of innovators within and across borders, RePec working paper (2013).
- Griliches [1998] Z. Griliches, R&D and Productivity-The Economic Evidence, The University of Chicago Press, Chicago, 1998.
- Tamada et al. [2002] S. Tamada, F. Kodama, K. Gemba, A study on science linkage of Japanese patents; an analysis on patents in the field of genetic technology by constructing a citation database, The Journal of Science Policy and Research Management 17 (2002) 222–230.
- Guimera et al. [2005] R. Guimera, B. Uzzi, J. Spiro, L. Amaral, Team assembly mechanisms determine collaboration network structure and team performance, Science 308 (2005) 697–702.
- Barabási et al. [2002] A. Barabási, H. Jeong, Néda, E. Ravasz, A. Schubert, T. Vicsek, Evolution of the social network of scientific collaborations, Physica A 311 (2002) 590–614.
- Inoue et al. [2007] H. Inoue, W. Souma, S. Tamada, Spatial characteristics of joint application networks in Japanese patents, Physica A 383 (2007) 152–157.
- Albert and Barabasi [2002] R. Albert, A. Barabasi, Statistical mechanics of complex networks, Reviews of Modern Physics 74 (2002) 47–97.
- Girvan and Newman [2002] M. Girvan, M. Newman, Community structure in social and biological networks, Proceedings of the National Academy of Sciences of the United States of America 99 (2002) 7821–7826.
- Newman and Girvan [2004] M. Newman, M. Girvan, Finding and evaluating community structure in networks, Physical Review E 69 (2004) 1–15.
- Radicchi et al. [2004] F. Radicchi, C. Castellano, F. Cecconi, V. Loreto, D. Parisi, Defining and identifying communities in networks, Proceedings of the National Academy of Sciences of the United States of America 101 (2004) 2658–2663.
- Kirkpatrick et al. [1983] S. Kirkpatrick, C. Gelatt Jr., M. Vecchi, Optimization by simulated annealing, Science 220 (1983) 671–680.
- Trajtenberg et al. [2006] M. Trajtenberg, G. Shiff, R. Melamed, The “NAMES GAME”: Harnessing Inventors’ Patent Data for Economic Research, National Bureau of Economic Research Working Paper 12479, 2006.
Appendix A Results of inventor identification
Assigning IDs to inventors requires an additional process for the patent data. The original patent data did not have IDs. A comprehensive study has been done on this identifying process [36], which considers names, addresses, affiliations, co-inventors, technological classifications, citations, and different spellings of names. However, this detailed process mainly aims to net out the movements of inventors. This paper does not consider the movements. Thus, it is sufficient to identify inventors by their names, addresses, and affiliations.
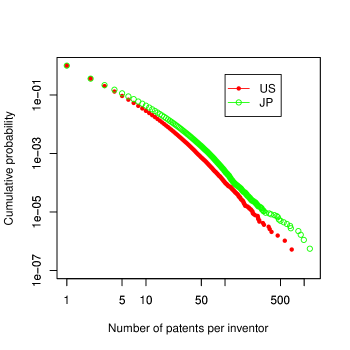
Figure A.1 plots cumulative probabilities of the number of patents per inventor. The Japanese and U.S. data have similar patterns. After the identification, 4,649,617 names in patents were merged into 1,806,259 inventors in Japan and 4,301,229 names merged into 1,923,241 inventors in the U.S.
| US | JP | |||
|---|---|---|---|---|
| Duration (year) | 1963-1999 | 1994-2008 | ||
| Total number of patents | 2,923,922 | 1,967,361 | ||
| Number of companies | 33,515 | 72,841 | ||
| Number of inventors in companies | 285,418 | 829,052 | ||
| Number of patents by multiple inventors | 347,450 | 1,043,639 | ||
| Total number of patents by companies | 722,350 | 1,696,635 | ||
| Number of patents by multiple companies | 28,345 | 132,704 | ||
| JP | Inventor | Company | Total |
|---|---|---|---|
| Goldstein et al.’s model | 0.05 | 0.12 | 0.17 |
| Guimera et al.’s model | 0.04 | 0.93 | 0.97 |
| Proposed model | 0.18 | 0.03 | 0.21 |
| US | Inventor | Company | Total |
|---|---|---|---|
| Goldstein et al.’s model | 0.05 | 0.65 | 0.70 |
| Guimera et al.’s model | 0.03 | 0.98 | 1.01 |
| Proposed model | 0.23 | 0.13 | 0.46 |