11email: saalto@chalmers.se 22institutetext: Institute of Astronomy and Astrophysics, Academia Sinica, P.O. Box 23-141, Taipei 10617, Taiwan 33institutetext: Department of Astronomy, University of Wisconsin-Madison, 5534 Sterling, 475 North Charter Street, Madison WI 53706, USA 44institutetext: European Southern Observatory, Alonso de Córdova 3107, Vitacura, Casilla, 19001, Santiago 19, Chile
Winds of change - a molecular outflow in NGC 1377?
Abstract
Aims. Our goal was to investigate the molecular gas distribution and kinematics in the extreme FIR-excess galaxy NGC 1377 and to address the nature and evolutionary status of the buried source.
Methods. We use high (, ( pc)) and low () resolution SubMillimeter Array (SMA) observations to image the 12CO and 13CO 2–1 line emission.
Results. We find bright, complex 12CO 2–1 line emission in the inner 400 pc of NGC 1377. The 12CO 2–1 line has wings that are tracing a kinematical component which appears perpendicular to the component traced by the line core. Together with an intriguing X-shape of the integrated intensity and dispersion maps, this suggests that the molecular emission of NGC 1377 consists of a disk-outflow system. Lower limits to the molecular mass and outflow rate are (H2) M⊙ and 8 M⊙ yr-1. The age of the proposed outflow is estimated to 1.4 Myrs, the extent to 200 pc and the outflow speed to =140 . The total molecular mass in the SMA map is estimated to (H2)= M⊙ (on a scale of 400 pc) while in the inner =29 pc the molecular mass is (H2) M⊙ with a corresponding H2 column density of (H2)= and an average 12CO 2–1 brightness temperature of 19 K. 13CO 2–1 emission is found at a factor 10 fainter than 12CO in the low resolution map while C18O 2–1 remains undetected. We find weak 1 mm continuum emission of 2.4 mJy with spatial extent less than 400 pc.
Conclusions. Observing the molecular properties of the FIR-excess galaxy NGC 1377 allows us to probe the early stages of nuclear activity and the onset of feedback in active galaxies. The age of the outflow supports the notion that the current nuclear activity is young - a few Myrs. The outflow may be powered by radiation pressure from a compact, dust enshrouded nucleus, but other driving mechanisms are possible. The buried source may be an AGN or an extremely young (1 Myr) compact starburst. Limitations on size and mass lead us to favour the AGN scenario, but further studies are required to settle the issue. In either case, the wind with its implied mass outflow rate will quench the nuclear power source within a very short time of 5–25 Myrs. It is however possible that the gas is unable to escape the galaxy and may eventually fall back onto NGC 1377 again.
Key Words.:
galaxies: evolution — galaxies: individual: NGC 1377 — galaxies: active — galaxies: starburst — radio lines: ISM — ISM: molecules1 Introduction
A small subset of galaxies deviate strongly from the well-known radio-to-FIR correlation through having excess FIR emission as compared to the radio (; =log[FIR/3.75 Hz]/(1.4GHz) (Helou et al. 1985)). There are several potential interpretations of the excess including very young synchrotron-deficient starbursts or dust enshrouded Active Galactic Nuclei (AGN). AGNs obscured by nuclear dust are likely also in the early stages of their evolution where nuclear material has not yet been dispersed and/or consumed to feed the growth of the black hole. The FIR-excess galaxies are rare - Roussel et al. (2003) find that they represent a small fraction (1%) of an infrared flux-limited sample in the local universe, such as the IRAS Faint Galaxy Sample. Despite their scarcity, which likely is an effect of the short time spent in the FIR-excess phase, these objects deserve careful study. Their implied youth provides an ideal setting to better understand the initial conditions and early evolution of starburst and/or AGN activity, as well as insights into how the infrared and radio emission is regulated in galaxies.
1.1 The extreme FIR-excess galaxy NGC 1377
NGC 1377 is a member of the Eridanus galaxy group at an estimated distance of 21 Mpc (1″=102 pc) and has a far-infrared luminosity of L☉ (Roussel et al. 2003). In stellar light, NGC 1377 has the appearance of a regular lenticular galaxy (de Vaucouleurs et al. 1991), with a diameter of 1, a large scale inclination of 60∘ and a major axis position angle (PA) of 92∘ (as derived from the K-band image). However, Heisler & Vader (1994) reported the presence of a faint dust lane along the southern part of the minor axis, perturbing an otherwise featureless morphology. NGC 1377 is a Sixty Micron Peaker (SMP) meaning that its IR SED peaks near 60m. SMPs are often found to have peculiar morphologies and are either classified as H II region like or Sy 2 - where the Sy 2 are somewhat more common (e.g. Heisler & Vader 1994; Laureijs et al. 2000).
NGC 1377 is the most extreme example known so far of an FIR-excess galaxy with radio synchrotron emission being deficient by at least a factor of 37 with respect to normal galaxies (Roussel et al. 2003, 2006) (corresponding to ). Interestingly, H II regions were not detected through near-infrared hydrogen recombination lines or thermal radio continuum (Roussel et al. 2003, 2006). The presence of cold molecular gas in the center of NGC 1377 is evident through bright single-dish 12CO 1–0 and 2–1 line emission detected by Roussel et al. (2003). Deep mid-infrared silicate absorption features suggest that the nucleus is enshrouded by large masses of dust (e.g. Spoon et al. 2007) potentially absorbing all of the ionizing photons. The extremely high obscuration aggravates the determination of the nature of the nuclear activity.
Roussel et al. (2006) propose that NGC 1377 is a nascent (1 Myr) opaque starburst - the radio synchrotron deficiency caused by the extreme youth (pre-supernova stage) of the starburst activity where the young stars are still embedded in their birth-clouds. In contrast, Imanishi (2006) argue, based on the small 3.3 m PAH equivalent widths and very red -band continuum, that NGC 1377 harbours a buried AGN. Furthermore, Imanishi et al. (2009) find an HCN/HCO+ =1–0 line ratio exceeding unity, which they suggest is evidence of an X-ray Dominated Region (XDR) surrounding an AGN. They explain the lack of radio continuum through suggesting the presence of a large column of intervening material causing free-free absorption. Note, however, that the HCN/HCO+ line ratio determination of the XDR contribution is uncertain and is based on small differences in the ratios (see e.g. Fig. 5 in Krips et al. (2008)). Furthermore, the lack of a thermal radio continuum detection also put limits on the possibility of nuclear free-free absorption.
To further our understanding of the nature of NGC 1377 we obtained high resolution 12CO and 13CO 2–1 data with
the SubMillimeter Array (SMA) in Hawaii.
As NGC 1377 remains undetected in HI and H according to reports in the literature111Gallagher et al (2012 in preparation) obtained
a spectrum with the Southern African Large Telescope (SALT) that shows emission for H and [N II], and we therefore assume that these
lines, along with the previously measured [S II] double, are weak but present in NGC 1377. (Roussel et al. 2003, 2006)
the molecular lines seem to be an important way to study the gas properties and dynamics.
Our goal was to search for clues to the extreme FIR-excess
of NGC 1377 through the distribution and kinematics of the molecular gas. We found evidence of a molecular
disk-outflow system and we we use its properties to address the nature of the buried source.
In Sect. 2 we present the observations and results which are discussed in terms of the structure and power of a molecular disk-outflow system in Sect. 3.1 and Sect. 3.2. In Sect.3.3 possible power sources of the outflow are presented and in Sect. 3.4 we briefly compare with molecular outflows in the literature. The properties of the nuclear gas are discussed in Sect. 3.5 and evolutionary implications for NGC 1377 are discussed in Sect. 3.6.
2 Observations and results
NGC 1377 was observed with the SubMillimeter Array (SMA) on 2009 July 17th, in the very-extended configuration (8 antennas), and on 2009 October 12th, in the compact configuration (7 antennas). The phase center was set at =03:36:39.10 and =20:54:08.0 (J2000). During both nights, the zenith atmospheric opacity at 225 GHz was near 0.1, resulting in system temperatures in the range 100 – 200 K depending on source elevation.
The heterodyne SIS receivers were tuned to the frequency of the 12CO 2–1 transition at 230.538 GHz in the upper sideband, while the 13CO 2–1 transition was observed in the lower sideband. The correlator was configured to provide a spectral resolution of 0.8125 MHz.
The bandpass of the individual antennas was derived from the bright quasars J in July, and 3C454.3 in October. The primary flux calibration was set on Callisto and Uranus, respectively. The close-by quasars J0423-013 (4 Jy at 1 mm) and J0334-401 (1.3 Jy) were observed regularly for complex gain calibration, every 15 minutes for observations in the very-extended configuration, and every 25 minutes for the compact configuration. We derived a flux density for J0423-013 of 3.3 Jy in July and 4.5 Jy in October and for J0334-401 the derived flux density was 1.2 Jy in July and 1.4 Jy in October. The quasar J0340-213, closer to NGC 1377 ( away) but weaker (0.4 Jy) than J0423-013 and J0334-401 was also observed during the very-extended configuration track for calibration-testing purpose: after the gain solution derived from J0423-013 and J0334-401 was applied to J0340-213, it was found with no measurable offsets relative to its known position, and with a consistent flux, making us confident with the calibration of our very-extended configuration data.
After calibration within the dedicated MIR/IDL SMA reduction package, both visibility sets were converted into FITS format, and imported in the GILDAS/MAPPING and AIPS packages for further imaging.
2.1 12CO 2–1 emission
For the 12CO 2–1 data, sets of visibilities were combined and deconvolved using the Clark method with uniform weighting. This results in a synthesized beam size of with position angle PA=. We smoothed the data to a velocity resolution of 5 , yielding a rms noise level of 16 mJy beam-1.
Furthermore, data taken with the compact array were also deconvolved with natural weighting resulting in a synthesized beam size of (PA)( rms noise level of 23 mJy beam-1). This provides a low resolution map to which we compare the high resolution data.
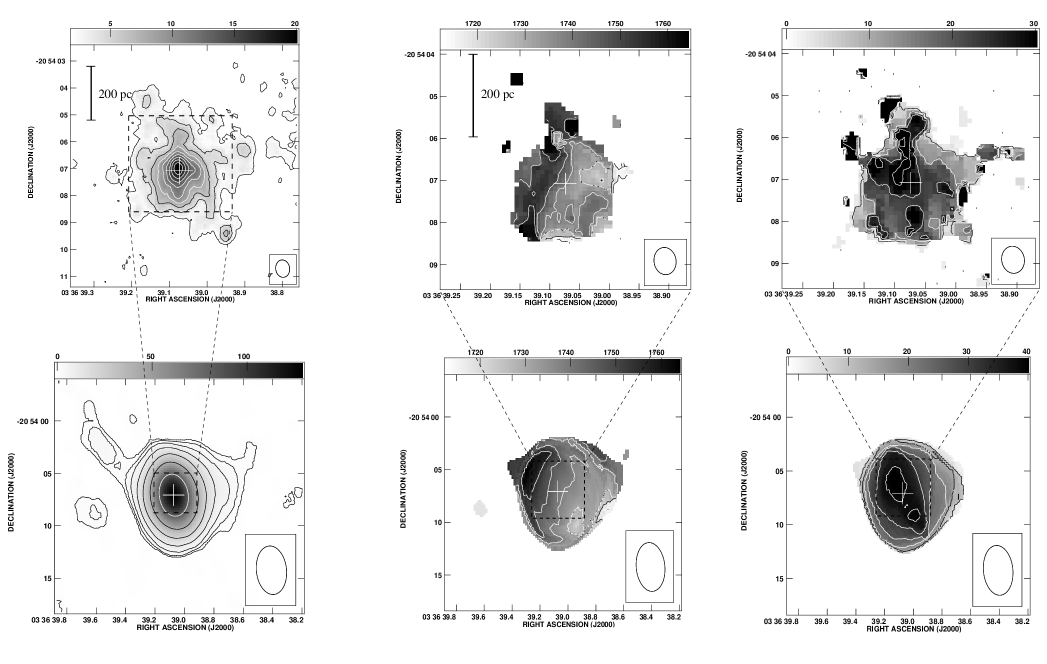
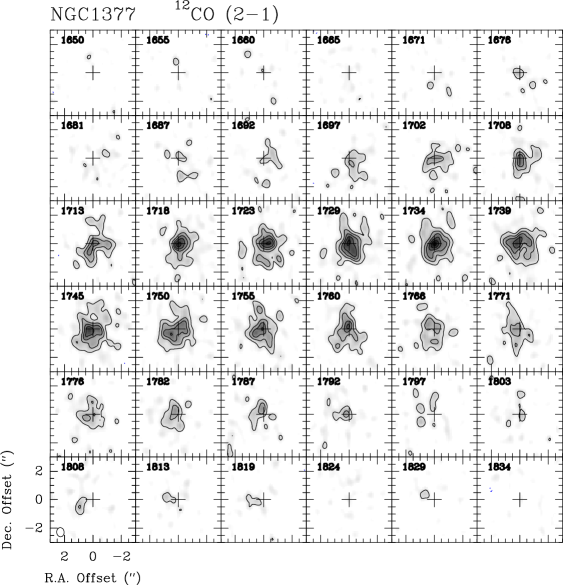
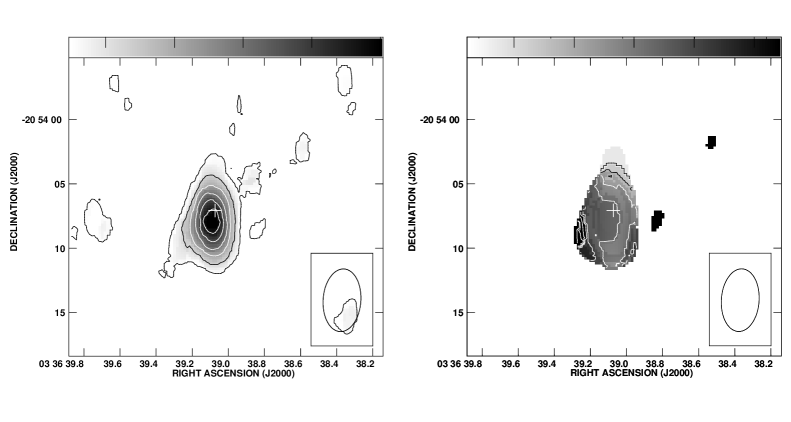
The integrated intensity maps, velocity fields and dispersion maps are presented in Fig. 1 and the high resolution channel maps are shown in Fig. 2.
2.1.1 The integrated 12CO 2–1 intensity and molecular mass
In the high resolution map (Fig. 1 , top left) the molecular emission is resolved and arises mostly from a region of 1″ (100 pc at =21 Mpc) in radius. (From a Gaussian fit we find a full width half maximum (FWHM) major axis of and minor axis ). Fainter emission extends out to a radius of 2–3″. The integrated emission structure is quite complex with various filamentary features extending out from the center. A tilted X-like shape appears to emerge from the center. In the low resolution map the emission is mostly unresolved, but some faint emission is extending to the west and north-east from the central condensation.
The integrated intensities and estimated molecular masses are presented in Tab. 1. The H2 column density towards the inner =58 pc (average beam diameter) is estimated to (H2)= leading to an average nuclear gas surface density of M⊙pc-2. The average column density for the central 390 pc is . Please see footnote to Tab. 1 for 12CO to H2 mass conversion. Potential errors are further discussed in Sect. 3.1.3.
We investigated what fraction of the single dish flux was recovered with our interferometric observations by comparing with our IRAM 30m 12CO 2–1 observations. We find a 12CO 2–1 luminosity in the 9″ IRAM beam of K pc2 - to be compared to the SMA total 12CO luminosity of K pc2. Within the errors we conclude that all of the IRAM 30m flux has been recovered with the interferometer.
| Positionb (J2000) | : 03:36:39.076 ( 0.″2) |
|---|---|
| : -20:54:07.01 ( 0.″1) | |
| Peak flux densityc | 270 16 (mJy beam-1) |
| Fluxd | |
| (central beam) | (Jy ) |
| (whole map) | (Jy ) |
| Molecular masse | |
| (central beam) | M⊙ |
| (whole map) | M⊙ |
a) The high resolution 12CO 2–1 data. Listed errors are 1 rms.
b) The position of the 12CO 2–1 integrated intensity. The peak is at :03:36:39.073 :-20:54:07.08 at =1734 .
c) The Jy to K conversion in the beam is 1 K=14.5 mJy.
d) A two-dimensional Gaussian was fitted to the integrated intensity image.
e) The 12CO luminosity (12CO)=(12CO) K pc2 (where is in Mpc, in ″and (12CO) in K ) and M(H2)=3.47(12CO) for (H2)/(12CO)= ). The conversion factor has been calibrated for 12CO 1–0 emission- thus, if the 12CO is subthermally excited the H2 mass estimated from the 2–1 line should be corrected upwards. From our IRAM 12CO 2–1 and 1–0 data we estimate that the 2–1/1–0 line ratio to 0.7 - and hence we correct out masses upwards by 30%.
2.1.2 Kinematics
Velocity field: The high resolution velocity field (Fig. 1, top centre) shows complex dynamics dominated by red-shifted gas to the east of the center
and blue-shifted gas to the west. Fitted velocity centroids range from 1690 to 1770 . In the low resolution map, the position angle of
the smoother velocity field is dominated by a PA component and velocity centroids range from 1712 to 1764 .
The velocity centroids were determined through a flux weighted first moment of the spectrum of each pixel therefore assigning one
velocity to a potentially complex spectral structure.
Dispersion maps: The high resolution dispersion map (Fig. 1, top right) shows a distinct X-like shape - where the “x” itself has a PA of
35∘ – 40∘. Dispersion (one dimensional, ) in the X-structure is typically 25 , but - reaches 44 or higher in isolated regions.
The large dispersion is caused by multiple, narrow, spectral features and/or broad wing-like components.
The low resolution dispersion map shows a less complicated pattern where the dispersion is dominated by a bipolar large scale
feature with peaks of =40 .
The dispersion was determined through a flux weighted second moment of the spectrum of each pixel. This corresponds to the one-dimensional velocity
dispersion (i.e. the FWHM line width of the spectrum divided by 2.35 for a Gaussian line profile).
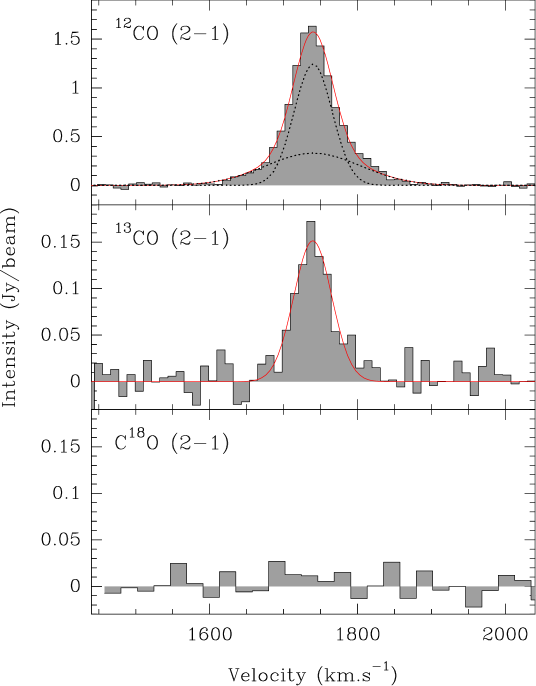
Spectra and channel map: The low resolution integrated 12CO 2–1 spectrum is characterized by narrow emission at the
line center with FWHM line width 60 and by triangular-shaped wings (or plateau)
ranging from 1620 to 1860 (see Fig. 3 top panel). Wings are therefore stretching out to (projected).
This line shape is also seen in the SEST single-dish 12CO 1–0 spectrum by Roussel et al. (2003).
The high resolution channel map reveals significant structure and complexity in the 12CO 2–1 line emission
per channel. Note that there is no evidence of a bright, broad compact emission from an unresolved nuclear source.
Brightest line emission in terms of peak (19 K) occurs at =1734 which we adopt as the center velocity.
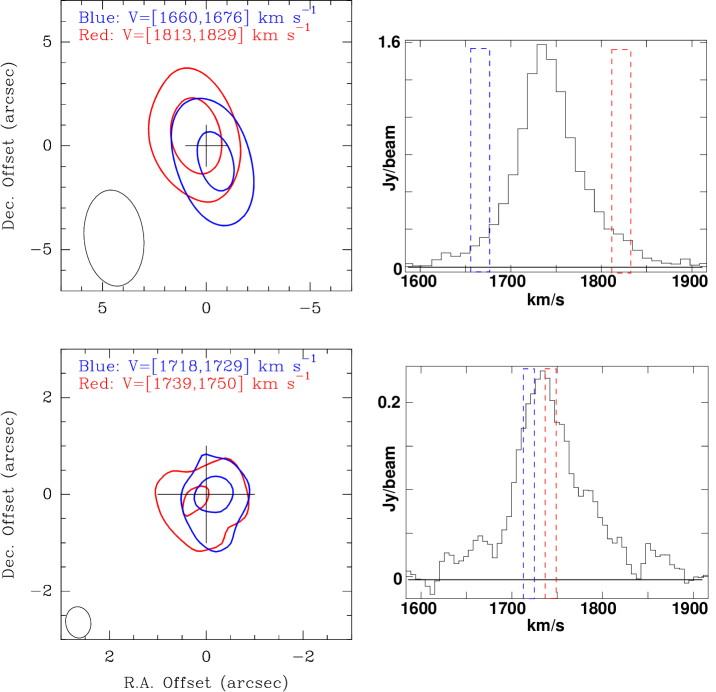
Line wings: To identify the spatial origin of the line wings, we integrated the emission corresponding to velocities 1660 – 1676 km s-1 (blue wings) and 1813 – 1829 km s-1 (red wings) (=1734 ) in the low resolution 12CO 2–1 data. The resulting map is presented as the top left panel of Fig. 4. The blue and red wings are spatially separated by 2″and with a PA of 45∘. In the lower left panel of Fig. 4 we present an image from the high resolution data. Here we have integrated the emission corresponding to the central channels: blue:1718-1729 and red: 1739-1750 . In this figure, we see a velocity shift along an axis perpendicular to the one seen for the line wings of the low resolution data.
The relative positional uncertainty is on the order of (beam size)/(s/n ratio). For the low resolution wing map this is less than 0.″7 and for the high res map it is 0.″05 - 0.″1 . Therefore the two orthogonal velocity gradients are observationally robust.
2.2 13CO and C18O 2–1 emission
For 13CO and C18O 2–1, as the signal-to-noise ratio is lower, we used only data from the compact configuration, deconvolved using natural weighting and smoothed to a velocity resolution of 11 km s-1. The resulting beam size is (P.A. ) and the rms noise level is 13 mJy beam-1. The low resolution 13CO and C18O spectra are presented in Fig. 3. The 13CO is clearly detected and a factor of 9–10 fainter than 12CO. C18O is not detected and the 12CO/C18O 2–1 peak line intensity ratio is 50. The integrated intensity and velocity field maps are presented in Fig. 5. The 13CO peak integrated emission is offset by (90 pc) to the south-east from the peak integrated 12CO emission. Furthermore, the 13CO velocity field appears more consistent with that of the high-resolution 12CO data.
2.3 Continuum emission
We detect (4) weak 225 GHz continuum in NGC 1377 of 2.4 () mJy beam-1 in the compact array at the position of the 12CO 2–1 line emission. The source is unresolved in the beam.
3 Discussion
3.1 A molecular outflow?
We propose that the molecular emission of NGC 1377 is dominated by a disk-outflow morphology. The notion of a molecular outflow is supported by the presence of 12CO 2–1 line wings (Fig. 3) and the spatial orientation of the wing-emission with respect to the line-center emission (Fig. 4). The X-shape of the integrated intensity and dispersion maps (Figs. 1 and 7) is consistent with a biconical outflow structure. In addition, Roussel et al. (2003) find NIR H2(1 0) S(1) line emission towards the inner 200 pc of NGC 1377 with an orientation of the velocity field similar to the one we find for the 12CO 2–1 line wings. Other alternatives to explain the kinematical structure of the 12CO 2–1 emission include a polar disk or inflowing gas. A polar disk is unlikely since this would require its velocity to be higher than the rotational velocity of the major axis disk. That the kinematics is the signature of an outflow, instead of inflowing gas, is supported by the optical dust absorption feature south of the nucleus visible in Fig. 1 in Roussel et al. (2006). The feature is spatially coincident with the blue-shifted line wing suggesting that the gas on the near side is coming towards us in an outflow. Note that non-circular motions in the galaxy plane may be present and will then add to the complexity of the dynamics.
Below we will discuss the morphology and estimates of molecular mass and velocity of the suggested outflow, but we begin with a brief discussion of the nuclear disk. The fitted properties of the molecular disk-outflow system are summarized in Tab. 2.
3.1.1 Disk morphology and nuclear dynamical mass
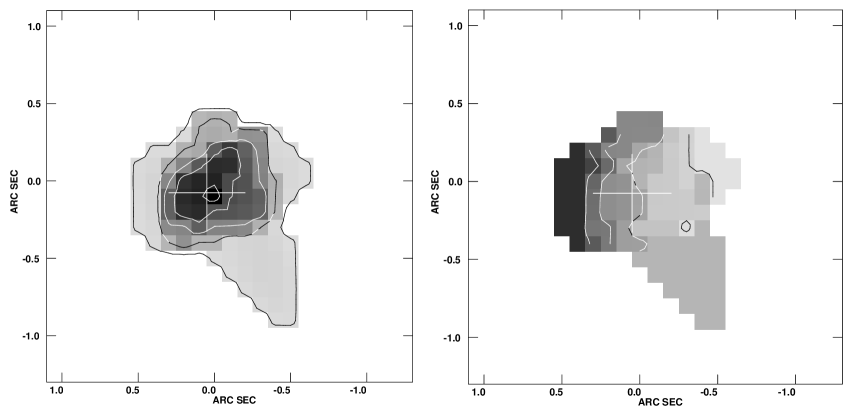
Disk morphology: To further investigate the notion of a disk-outflow system, we made moment maps of only the brightest emission
(above 190 mJy beam-1) isolating the narrow line emission emerging from the inner rotating disk (Fig. 6).
Note that the fitted PA of the disk of 110∘–130∘ is consistent with it being perpendicular to the wing emission, the outflow,
while the velocity field (right panel) is closer to a PA of 95∘.
This is expected if an outflow is affecting spectral shapes and velocities even close to the nucleus of NGC 1377.
The fitted disk diameter ((FWHM)=) should be viewed as a lower limit since we use only the top 23% of the emission.
Disk inclination is roughly determined to be 45∘ – 70∘. Uncertainties largely depend on the difficulty in small-scale separation between
disk and outflow components. The stellar large scale disk is estimated to have an inclination
of 60∘ (from the K-band image) and since it is consistent with the range of values for fits to the nuclear disk we will adopt this value for the nuclear disk as well.
Disk dynamics: The fitted maximum projected rotational velocity of the disk is 65 and for an inclination of 60∘ this results in a of 75 . The dynamical mass of the 60 pc diameter nuclear disk is estimated to Mdyn = M⊙ using the Keplerian formula M (where is in and in pc). This is only 2.3 times that of the estimated nuclear molecular mass implying a relatively high molecular gas mass fraction in the center of 40%. A limit to the diameter of the molecular disk (which would be the extension of the nuclear disk) can be set to 200 pc based on the total extent of the SMA high resolution 12CO 2–1 emission along the disk PA. This is of course sensitivity limited and a fainter, larger molecular extension to the disk is possible. The Keplerian dynamical mass of this 200 pc disk would be M⊙.
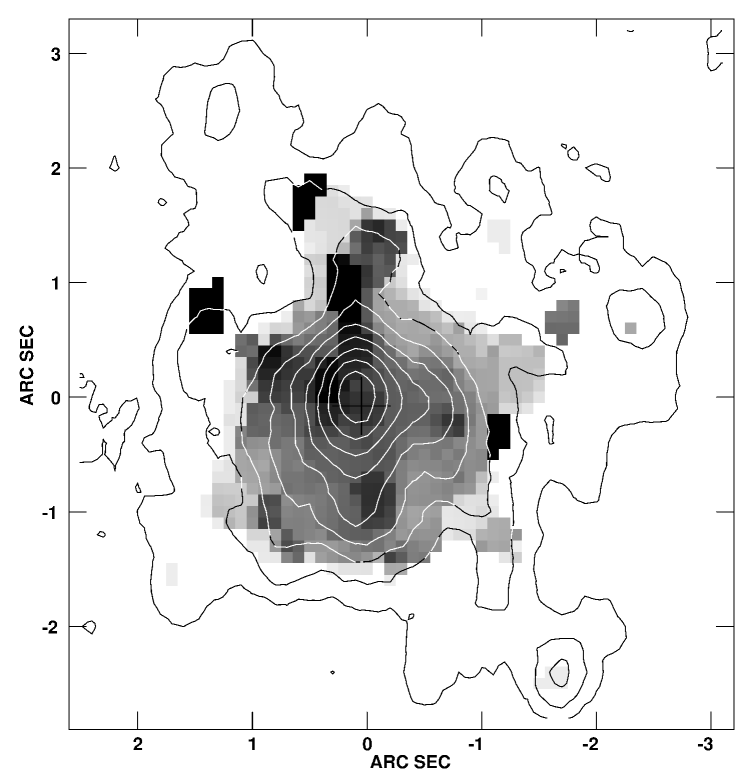
3.1.2 Outflow morphology
The X-shaped morphology of the high resolution integrated intensity and dispersion maps (see Fig. 7) suggests the molecular gas outlines a symmetric biconical structure centered on the nucleus. The cone has an opening angle of 60∘ – 70∘. Such a large opening angle could explain the complex velocity pattern observed in the high resolution map. The peak intensity and peak dispersion are roughly correlated in space. The large dispersion may be caused by line-of-sight effects in maximum path-lengths along the cone walls, and also by multiple spectral components where extended disk emission overlaps with emission from the outflowing gas.
Note, however, that the molecular outflow may not be well-collimated or in a simple well-ordered outflow pattern, but instead filamentary and patchy and the molecular emission is likely a mix of clumpy and extended gas. (Properties of wind-cone structures have been modeled by Tenorio-Tagle & Munoz-Tunon (e.g. 1998)). The X-shape structure also appears to be evident in the dust morphology of NGC 1377. The optical dust absorption feature south of the nucleus (Fig. 1 in Roussel et al. (2006)) shows a V-shape which is spatially coincident with the blue part of the molecular outflow. The red-shifted molecular outflow is then hidden behind the galaxy with the blue-shifted outflow projected in front of the disk on the southern side.
3.1.3 12CO luminosity and molecular mass of the outflow
Without a detailed model the 12CO 2–1 luminosity in the outflow is difficult to determine. Below we adopt two approaches to obtain upper and lower limits to the luminosity.
When estimating a lower limit to the luminosity in the outflow we restrict ourselves to the
(1628 – 1655 ) and (1813 –1840 ) part of the plateau component (i.e. 79 106 ) to ensure that the
rotational components are not included. We find a flux of Jy beam-1.
Since we are only considering a narrow (27 ) part of the 120 outflow this will be an underestimate of the
total 12CO 2–1 flux in the outflow. If the opening angle is as large as we discuss in Sect. 3.1.2 there will be significant projected outflow emission also at systemic velocities.
To obtain an upper limit of the outflow luminosity we fit a Gaussian to the line wings in the low resolution spectrum (see Fig.3). We first fit a Gaussian to the 13CO 2–1 spectrum (assuming that the 13CO has only a small contribution from the wings) where all parameters are free. We obtain: =0.150.1 Jy beam-1; =17402 and (FWHM)=615 . Then, for the 12CO 2–1, we fit two Gaussian curves, using the parameters from the 13CO fitting. The narrow component has =1.60.05 Jy beam-1 with and fixed. The broad component in the wings has, with fixed, =0.40.05 Jy beam-1 and (FWHM)=1518 (and the full width of the line wings is (projected)). The division of flux between the line core and outflow component is 104 and 65 Jy beam-1 respectively. Since we detect 20 Jy beam-1 in the central high resolution beam, the narrow component flux is mostly located outside of the inner 0.″6. This flux may be distributed as an extension to the nuclear disk we discuss above in Sec. 3.1.1.
To estimate the molecular mass in the outflow we adopt a standard 12CO-luminosty to M(H2) conversion factor (see footnote to Tab. 1). This results in M(H2)out= M⊙ for the lower limit and for the upper limit M(H2)out= M⊙. The validity of a standard 12CO to M(H2) conversion factor in galaxies is heavily debated (e.g. Narayanan et al. 2012; Wada & Tomisaka 2005; Paglione et al. 2001). The global 12CO/13CO 2–1 line intensity ratio of 9–10 suggests that the molecular gas in NGC 1377 is not optically thin (but 13CO limits in the line wings are not good enough for a reliable line ratio for the highest velocities in the outflow). It is also unclear whether the interferometer would pick up emission that is optically thin since it tends to have low surface brightness. We therefore suggest that applying the conversion factor here does not overestimate gas masses by more than factors of a few.
3.1.4 Mass outflow rate, velocities and acceleration.
The projected peak outflow velocity is 120 (section 2.1.2) and if the opening angle of the outflowing gas is (and the disk inclination is =) then the actual maximum outflow velocity is 140 . The outflow has reached out to 200 pc (corrected for opening angle and inclination) which, for =140 gives = yrs. The molecular mass in the outflow is M⊙ (see Sect. 3.1.3). Thus, the molecular mass loss rate = 8 – 38 M⊙ yr-1.
We do not know the escape velocity of NGC 1377 hence it is not possible to know whether the gas will leave the system as a whole, or just the nuclear region of NGC 1377. Martin (2005) sets a limit for the escape velocity as =3 and if the rotational velocity is 75 then the gas will not escape NGC 1377.
An inspection of the central spectrum reveals that broad features are present in the very centre as well suggesting that the gas is accelerated close to the nucleus (see lower right panel of Fig. 4). Compared to outflows in M 82 and NGC 253 it appears that the acceleration to the final velocity happens on a short length scale - smaller than 30 pc.
| Outflow | |
|---|---|
| Molecular mass: | M⊙ |
| Extent: | 200 pc |
| Orientation: | PA=35∘ – 45∘ |
| Opening angle: | 60∘ – 70∘ |
| Age: | yrs. |
| Outflow velocity: | 140 |
| : | 8 – 38 M⊙ yr-1. |
| Energy: | ergs |
| Power: | ergs s-1 |
| Nuclear disk | |
| Diameter: | (60 pc) |
| Orientation: | PA=110∘–130∘ |
| Rotational velocity: | 75 |
| Dynamical mass: | M⊙ |
| Molecular mass: | M⊙ |
| H2 column density: | |
| H2 surface density: | M⊙ pc-2 |
3.2 Energy and power of the outflow
We use the prescription by Veilleux et al. (2001) to calculate the kinetic energy in the outflow: . This kinetic energy represents a lower limit to the energy. The work of lifting the gas out of the nucleus should be included but since we do not know the actual gravitational potential depth of the galaxy this term cannot be added at this stage. If we assume that the molecular gas in the outflow is moving at constant speed =140 we obtain == ergs - when adopting the lower limit to . We can however only measure an upper limit to the turbulence of the gas of =25 (due to effects of spatial resolution, rotation and the outflow) and since this term is already smaller than the contribution from the bulk motion we do not include it and in total we estimate to ergs. For the upper limit to we get ergs. The power in the outflow is ergs s-1 which corresponds to a luminosity of L⊙. The ratio between the wind luminosity and the FIR luminosity is then . From now on we adopt the more conservative lower value of the luminosity and mass outflow rate.
3.3 What is driving the outflow?
The unusual and obscured nature of NGC 1377 makes it difficult to find an obvious source of the molecular outflow. Is it a buried AGN or a young starburst? Below we investigate some possible scenarios.
3.3.1 Winds from supernovae and massive stars
The limit on (1.4 GHz) is W Hz-1 (Roussel et al. 2003). This corresponds to an upper limit to the SNR of yr-1 (Condon 1992). Inserting this limit into equations 10 and 34 in Murray et al. (2005) we find that SNR fall short by an order of magnitude to drive the outflow - by momentum or energy. The lack of radio continuum from SNR is consistent with the nondetection of NIR [Fe II] emission by Roussel et al. (2006). However, an outflow may also be driven by the wind-momentum of massive stars. The total momentum in the NGC 1377 outflow is M⊙ . Using Starburst99 (Leitherer et al. 1999) we find that a M⊙ cluster with SFR of 1/3 M⊙ yr-1 has a wind momentum of M⊙ when integrated over 3 Myrs. Thus an SFR of 30 M⊙ yr-1 would be required. From the FIR luminosity we estimate a SFR of 0.4 M⊙ yr-1 for NGC 1377 (assuming that all of the FIR is due to star formation) and Roussel et al. (2003) estimate a rate of 1.8 M⊙ yr-1. Thus it appears that the SFR is too low by about one order of magnitude to push out the molecular gas by the wind momentum of massive stars.
Could the outflow be driven by internal ram pressure from hot gas? Only upper limits to the thermal free-free emission in the radio has been obtained. In Fig. 8 of Roussel et al. (2003) predictions of the radio synchrotron and free-free emission based on the IR are plotted. For NGC 1377 the VLA 1.4 GHz upper limit is about a factor of 4-5 below the expected value. There is thus no direct evidence of much hot ionized gas. Both the H and [N II] optical emission lines are weak and Br and Pa are undetected (Roussel et al. 2003, 2006). This may be an effect of the high extinction so to complete the picture of the hot gas of NGC 1377, X-ray observations will be essential.
Note also that the symmetry of the wind is inconsistent with the idea of external ram pressure driving the wind, as is the presence of NGC 1377 in a low density galaxy group where ram pressure forces are expected to be low.
3.3.2 Radiation pressure
Murray et al. (2005) suggest that radiation pressure (from both star formation and AGNs) from the continuum absorption and scattering of photons on dust grains may be an efficient mechanism for driving cold, dusty gas out of a galaxy. The lack of evidence for supernovae and the presence of a dusty, compact IR source makes this an attractive scenario for NGC 1377. Murray et al. (2005) suggest that for a radiative pressure driven outflow the momentum flux should be comparable to that in the radiation field . For NGC 1377 the outflow momentum flux exceeds by factors of a few which is within the uncertainties for outflow structure, velocity and mass. We suggest that, with current information, radiation pressure is a potential driving mechanism for the outflowing gas in NGC 1377, but the fit is far from perfect and other processes cannot be excluded.
3.3.3 AGN or starburst?
We use the Graham et al. (2011) (their Figs. 2 - 4 and Tab. 2) calibration of the stellar velocity dispersion and BH mass to estimate the mass of a supermassive black hole (SMBH) in NGC 1377. Wegner et al. (2003) list a value of the stellar velocity dispersion of =83 for NGC 1377 in their online database. This gives a SMBH mass in the range of about M⊙ with a most likely value of about M⊙. If all the FIR emission observed would be due to accretion onto the SMBH it would then operate at 10% of its Eddington limit. A small acceleration region is consistent with a compact source of energy and momentum. Radiation pressure acceleration minimizes hard shocks which results in low radio emission and acts on dense gas, consistent with the IR H2 emission and the suggested 12CO 2–1 molecular outflow. It is also easier to bury a compact energy source behind the gas and dust, giving rise to the deep silicate absorption. Strong FIR emission lines from ionized gas in an AGN are expected to be highly localized around the SMBH, and thus are easier to hide.
In contrast, a dust-enshrouded nuclear starburst needs to be located well inside a radius of 29 pc (to launch the outflow). The current molecular mass here is estimated to M⊙, 40% of the dynamical mass. Roussel et al. (2006) suggest a starburst with a mass M⊙ assuming an age of 1 Myr, a Salpeter IMF between 0.1 and 120 M⊙ and O-stars to produce the bolometric luminosity of NGC 1377. The star formation efficiency (SFE) of the starburst then had to be at least 50% and all of its Pa, and Br emission has to be absorbed. This implies that the stars must be deeply buried inside the nuclear dust cloud putting even stricter limits on their radial distribution. In addition, the starburst scenario requires that almost all of the stellar mass in the center of NGC 1377 has to be very young.
3.4 Comparing with other molecular outflows
Outflowing molecular gas has been detected towards several galaxies of various luminosities. In some cases the existence of an outflow has been inferred from 12CO line wings - such as for the LIRG NGC 3256 (Sakamoto et al. 2006). In some cases, the molecular outflow was discovered in already iconic optical outflows, such as is the case for M 82 (Nakai et al. 1987; Walter et al. 2002). There is also mounting evidence of massive, outflows in AGN/starburst driven ULIRGs (e.g. Sakamoto et al. 2009; Feruglio et al. 2010; Chung et al. 2011; Sturm et al. 2011; Aalto et al. 2012).
NGC 1377 can also be compared to the AGN-driven molecular outflow of the S0 galaxy NGC 1266 (Alatalo et al. 2011). Nuclear gas depletion time scales are similar to those estimated for NGC 1377, and both galaxies have compact, pc nuclear disks confining the outflowing wind. NGC 1266 is more FIR luminous than NGC 1377 with an order of magnitude more molecular gas and its molecular disk has a factor of five greater gas surface density. Also, NGC 1266 is not radio deficient (=2.3) unlike NGC 1377. Estimating the power of a radio jet from the total radio flux, Alatalo et al. (2011) attributed the molecular outflow to the mechanical work of the radio jet of the AGN (see also Matsushita et al. (2007) for a similar case).
What sets NGC 1377 apart is its unusual IR properties and extreme suggesting that the nuclear activity is in a transient phase of its evolution or that NGC 1377 is exceptional in some other aspect. This is illustrated by the fact that observationally the parameter is in a strikingly small range in large statistical samples of galaxies. In particular, the upper-bound of q is very clear and is really exceptional (see for example Fig. 6 of Yun et al. (2001).
Comparing the energy and mechanical luminosity of the NGC 1377 outflow to one AGN-driven (NGC 1266) and one starburst driven (NGC 3256) outflow we find them to be similar (within factor of a few). The ratio between the wind luminosity and the FIR luminosity , however, for NGC 1377 is similar to, or higher, than that of NGC 1266, and at least one order of magnitude higher than that of the starburst driven outflow of NGC 3256. More studies will show if this difference is related to the underlying driving mechanism. The is calculated only on the molecular flows in all three galaxies.
3.5 Nuclear gas properties
3.5.1 Is there a Compton-thick nuclear dust and gas cloud?
For NGC 1377 to hide its power source also at X-ray wavelengths large columns of absorbing material has to reside in front of the nucleus. We estimate the average (H2) in the inner =29 pc of NGC 1377 to be . (This corresponds to an of 290 (for () = (Güver & Özel 2009).) For an absorber to be Compton-thick an (450) is required. Thus, a Compton-thick absorber, if any, should therefore be smaller than our beam. If the 12CO luminosity of our 12CO 2–1 beam is located in a region with a radius 17 pc the resulting would be .
3.5.2 Gas physical conditions
We find a peak 12CO 2–1 temperature of 19 K in a 58 pc beam which serves as a strict lower limit to the gas kinetic temperature in this region. The dust temperature is difficult to determine but a fit to the 25–100 m data results in a black body temperature of 80 K with a diameter of 37 pc (Roussel et al. 2003). Comparing our 1 mm continuum flux to the FIR SED suggests it is consistent with a slope - either implying =1 - or that the dust is already opaque at =100 m. This possibility, if confirmed, would be consistent with the dusty opaque core suggested from the deep silicate absorption. There is no evidence of an excess of 1 mm flux emerging from cold (10-20 K) dust.
We can consider three simple scenarios for the physical conditions of the nuclear molecular gas:
-
1.
The molecular gas is cold and optically thick. The 12CO 2–1 emission is optically thick, fills the central beam and its brightness temperature traces the kinetic temperature of the gas at 29 pc radius from the nucleus. This requires a very steep, radial temperature gradient to allow for the buried warm dust.
-
2.
The molecular gas is optically thin In this scenario, the 12CO 2–1 brightness temperature does not reflect the kinetic temperature of the gas even if it fills the central beam and will instead be . Given the large columns of absorbing gas and dust this scenario seems unlikely.
-
3.
The molecular gas is warm and optically thick A molecular medium of warm gas clumps that only fills a fraction of the beam. Alternatively, the 12CO peak is unresolved in the beam. If we assume that the emission is emerging from the same region as the inferred dust diameter (of 37 pc) the peak 12CO surface brightness temperature would be 50 K.
The above scenarios assume a single-component ensemble of clouds. A more realistic view on the nuclear molecular ISM is that it likely consists of both dense ( ) gas clumps embedded in a lower density ( ) molecular medium (see discussion in (e.g. Aalto et al. 1994)). The 12CO 2–1 brightness will then reflect the relative filling factor of the low- and high density gas. The detection of bright HCN 1–0 emission (Imanishi et al. 2009) towards the inner 2″of NGC 1377 suggests gas densities (unless the HCN is IR pumped).
Is the molecular gas concentration forming stars? From the Kennicutt-Schmidt (KS) relation (Kennicutt 1998) the expected SFR from the nuclear gas concentration is 0.1M⊙ yr-1. This falls short by factors of 4 – 18 to explain the inferred SFR if all FIR emission is emerging from star formation. However, the KS relation at 100 pc may should have a large scatter since star formation is unlikely to be a steady-state process on such small scales. (e.g. Onodera et al. 2010). There should be some star formation going on even if it is difficult to infer the actual SFR.
3.6 The evolutionary implications for NGC 1377
3.6.1 Origin of the molecular gas
Just as is the case for NGC 1266 (Alatalo et al. 2011), one question for NGC 1377 is how the gas got to the very center of the galaxy so efficiently. So far, no clear evidence of an interaction has been presented. The range of possible PAs of the nuclear disk includes a difference by about 40∘compared to the stellar disk of NGC 1377. An inclination difference between the gas and stellar disks would indeed suggest an external source for the gas (Davis et al. 2011). It is interesting that the evidence so far suggests that most of the gas has ended up in molecular form. If NGC 1377 accreted a late type dwarf galaxy or gas from the outer regions of a large disk galaxy, the gas is more likely to be atomic. Somehow the gas must have become shocked and compressed along the way. However, the lack of 1.4 GHz radio continuum emission makes it difficult to assess the amount of cold atomic hydrogen in the center of NGC 1377 - which normally could be tested by searching for absorption in the 21 cm HI line.
The gas concentration may instead be the result of slow, secular evolution such as accretion along a bar (e.g. Jogee et al. 2005), very slow external accretion (galaxy harassment), or stellar return (e.g. Welch & Sage 2003). All of these - or combinations of them - are possible scenarios, but the problem remains of getting such a concentration of molecular gas to the core of NGC 1377.
3.6.2 The nuclear activity
Observing the molecular properties of NGC 1377 allow us to probe the early stages of nuclear activity and feedback mechanisms in active galaxies. Depending on what is driving the FIR emission and outflow of NGC 1377 we are either witnessing the growth and feeding of a black hole in an early type galaxy - a process fueled by the late influx of molecular gas. Alternatively, the gas fuels the early triggering phase of a nuclear starburst increasing the stellar mass instead of the central black hole.
Another important key to the evolutionary stage and nature of the activity is the age of the outflow. If the SMA data recovers the full extent of the outflow, then this sets an upper limit to its age of 1.4 Myrs. High sensitivity observations of 12CO 1–0 as well as deep imaging of dust absorption features, H and a search for HI will help determine if the outflow extends beyond the 12CO 2–1 emission. Such evidence would further constrain the age of a buried power source. An implicit assumption here is that this activity is a one-time event (i.e., not recurrent in a short time scale). The ongoing, mass outflow rate would clear the central region of gas within the short time period of 5 – 25 Myrs. The growth of the SMBH and/or nuclear star formation will cease within this time period. However, if the gas is unable to escape the galaxy we might be observing a failed wind (e.g. Dorodnitsyn et al. 2011) . The gas may then fall back onto the galaxy again where the returned gas serves as a reservoir for future activity. Further studies will address this possible evolutionary scenario.
4 Conclusions
We have imaged 12CO and 13CO 2–1 in the FIR-excess galaxy NGC 1377 with the SMA:
-
1.
We find bright, complex 12CO 2–1 line emission from the nuclear region of the FIR-excess S0 galaxy NGC 1377 the structure of which is reminiscent of a disk-outflow system. The 12CO 2–1 line wings, the spatial orientation of the wing-emission with respect to the line-center emission, its correspondence with the optical dust features and the X-shape of the integrated intensity and dispersion maps support this interpretation. Estimated outflow parameters are: (H2) M⊙; 8 M⊙ yr-1; 140 ; extent200 pc; opening angle=; PA and an age of 1.4 yrs.
-
2.
We suggest that the age of the outflow supports the notion that the nuclear activity is young - a few Myrs. The dusty center of NGC 1377, the lack of significant numbers of recent supernovae, or of a dominant hot wind, may imply that the outflow is driven by radiation pressure from a compact, dust enshrouded nuclear source. However, other driving mechanisms are possible. Accretion onto a M⊙ SMBH - i.e. a buried AGN - is a possible power source. Alternatively, the photons may emerge from a very young (1 Myr), pre-supernova starburst, but we find this explanation less likely due to the extreme requirements of compactness and youth of the source. The implied mass outflow rate is large enough that it will clear the nuclear region of gas within 5–25 Myrs and will, at least temporarily, shut off the nuclear activity and growth. If the outflowing gas rains back onto the galaxy, however, it may serve as fuel for a future period of nuclear activity and/or star formation.
-
3.
Molecular masses are estimated through the adoption of a standard 12CO to H2 conversion factor - with all the implied uncertainties. In the whole 12CO 2–1 map we detect M(H2)= M⊙ and in the inner =29 pc M(H2) is estimated to M⊙ with an H2 column density of (H2) . This is not large enough for the core to be Compton thick and a Compton-thick absorber, if any, should therefore be smaller than our beam. The average gas surface density within =29 pc is = M⊙ pc-2.
-
4.
The 12CO 2–1 brightness temperature sets a lower limit to the nuclear gas kinetic temperature of 19 K, but if cloud filling factors are less then unity then gas temperatures will be significantly higher.
Acknowledgements.
The Submillimeter Array is a joint project between the Smithsonian Astrophysical Observatory and the Academia Sinica Institute of Astronomy and Astrophysics and is funded by the Smithsonian Institution and the Academia Sinica. JSG thanks the U.S. National Science Foundation for partial support of this work through NSF grant AST-0708967 to the University of Wisconsin-Madison. SA thanks the Swedish Research Council for support (grant 621-2011-4143). KS is supported by the Taiwan NSC grant 99-2112-M-001-011-MY3. SM acknowledge the co-funding of this work under the Marie Curie Actions of the European Commission (FP7-COFUND).References
- Aalto et al. (1994) Aalto, S., Booth, R. S., Black, J. H., Koribalski, B., & Wielebinski, R. 1994, A&A, 286, 365
- Aalto et al. (2012) Aalto, S., Garcia-Burillo, S., Muller, S., et al. 2012, A&A, 537, A44
- Alatalo et al. (2011) Alatalo, K., Blitz, L., Young, L. M., et al. 2011, ApJ, 735, 88
- Chung et al. (2011) Chung, A., Yun, M. S., Naraynan, G., Heyer, M., & Erickson, N. R. 2011, ApJ, 732, L15+
- Condon (1992) Condon, J. J. 1992, ARA&A, 30, 575
- Davis et al. (2011) Davis, T. A., Alatalo, K., Sarzi, M., et al. 2011, MNRAS, 417, 882
- de Vaucouleurs et al. (1991) de Vaucouleurs, G., de Vaucouleurs, A., Corwin, Jr., H. G., et al. 1991, Third Reference Catalogue of Bright Galaxies, ed. de Vaucouleurs, G., de Vaucouleurs, A., Corwin, H. G., Jr., Buta, R. J., Paturel, G., & Fouque, P.
- Dorodnitsyn et al. (2011) Dorodnitsyn, A., Bisnovatyi-Kogan, G. S., & Kallman, T. 2011, ApJ, 741, 29
- Feruglio et al. (2010) Feruglio, C., Maiolino, R., Piconcelli, E., et al. 2010, A&A, 518, L155+
- Graham et al. (2011) Graham, A. W., Onken, C. A., Athanassoula, E., & Combes, F. 2011, MNRAS, 412, 2211
- Güver & Özel (2009) Güver, T. & Özel, F. 2009, MNRAS, 400, 2050
- Heisler & Vader (1994) Heisler, C. A. & Vader, J. P. 1994, AJ, 107, 35
- Helou et al. (1985) Helou, G., Soifer, B. T., & Rowan-Robinson, M. 1985, ApJ, 298, L7
- Imanishi (2006) Imanishi, M. 2006, AJ, 131, 2406
- Imanishi et al. (2009) Imanishi, M., Nakanishi, K., Tamura, Y., & Peng, C. 2009, AJ, 137, 3581
- Jogee et al. (2005) Jogee, S., Scoville, N., & Kenney, J. D. P. 2005, ApJ, 630, 837
- Kennicutt (1998) Kennicutt, Jr., R. C. 1998, ApJ, 498, 541
- Krips et al. (2008) Krips, M., Neri, R., García-Burillo, S., et al. 2008, ApJ, 677, 262
- Laureijs et al. (2000) Laureijs, R. J., Watson, D., Metcalfe, L., et al. 2000, A&A, 359, 900
- Leitherer et al. (1999) Leitherer, C., Schaerer, D., Goldader, J. D., et al. 1999, ApJS, 123, 3
- Martin (2005) Martin, C. L. 2005, ApJ, 621, 227
- Matsushita et al. (2007) Matsushita, S., Muller, S., & Lim, J. 2007, A&A, 468, L49
- Murray et al. (2005) Murray, N., Quataert, E., & Thompson, T. A. 2005, ApJ, 618, 569
- Nakai et al. (1987) Nakai, N., Hayashi, M., Handa, T., et al. 1987, PASJ, 39, 685
- Narayanan et al. (2012) Narayanan, D., Krumholz, M. R., Ostriker, E. C., & Hernquist, L. 2012, MNRAS, 2537
- Onodera et al. (2010) Onodera, S., Kuno, N., Tosaki, T., et al. 2010, ApJ, 722, L127
- Paglione et al. (2001) Paglione, T. A. D., Wall, W. F., Young, J. S., et al. 2001, ApJS, 135, 183
- Roussel et al. (2003) Roussel, H., Helou, G., Beck, R., et al. 2003, ApJ, 593, 733
- Roussel et al. (2006) Roussel, H., Helou, G., Smith, J. D., et al. 2006, ApJ, 646, 841
- Sakamoto et al. (2009) Sakamoto, K., Aalto, S., Wilner, D. J., et al. 2009, ApJ, 700, L104
- Sakamoto et al. (2006) Sakamoto, K., Ho, P. T. P., & Peck, A. B. 2006, ApJ, 644, 862
- Spoon et al. (2007) Spoon, H. W. W., Marshall, J. A., Houck, J. R., et al. 2007, ApJ, 654, L49
- Sturm et al. (2011) Sturm, E., González-Alfonso, E., Veilleux, S., et al. 2011, ApJ, 733, L16+
- Tenorio-Tagle & Munoz-Tunon (1998) Tenorio-Tagle, G. & Munoz-Tunon, C. 1998, MNRAS, 293, 299
- Veilleux et al. (2001) Veilleux, S., Shopbell, P. L., & Miller, S. T. 2001, AJ, 121, 198
- Wada & Tomisaka (2005) Wada, K. & Tomisaka, K. 2005, ApJ, 619, 93
- Walter et al. (2002) Walter, F., Weiss, A., & Scoville, N. 2002, ApJ, 580, L21
- Wegner et al. (2003) Wegner, G., Bernardi, M., Willmer, C. N. A., et al. 2003, AJ, 126, 2268
- Welch & Sage (2003) Welch, G. A. & Sage, L. J. 2003, ApJ, 584, 260
- Yun et al. (2001) Yun, M. S., Reddy, N. A., & Condon, J. J. 2001, ApJ, 554, 803