Supernova remnants and candidates detected in the XMM-Newton M 31 large survey††thanks: Based on observations obtained with XMM-Newton, an ESA science mission with instruments and contributions directly funded by ESA Member States and NASA.
Abstract
Context. We present the analysis of supernova remnants (SNRs) and candidates in M 31 identified in the XMM-Newton large programme survey of M 31. SNRs are among the bright X-ray sources in a galaxy. They are good indicators of recent star formation activities of a galaxy and of the interstellar environment in which they evolve.
Aims. By combining the X-ray data of sources in M 31 with optical data as well as with optical and radio catalogues, we aim to compile a complete, revised list of SNRs emitting X-rays in M 31 detected with XMM-Newton, study their luminosity and spatial distribution, and understand the X-ray spectrum of the brightest SNRs.
Methods. We analysed the X-ray spectra of the twelve brightest SNRs and candidates using XMM-Newton data. The four brightest sources allowed us to perform a more detailed spectral analysis and the comparison of different models to describe their spectrum. For all M 31 large programme sources we searched for optical counterparts on the H, [S ii], and [O iii] images of the Local Group Galaxy Survey.
Results. We confirm 21 X-ray sources as counterparts of known SNRs. In addition, we identify five new X-ray sources as X-ray and optically emitting SNRs. Seventeen sources are no longer considered as SNR candidates. We have thus created a list of 26 X-ray SNRs and 20 candidates in M 31 based on their X-ray, optical, and radio emission, which is the most recent complete list of X-ray SNRs in M 31. The brightest SNRs have X-ray luminosities of up to erg s-1 in the 0.35 – 2.0 keV band.
Key Words.:
ISM: supernova remnants – Galaxies: ISM – Galaxies: M 31 – X-rays: galaxies – X-rays: ISM1 Introduction
The Andromeda galaxy (M 31) is the largest galaxy in the Local Group and the nearest spiral galaxy to the Milky Way. Its size and mass are comparable to those of our Galaxy. Therefore, this archetypical spiral galaxy provides us a unique opportunity to study and understand the nature and the evolution of a galaxy like our own. Various authors have studied the star formation history in different regions of M 31 using observations with both the Hubble Space Telescope (HST) and large ground-based telescopes (e.g., the Local Group Galaxy Survey [LGGS] performed at the Kitt Peak National Observatory [KPNO] and the Cerro Tololo Inter-American Observatory, Williams 2003; Massey et al. 2006). Deep HST photometry has shown that the mean age of the disk of M 31 is Gyr (Brown et al. 2006) and that the average metallicity is [Fe/H] –0.6 dex (Bellazzini et al. 2003). Williams (2003) measured a mean star formation rate of about 1 yr-1 in the full disk of M 31. Tabatabaei & Berkhuijsen (2010) have recently studied the dust distribution and computed the de-reddened H distribution in the disk of M 31. They derived a star formation rate of 0.27 yr-1 for the radial range of kpc with an increase to about twice the mean value at around kpc. Although the current star formation rate in M 31 is lower than that of the Milky Way, M 31 seems to have undergone more active star formation periods. In addition to the well-known dust ring at a radius of 10 kpc (Brinks & Shane 1984; Dame et al. 1993) with enhanced star formation, Block et al. (2006) found an inner dust ring with a radius of 1 – 1.5 kpc, which has apparently been created in an encounter with a companion galaxy, most likely with M 32.
First observations of individual sources in M 31 in X-rays were performed with the Einstein Observatory (Giacconi et al. 1979) in the energy band of 0.2 – 4.5 keV and yielded the first catalogues of X-ray sources in the field of M 31 (van Speybroeck et al. 1979; Trinchieri & Fabbiano 1991). In the 1990s, ROSAT (Trümper 1982) observed M 31 in the 0.1 – 2.4 keV band and revealed a total of 560 sources in the field of M 31 (Supper et al. 1997, hereafter SHP97; Supper et al. 2001, hereafter SHL01). The next generation X-ray satellites Chandra X-ray Observatory (Weisskopf et al. 2002) and X-ray Multi-Mirror Mission (XMM-Newton, Jansen et al. 2001), which were both launched in 1999, have significantly improved spatial and spectral resolutions with respect to the prior X-ray telescopes. They have also performed several observations of M 31 and allowed both to obtain a comprehensive list of X-ray sources and to study individual sources (e.g., Osborne et al. 2001; Kong et al. 2002b; Kaaret 2002; Pietsch et al. 2005; Stiele et al. 2008; Barnard et al. 2008). The entire galaxy M 31 was observed by XMM-Newton in a large programme (LP) between June 2006 and February 2008 with the European Photon Imaging Cameras (EPICs, Strüder et al. 2001; Turner et al. 2001) as prime instruments. The XMM-Newton source catalogue with 1897 sources has been published by Stiele et al. (2011, hereafter SPH11).
Supernova remnants are the aftermath of stellar explosions releasing a large amount of energy in galaxies. The spherically expanding blast wave shock produces a cavity in the interstellar medium with a very low-density, high-temperature interior, which predominantly emits soft X-ray radiation. In addition, relativistic electrons and heavier particles in SNRs emit synchrotron emission which can be detected in radio and in some cases also in X-rays. After a few thousand years, the SNR becomes radiative, i.e., the radiative losses in SNR shocks expanding into the ambient ISM become non-negligible and the shell emits energy as UV and optical line emission. If a neutron star is created in the supernova explosion a pulsar and/or a pulsar wind nebula (PWN) can be found inside the SNR, in which particles are accelerated in the strong magnetic field of the neutron star and thus non-thermal emission is produced. SNRs in M 31 were mainly detected in the optical (e.g., D’Odorico et al. 1980; Dennefeld & Kunth 1981; Blair et al. 1981) and in combined optical and radio studies (Braun & Walterbos 1993). The X-ray survey performed with ROSAT led to the detection of 16 X-ray SNRs (Supper et al. 2001), while 21 were detected and identified with XMM-Newton (Pietsch et al. 2005). Kong et al. (2002a) presented the first resolved X-ray image of an SNR in M 31 taken with Chandra, while Kong et al. (2003) and Williams et al. (2004b) reported on the discovery of new SNRs in M 31 based on Chandra data.
In this paper, we present the study of all X-ray sources that have been suggested to be SNRs or candidates of SNRs in M 31 based on a complete survey of M 31 performed within the framework of the LP of XMM-Newton (SPH11). Through a detailed study of each SNR and candidate detected by XMM-Newton, we have obtained an improved sample of SNRs in M 31 consisting of X-ray or optically confirmed SNRs as well as bona-fide candidates. We have performed a spectral analysis of the bright SNRs and candidates in the catalogue of SPH11. Using optical data of the LGGS, we have searched for optical counterparts of the X-ray SNRs and candidates showing optical H, [S ii], and [O iii] emission from the radiative shock. We newly calibrated the LGGS data to obtain optical fluxes and computed the [S ii]/H flux ratio, which is an indicator of SNR emission in the optical. This study has also allowed us to identify sources that are most probably no SNRs. In addition, we have performed statistical studies using the revised list of SNRs and candidates in M 31 detected with XMM-Newton.
2 Data
2.1 X-ray data
| [SPH11] | RA (2000.0) | Dec (2000.0) | Pos. error | Rate | a𝑎aa𝑎aDetection likelihood. | b𝑏bb𝑏bHardness ratios. | b𝑏bb𝑏bHardness ratios. | b𝑏bb𝑏bHardness ratios. | b𝑏bb𝑏bHardness ratios. |
|---|---|---|---|---|---|---|---|---|---|
| ID | [arcsec] | [cts/s] | |||||||
| Additional SNR candidates | |||||||||
| 811 | 00 42 10.60 | +40 51 49.1 | 6.19 | 3.0e–31.0e–4 | 8.3 | –0.460.46 | 0.480.46 | –0.830.36 | |
| 833 | 00 42 14.60 | +40 52 04.7 | 4.30 | 3.2e–35.0e–5 | 26 | 0.730.17 | –0.090.17 | –0.840.23 | |
| c𝑐cc𝑐cClassified as a hard source by SPH11.1121 | 00 43 03.70 | +41 37 17.2 | 4.47 | 5.4e–31.0e–4 | 17 | 0.450.24 | 0.140.19 | –0.230.36 | |
| 1286 | 00 43 42.08 | +41 47 09.5 | 7.42 | 2.2e–35.0e–5 | 8.6 | 0.740.27 | –0.380.23 | –0.850.46 | |
| d𝑑dd𝑑dClassified as a foreground star candidate by SPH11.1461 | 00 44 28.62 | +41 49 48.7 | 7.00 | 2.7e–37.0e–5 | 8.7 | 0.630.33 | –0.580.29 | ||
| c𝑐cc𝑐cClassified as a hard source by SPH11.1468 | 00 44 30.56 | +41 23 06.2 | 4.84 | 4.0e–36.0e–5 | 38 | 0.820.16 | 0.160.17 | –0.660.30 | |
| c𝑐cc𝑐cClassified as a hard source by SPH11.1611 | 00 45 18.44 | +41 39 36.3 | 3.42 | 7.5e–38.0e–5 | 94 | 0.850.17 | 0.290.11 | –0.130.14 | |
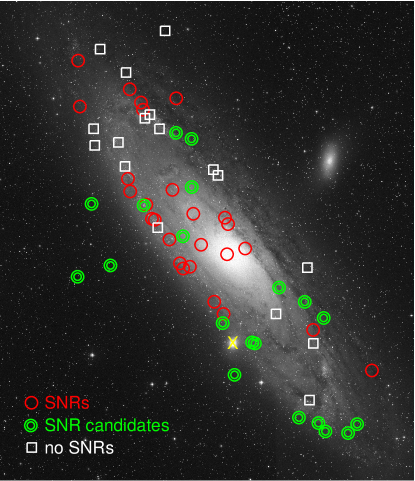
XMM-Newton performed a survey of M 31 as a large programme between June 2006 and February 2008. The analysis of the entire data of this survey including additional archival data taken between June 2000 and July 2004 is presented by SPH11. These observations in total covered the entire ellipse of M 31 down to a limiting luminosity of erg s-1 in the 0.2 – 4.5 keV band. A total of 1897 sources were detected in the XMM-Newton survey data (SPH11). The sources were identified or classified based on their X-ray hardness ratios, spatial extent, and variability as well as through cross-correlation with catalogues in the X-ray, optical, infrared, and radio wavelengths. In the end, 25 sources were identified by SPH11 as known SNRs and 31 additional sources were classified as SNR candidates based on their X-ray properties. Their positions are shown on a Digitised Sky Survey (DSS) 2 blue image in Fig. 1. While the main objective of the work by SPH11 was to create a source catalogue of all XMM-Newton detections in the field of M 31, we are interested in one particular class of objects, namely SNRs, which are soft and intrinsically extended sources. Therefore, we reprocessed and analysed the data using XMMSAS version 10.0.0 to obtain data products, which are best suited for the study of SNRs. We created mosaic images of data taken from all observations between 2006 and 2010 in the bands 0.2 – 1.0 keV, 1.0 – 2.0 keV, and 2.0 – 4.5 keV. The images are binned with 2″ 2″ pixel size and smoothed with a Gaussian with a width of 10″. The three colour images created with the three bands zoomed in on each source are shown in Figs. 2, 3, and Appendix A.
See fig2.jpg.
See fig3.jpg.
The X-ray energy bands used for the detection and calculation of hardness ratios by SPH11 are = 0.2 – 0.5 keV, = 0.5 – 1.0 keV, = 1.0 – 2.0 keV, = 2.0 – 4.5 keV, and = 4.5 – 12 keV. The hardness ratios and errors are defined as and , . and are the count rates and errors in the energy band . Table 7 lists the SNRs and candidates classified by SPH11 along with their positions, count rates, detection likelihoods, and hardness ratios. If a hardness ratio , , , or is not given in Table 7, it was not calculated due to poor photon statistics in the corresponding bands. The sources in Table 1 were not classified as SNR candidates by SPH11. However, the study of optical data while planning follow-up observations of the XMM-Newton LP survey of M 31 revealed shell-like optical emission line sources at the X-ray positions indicating that these sources might be SNRs. Therefore, we included these sources also in our work.
2.2 Optical data
M 31 was observed during the Local Group Galaxy Survey, which was carried out with the 4 m telescope at KPNO (Massey et al. 2006). Continuum images as well as narrow band H, [S ii], and [O iii] images are available for 10 fields, which in total cover the entire galaxy. Each field covers 35′ 35′ and the median seeing of the observations was 1″. Bias-corrected and flat-fielded images can be downloaded from the LGGS web site222http://www.lowell.edu/users/massey/lgsurvey.html. For the emission line images the photometric uncertainty is 5% according to the LGGS web page. We subtracted scaled band continuum images from the H and [S ii] images and scaled band continuum images from the [O iii] images.
Figures 2 and Appendix A show continuum subtracted LGGS H, [S ii], [O iii] images, and [S ii]/H ratio image with the XMM-Newton 3 positional error circle for each source, along with the XMM-Newton images described in Sect. 2.1. Four sources ([SPH11] 1437, 1669, 1748, and 1796) are located outside the regions covered by LGGS. The XMM-Newton three colour images of these sources are shown in Fig. 3. We used image data from the Data Release 8 of the Sloan Digital Sky Survey (SDSS) III333http://www.sdss3.org/ in order to search for possible optical counterparts for these sources. The , , , and band images are shown in Figs. 4 and C. For all sources, we also checked the HST archive for optical images in order to search for possible counterparts. While for most sources the LGGS and SDSS images were sufficient to identify possible counterparts, in the case of [SPH11] 1505 the HST image revealed a background galaxy, which is not resolved on the LGGS images, and thus allowed its classification as a background source (see Sect. 4.3.7).
The SNRs and candidates are located in fields F2 to F9 of the LGGS survey. We first calibrated the images in fields F4, F5, and F6 based on the H, [S ii], and [O iii] fluxes of [SPH11] 883 (r2-57) and [SPH11] 1040 (r3-84) determined by Williams et al. (2004b), allowing us to calculate the flux in erg cm-2 s-1 from the count rates in the images. The publication of Williams et al. (2004b) also includes the H and [S ii] fluxes of [SPH11] 1234. The [O iii] flux for [SPH11] 1234 was obtained from the publication by Dennefeld & Kunth (1981). As the LGGS fields have a small overlap with the adjacent fields (e.g., F3 has an overlap with F2 and F4), we can, e.g., calibrate F3, if F4 is calibrated and there are sources which are observed both in F3 and F4. In addition, H and [S ii] fluxes of sources [SPH11] 1539 and 1599 could be obtained from Braun & Walterbos (1993). By using the fluxes of [SPH11] 1539 and 1599 in F4, which were observed in F2, F3, and F4, and comparing the values to their fluxes published by Braun & Walterbos (1993), we calibrated fields F2 and F3. For fields F7, F8, F9, we derived the count-rate-to-flux conversion factors by using other sources that were observed in many fields, starting with those observed in F6 and F7. For fields F8 and F9, however, we were not able to calibrate the [O iii] images as there were no sources with significant [O iii] emission observed both in F7 and F8. This flux calibration yields an uncertainty in the flux in the range of 3 – 20% in most of the fields, but up to 50% in some fields, in which there were only a few sources in overlapping areas.

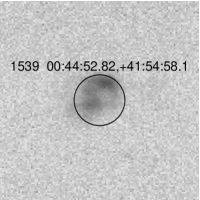
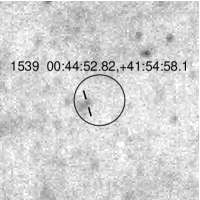
We compared our list of sources to the catalogue of emission line objects by Massey et al. (2007). We find seven common objects. In Figure 5 we plot the [S ii]/H flux ratios that we derived (see Sect. 3.2) over the values in the Massey et al. (2007) catalogue. Except for one outlier, the correlation is very good with a coefficient of 1.0020.374 and an intercept of 0.0980.235 (Fig. 5). The outlier corresponds to LGGS J004452.98+415457.7, which is the point source visible on the band image inside the positional error circle of the XMM-Newton source [SPH11] 1539 (Fig. 6, right). The H and [S ii] fluxes of the optical source associated to [SPH11] 1539 (XMMM31 J004452.82+415458.1) was determined in a larger area covering the entire extended optical source (Fig. 6, left). This is most likely the reason for the discrepancy between our flux ratio and that in the catalogue by Massey et al. (2007) corresponding to the point source. In conclusion, the agreement between our flux ratios and the Massey et al. (2007) values for the small sample of common objects lends credibility to our calibration procedure.
We obtained new optical spectra for three sources, [SPH11] 811, 1156, and 1712, in follow-up observations of the XMM-Newton LP survey undertaken in the period of 2006 – 2011. The spectra were acquired with the 3.5 m telescope at the Apache Point Observatory, located in the Sacramento Mountains in Sunspot, New Mexico (USA) in order to identify the optical counterparts of the XMM-Newton sources. These optical spectra will be published in a separate paper (Hatzidimitriou, Williams et al., in prep.). In the present work we will only use the results for these three sources to discuss their nature (see Sect. 4.2.3, 4.3.5, and 4.3.11). The telescope was equipped with the Dual Imaging Spectrograph (DIS), a medium dispersion spectrograph with separate collimators for the red and blue part of the spectrum and two 2048 1028 E2V CCD cameras, with the transition wavelength at around 5350 Å.
3 Analysis
3.1 X-ray spectra
| [SPH11] | (TBABS2) | (APEC) | (APEC) | Red. | DOF | a𝑎aa𝑎aFor 0.35 – 2.0 keV. | ||
| ID | [ cm-2] | [keV] | [cm-5] | [erg s-1 cm-2] | ||||
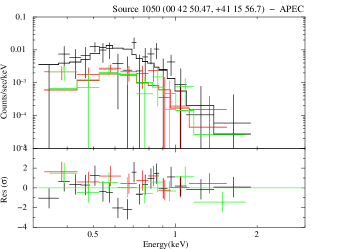
| 1050 | 1 (0 – 17) | 0.19 (0.04 – 0.25) | 2e–5 | 1.0 | 34 | 1.1e–14 | ||
| 1066 | 6 (4 – 7) | 0.18 (0.14 – 0.20) | 9e–4 | 3.2 | 29 | 3.2e–14 | ||
| 1234 | 0 (0 – 2) | 0.25 (0.05 – 0.27) | 4e–5 | 2.6 | 61 | 5.6e– 14 | ||
| [SPH11] | (TBABS2) | (NEI) | (NEI) | (NEI) | Red. | DOF | a𝑎aa𝑎aFor 0.35 – 2.0 keV. | |
| ID | [ cm-2] | [keV] | [ s cm-3] | [cm-5] | [erg s-1 cm-2] | |||
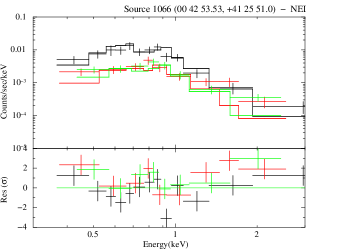
| 1066 | 3 (2 – 4) | 3.8 (2.8 – 4.2) | 0.6 (0.4 – 0.8) | 1e–5 | 2.3 | 26 | 3.5e–14 | |
| 1234 | 0 (0 – 1) | 2.2 (1.8 – 3.8) | 0.9 (0.8 – 1.2) | 4e–6 | 1.4 | 60 | 6.2e–14 | |
| [SPH11] | (TBABS2) | (APEC1) | (APEC1) | (APEC2) | (APEC2) | Red. | DOF | a𝑎aa𝑎aFor 0.35 – 2.0 keV. |
| ID | [ cm-2] | [keV] | [cm-5] | [keV] | [cm-5] | [erg s-1 cm-2] | ||
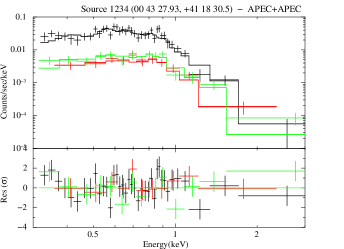
| 1234 | 4 (3 – 6) | 0.23 (0.18 – 0.25) | 2.8e–4 | 0.04 (0.02 – 0.05) | 3.9 | 1.1 | 59 | 6.4e–14 |
Out of the 63 sources in Tables 7 and 1, only twelve had enough counts to obtain spectra with good statistics. We extracted spectra for these sources and created corresponding ancillary response files and response matrix files.
We analysed spectra that yielded more than five bins with more than 20 counts per bin. The XMM-Newton EPIC spectra were all fitted in XSPEC with a model that included two absorption components (fixed TBABS1 for the column density in the Milky Way [MW] in the direction of M 31 of (MW) cm-2 [Stark et al. 1992] and a free parameter TBABS2 for additional absorption in M 31) and a thermal emission model. To begin with, we used the emission model APEC, which assumes collisional ionisation equilibrium (CIE). For most of the sources, for which we do not have high statistics to study the effect of non-equilibrium ionisation (NEI), this model gives us an average temperature of the hot plasma. The abundances were fixed to solar values (Anders & Grevesse 1989) in all fits. The spectra are all fitted relatively well with a low temperature of keV. The results for the fits using a single APEC model component are listed in the upper part of Table 2 for the brightest sources [SPH11] 1050, 1066, and 1234. For the faintest of the three, [SPH11] 1050, the APEC model reproduces the spectrum fairly well with reduced = 1.0 (Fig. 7, top). However, the fits yield no satisfactory results for the brighter sources. Therefore, we also modeled the spectra with a non-equilibrium ionisation model NEI or a combination of two APEC models instead of a single APEC model (see Table 2).
The brightest X-ray SNR in M 31 is [SPH11] 1234 (XMMM31 J004327.93+411830.5). The spectral analysis revealed that its spectrum consists of at least two thermal components with temperatures of keV and keV (Table 2 and Fig. 7, middle). It is an SNR first identified in the optical with a nice round shell clearly visible in H, [S ii], and [O iii] (see Sect. D.1.7). As can be seen in the H data, the remnant is located in an H ii region. The X-ray spectrum therefore seems to be the superposition of the hot gas inside an interstellar bubble and the emission of the SNR.
The second brightest source is [SPH11] 969 (XMMM31 J004239.82+404318.8), which has been suggested to be an SNR candidate based on its soft X-ray spectrum. The spectral analysis by SPH11 revealed that its spectrum is best modeled with a non-equilibrium plasma with a low temperature = 0.2 keV and a strikingly low ionisation timescale s cm yrs cm-3, implying a very low density of cm-3 if the SNR had an age of 10,000 yrs. The source is located at the outer rim of the optical disk of M 31 (green annulus south of M 32 in Fig. 1). Therefore, if this is an SNR it might have been expanding in a very low density medium. We tried to fit its spectrum with a model including a power-law component, which yields an unreasonably high index of = 6.0 (5.2 – 7.0). Higher statistics X-ray data are necessary to understand the emission of this source.
The third brightest source [SPH11] 1066 (XMMM31 J004253.53+412551.0) is an optically identified SNR and has a rather hard spectrum in X-rays with a high temperature and low ionisation timescale (see Table 2 and Fig. 7, bottom). This spectrum is consistent with a young SNR. The statistics are not high enough to verify if there is a non-thermal component.
3.2 Optical flux
| [SPH11] | H | [S ii] | [O iii] | [S ii]/H | (0.35 – 2.0 keV)a𝑎aa𝑎aSee Sect. 6.1. |
|---|---|---|---|---|---|
| ID | [erg cm-2 s-1 arcsec-2] | [erg cm-2 s-1 arcsec-2] | [erg cm-2 s-1 arcsec-2] | [erg s-1] | |
| Known SNRsb𝑏bb𝑏bSNRs known from literature. The optical fluxes and the flux ratios were determined from the LGGS data but were not used for the classification. | |||||
| 182 | 1.4e–142.9e–15 | 1.5e–147.5e–15 | N/A | 1.10.6 | 2.2e+35 |
| 474 | 2.5e–145.2e–15 | 2.6e–141.3e–14 | 2.3e–141.1e–14 | 1.00.5 | 6.9e+35 |
| 883 | 9.7e–155.7e–16 | 9.2e–151.9e–15 | 2.4e–162.7e–17 | 0.90.2 | 4.0e+35 |
| 1040 | 1.1e–146.5e–16 | 9.0e–151.9e–15 | 1.7e–141.9e–15 | 0.80.2 | 1.0e+36 |
| 1050 | 7.5e–154.4e–16 | 7.7e–151.5e–15 | 0.0 | 1.00.2 | 1.2e+36 |
| 1066 | 2.2e–141.3e–15 | 1.9e–143.9e–15 | 2.1e–142.3e–15 | 0.90.2 | 3.8e+36 |
| 1234 | 5.6e–143.3e–15 | 4.2e–148.7e–15 | 3.7e–144.1e–15 | 0.70.2 | 8.0e+36 |
| 1275 | 3.0e–141.7e–15 | 2.8e–145.8e–15 | 5.4e–146.0e–15 | 0.90.2 | 3.1e+36 |
| 1291 | 3.1e–171.9e–18 | 0.0 | 1.8e–172.0e–18 | 0.0 | 1.8e+36 |
| 1328 | 5.9e–153.4e–16 | 2.5e–155.1e–16 | 1.6e–141.8e–15 | 0.40.1 | 1.2e+36 |
| 1351 | 3.8e–142.2e–15 | 3.1e–146.4e–15 | 6.4e–147.2e–15 | 0.80.2 | 6.5e+35 |
| 1386 | 5.9e–143.4e–15 | 1.3e–142.7e–15 | 6.3e–157.1e–16 | 0.20.0 | 2.2e+35 |
| 1410 | 1.2e–146.8e–16 | 1.1e–142.3e–15 | 7.1e–158.0e–16 | 0.90.2 | 8.5e+35 |
| 1497 | 4.7e–142.7e–15 | 2.5e–145.2e–15 | 3.0e–143.4e–15 | 0.50.1 | 5.9e+35 |
| 1522 | 2.4e–141.4e–15 | 2.5e–145.1e–15 | 1.2e–141.3e–15 | 1.00.2 | 4.4e+35 |
| 1539 | 2.1e–146.4e–15 | 2.1e–144.3e–15 | 2.7e–158.2e–16 | 1.00.4 | 2.1e+35 |
| 1587 | 0.0 | 0.0 | 0.0 | 0.0 | 3.6e+35 |
| 1593 | 2.6e–147.9e–15 | 2.6e–145.4e–15 | 6.2e–141.9e–14 | 1.00.4 | 1.7e+35 |
| 1599 | 5.8e–143.4e–15 | 5.4e–141.1e–14 | 9.7e–142.9e–14 | 0.90.2 | 2.1e+36 |
| 1793 | 3.5e–161.1e–16 | 2.5e–165.2e–17 | 2.9e–168.8e–17 | 0.70.3 | 5.1e+35 |
| 1805 | 3.2e–179.7e–18 | 9.6e–172.0e–17 | 4.5e–161.3e–16 | 3.01.1 | 8.0e+35 |
| Newly confirmed SNRs based on optical and X-ray data | |||||
| 1079 | 3.9e–158.1e–16 | 3.4e–151.7e–15 | 1.4e–147.0e–15 | 0.90.4 | 5.5e+35 |
| 1148 | 2.3e–161.3e–17 | 1.8e–163.7e–17 | 1.7e–151.9e–16 | 0.80.2 | 2.9e+35 |
| 1370 | 8.2e–174.8e–18 | 6.9e–171.4e–17 | 2.6e–167.9e–17 | 0.80.2 | 3.0e+35 |
| 1481 | 7.6e–144.4e–15 | 6.3e–141.3e–14 | 3.7e–144.2e–15 | 0.80.2 | 4.6e+35 |
| 1548 | 2.1e–156.4e–16 | 2.3e–154.8e–16 | 1.5e–154.6e–16 | 1.10.4 | 2.1e+35 |
As mentioned earlier, except for four sources, the X-ray SNRs and candidates are located in regions covered by the LGGS data. For these sources, we determined the H, [S ii], and [O iii] fluxes and calculated the flux ratio [S ii]/H. The [S ii]/H flux ratio is a diagnostic tool to distinguish the shock-ionised diffuse emission of SNRs from those of photo-ionised H ii regions or planetary nebulae. The radiative shocks in SNRs produce a higher [S ii]/H ratio, typically higher than 0.5 (Braun & Walterbos 1993). Values around [S ii]/H = 0.4 – 0.5 might indicate an SNR nature, however, shells or filaments in H ii regions can also reach similar [S ii]/H ratios. Therefore, we apply the hard limit of [S ii]/H for SNRs. To measure the flux, we looked at the optical images for all sources, if available, one by one. If there is optical emission that seems to be the optical counterpart of the X-ray source the extraction region was adjusted by eye to cover the entire optical emission. For sources without obvious optical emission, the size of the 3 error circle of the XMM-Newton position was used. For instance, the extraction region of [SPH11] 414 in Fig. A1 was left as it is shown in the figures, whereas for [SPH11] 182 in Fig. 2, the extraction region was increased in size and shifted to cover the entire circular optical source seen in all optical images (dashed circle). The background emission was estimated locally for each source. Based on the optical fluxes and the [S ii]/H ratio, we confirmed five sources with significant H, [S ii], and [O iii] emission and an [S ii]/H ratio higher than 0.5 as new SNRs (see Table 3).
Another class of extended soft X-ray sources are interstellar bubbles and superbubbles in the interstellar medium of a galaxy, which are formed by stellar winds of massive stars. Studies of superbubbles in the Large Magellanic Cloud by, e.g., Chu & Mac Low (1990) or Dunne et al. (2001) have shown that the X-ray luminosities of X-ray bright superbubbles is higher than what is predicted by theoretical models (e.g., the standard model by Weaver et al. 1977). This indicates that the energy sources of the X-ray bright superbubbles are not only the stellar winds of massive stars, but also supernovae, and thus the shock waves of SNRs that occurred inside the superbubble. In contrast to the shock-ionised gas of SNRs, the gas in H ii regions around such superbubbles is mainly photo-ionised and the expansion velocities are too low to form a radiative shock. Therefore, the [S ii]/H ratio is lower in superbubbles than in SNRs. Some sources in our list have optical counterparts with a large extent and low [S ii]/H ratio (0.3). These sources are most likely superbubbles or SNRs in a superbubble. We want to point out that sources classified as SNR candidates in the catalogue of SPH11 can as well be superbubbles since the classification was based on X-ray hardness ratios, which will indicate a soft source for both superbubbles and SNRs.
4 New classifications
All sources in Tables 7 and 1 have been studied in detail and are (re-)classified as SNR, SNR candidates, or rejected (see Tables 3, 4, and 5).
Here, we summarise the X-ray and optical results for each source and its identification. In the SPH11 catalogue, following criteria were applied to identify SNRs and candidates:
-
1.
Soft sources with , are classified as SNR candidates if no foreground star was detected at the X-ray position.
-
2.
A source that fulfilled criterion 1 and had a known SNR as a counterpart was identified as an SNR.
-
3.
A source that did not fulfill criterion 1 but had an SNR counterpart in radio or optical and showed no significant variability was classified as an SNR candidate.
We have analysed the LGGS H, [S ii], and [O iii] data to obtain the optical emission line flux of the sources and to study their morphology. In the following, we will discuss for each source 1) why the source was classified as an SNR or a candidate by SPH11 and if there are any interesting details in the X-ray image or spectra, 2) its optical properties, and 3) a revised classification based on these new results. Specifically, we have
-
•
confirmed an XMM-Newton source as an SNR if the X-ray source is soft (i.e., fulfills criterion 1 of SPH11), there is no foreground star at its position, and is has either a radio counterpart classified as an SNR or an optical counterpart with [S ii]/H ,
-
•
newly classified an XMM-Newton source as an SNR if its spectrum is soft, there is no foreground star at its position, and the optical counterpart incidates an SNR ([S ii]/H ),
-
•
classified an XMM-Newton source as an SNR candidate if a source has a soft X-ray spectrum, no foreground star as counterpart, and neither optical nor radio counterpart indicative of an SNR,
OR a source has a soft X-ray spectrum, a foreground star at its position, but also an optical counterpart with [S ii]/H ,
OR a source had been identified as an SNR before and has a soft X-ray spectrum, but a possible foreground star together with diffuse optical emission was found in this work,
OR a source has a hard X-ray spectrum and a radio counterpart,
OR a hard source has an optical counterpart with [S ii]/H .
The new classifications are presented in the following. The details on the X-ray and optical properties for the sources, for which the classication remains unchanged, are available electronically in App. D. We assume a distance of 744 kpc to M 31 (Vilardell et al. 2010). At this distance 1″ corresponds to 3.6 pc. We use the following abbreviations for publications, which we refer to in this section: Baade & Arp (1964, BA64), Braun (1990, B90), Braun & Walterbos (1993, BW93), D’Odorico et al. (1980, DDB80), Di Stefano et al. (2004, DKG04), Gelfand et al. (2004, GLG04), Gelfand et al. (2005, GLG05), Kong et al. (2002b, KGP02), Magnier et al. (1995, MPV95), Orio (2006, O06), Pellet et al. (1978, PAV78), Pietsch et al. (2005, PFH05), Shaw Greening et al. (2009, SBK09), Walterbos & Braun (1992, WB92), Williams et al. (2004a, WGK04), and Williams et al. (2004b, WSK04).
4.1 New SNRs
4.1.1 [SPH11] 1079: XMMM31 J004255.50+405946.4
[SPH11] 1079 is a soft X-ray source with no foreground star at its position. Therefore, it was classified as an SNR candidate by SPH11.
There is a diffuse optical source located at the X-ray position, visible in all three H, [S ii], and [O iii] images (Fig. A5). The flux ratio is [S ii]/H = , indicating that it is an SNR. The extent of the diffuse emission is 9″. It has a bright concave arc-like structure in the south-west. Based on the X-ray hardness ratios and the optical flux ratio, we classify this source as a new SNR.
4.1.2 [SPH11] 1148: XMMM31 J004308.85+410305.4
[SPH11] 1148 is a soft X-ray source. As no foreground star was found at its position, it was classified as an SNR candidate by SPH11.
The flux ratio derived from the LGGS data is [S ii]/H = (Table 3) suggesting that it is an SNR. It is very faint and diffuse on the optical emission line images with an extent of 12″ and patchy structures (Fig. A5). This morphology is similar to that of [SPH11] 1282 and 1328. Based on the X-ray colour and the optical line flux ratio we classify this source as an SNR.
4.1.3 [SPH11] 1370: XMMM31 J004404.55+415806.5
[SPH11] 1370 is a soft X-ray source without a foreground star at its position, which therefore was classified as an SNR candidate by SPH11.
4.1.4 [SPH11] 1481: XMMM31 J004434.90+412512.7
[SPH11] 1481 is a faint, soft source with no foreground star at its position. Based on its hardness ratios it was classified as an SNR candidate by SPH11.
The X-ray source is coincident with the optical source [BW93] K490A located slightly to the north, which had been suggested to be an SNR candidate (Fig. A8). The [S ii]/H flux ratio derived from the LGGS data is 0.80.2 and indicates that the source is an SNR. The optical source is diffuse and has an extent of 20″. It seems to be located in a complex of H ii regions. The XMM-Newton source is also located in a region with extended soft X-ray emission and was not detected right at the position of the optical SNR. If the X-ray detection had been placed at the position of the optical SNR, the X-ray count rates would have most likely been higher (see Fig. A8). Therefore, the count rates in the catalogue of SPH11 are rather underestimated. Based on the X-ray and optical properties, we classify this source as a new SNR.
4.1.5 [SPH11] 1548: XMMM31 J004455.73+415655.2
[SPH11] 1548 is a faint, soft X-ray source which has been suggested as an SNR candidate by SPH11 based on its hardness ratios and the lack of a foreground star as likely counterpart.
There is a faint arc-like structure in the optical with an extent of 8″, which is visible in H, [S ii], and [O iii] at the X-ray position (Fig. A10). The [S ii]/H flux ratio of 1.10.4 suggests that this object is an SNR. Therefore, we identify this source as a new SNR.
4.2 New SNR candidates
| [SPH11] | H | [S ii] | [O iii] | [S ii]/H | (0.35 – 2.0 keV)a𝑎aa𝑎aSee Sect. 6.1. |
|---|---|---|---|---|---|
| ID | [erg cm-2 s-1 arcsec-2] | [erg cm-2 s-1 arcsec-2] | [erg cm-2 s-1 arcsec-2] | [erg s-1] | |
| 263 | 1.4e–142.9e–15 | 1.1e–145.5e–15 | N/A | 0.80.4 | 4.0e+35 |
| 294 | 1.4e–162.9e–17 | 4.2e–172.1e–17 | N/A | 0.30.2 | 2.1e+36 |
| 414 | 0.0 | 2.3e–171.2e–17 | N/A | 0.0 | 4.4e+35 |
| 419 | 0.0 | 5.6e–182.8e–18 | 2.5e–161.3e–16 | 0.0 | 2.3e+35 |
| 441 | 2.1e–164.3e–17 | 7.5e–173.7e–17 | N/A | 0.40.2 | 4.0e+35 |
| 521 | 1.1e–122.3e–13 | 2.8e–131.4e–13 | 8.0e–134.0e–13 | 0.30.2 | 2.4e+35 |
| 560 | 1.8e–163.7e–17 | 5.2e–172.6e–17 | N/A | 0.30.2 | 6.1e+35 |
| 668 | 1.5e–143.1e–15 | 1.3e–146.5e–15 | 3.1e–141.6e–14 | 0.90.5 | 1.1e+36 |
| 811 | 5.4e–151.1e–15 | 7.8e–153.9e–15 | 2.6e–141.3e–14 | 1.40.8 | 3.3e+35 |
| 833 | 3.3e–156.8e–16 | 4.7e–152.3e–15 | 6.4e–153.2e–15 | 1.40.7 | 3.5e+35 |
| 969 | 0.0 | 5.6e–182.8e–18 | 3.4e–171.7e–17 | 0.0 | 7.9e+36 |
| 1083 | 0.0 | 0.0 | 8.1e–174.0e–17 | 0.0 | 2.2e+35 |
| 1282 | 4.1e–152.4e–16 | 1.9e–153.9e–16 | 3.9e–151.2e–15 | 0.50.1 | 2.6e+35 |
| 1286 | 4.0e–162.3e–17 | 2.1e–164.3e–17 | 1.3e–154.0e–16 | 0.50.1 | 2.4e+35 |
| 1332 | 2.2e–161.3e–17 | 0.0 | 2.3e–162.5e–17 | 0.0 | 5.1e+35 |
| 1372 | 6.2e–143.6e–15 | 1.6e–143.3e–15 | 1.1e–143.3e–15 | 0.30.1 | 2.2e+35 |
| 1535 | 2.8e–141.6e–15 | 2.9e–146.0e–15 | 6.2e–146.9e–15 | 1.00.2 | 1.6e+36 |
| 1669 | 3.7e+35 | ||||
| 1748 | 2.6e+35 | ||||
| 1796 | 1.1e+36 |
See fig8a.jpg and fig8b.jpg.
4.2.1 [SPH11] 263: XMMM31 J003945.28+402949.9
[SPH11] 263 is a soft X-ray source with hardness ratios indicative of an SNR. The X-ray source is coincident with the optical SNR [BA64] 339 or [PAV78] 80 and was therefore identified as an SNR by PFH05 and SPH11.
The optical line emission of the LGGS images (Fig. A1) shows a ring-like structure with an extent of 15″, which has a flux ratio of [S ii]/H = at the position of the X-ray source, and an additional diffuse emission to the west with a lower flux ratio ([S ii]/H ). Therefore, it might be an SNR embedded in an interstellar bubble.
The LGGS , , , and band images show several faint point-like sources at the position of the X-ray source, two of which appear very red and may be late-type foreground stars. These stars might contribute to the detected X-ray emission (Fig. 8, top left). Due to this ambiguity we change the classification of the X-ray source to an SNR candidate. Only X-ray images with higher spatial resolution than XMM-Newton will allow to resolve the contributions from the different sources of X-ray emission.
4.2.2 [SPH11] 668: XMMM31 J004135.76+410655.0
[SPH11] 668 is coincident with the optical SNR [DDB80] 1-11 ([BA64] 416), which is also a radio source ([B90] 14). The X-ray source has also been detected with Chandra ([DKG04] s1-42). Although the hardness ratio does not fulfill the SNR criterion, PFH05 and SPH11 classified the X-ray source as an SNR based on its positional coincidence with the optical SNR.
From the narrow-band LGGS images we determine an [S ii]/H flux ratio of . The optical SNR has a diameter of 8″ and is brighter in the north and southwest (Fig. A3).
There is a faint star to the southwest inside the error radius of the XMM-Newton position (Fig. 8, upper middle right). We cannot rule out that the X-ray source is a foreground star. X-ray data with higher spatial resolution are necessary to separate the emission components. Therefore, we classify the XMM-Newton source as an SNR candidate.
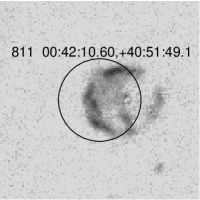
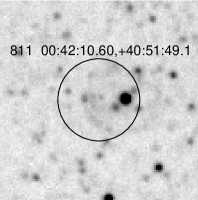
4.2.3 [SPH11] 811: XMMM31 J004210.60+405149.1
[SPH11] 811 was not classified as an SNR candidate by SPH11. It is coincident with source [PFH05] 224, which was classified as a candidate for a super-soft source. However, a look at DSS images in the course of the preparation for optical follow-up observations revealed a ring-like structure.
A circular shell with a diameter of 12″, which is brighter in the east, is clearly visible in the H, [S ii], and [O iii] images of the LGGS (Fig. A3). The flux ratio of the shell is [S ii]/H = 1.40.8 supporting its SNR nature.
In addition, there is a spoke-like feature extending from the centre to the south (Fig. 9, left). On the LGGS , , and images there is a bright point-like source at the centre of the ring with two additional fainter point-like structures northwest and southeast of the bright source (Fig. 9, right). These three sources form a line almost perpendicular to the spoke seen in the emission line images. We have derived an [S ii]/H flux ratio of from new optical follow-up observations (Hatzidimitriou et al., in prep.), which is in good agreement with the flux ratio from the LGGS data. The spectrum also shows weak Balmer lines and He i lines in absorption, indicative of an early-type star. Therefore, the optical source is most likely a composite of an SNR and an OB star in M 31.
As the X-ray hardness ratios are not indicative of an SNR (, , ), but the optical source is most likely an SNR, we classify the XMM-Newton source [SPH11] 811 as an SNR candidate.
4.2.4 [SPH11] 833: XMMM31 J004214.60+405204.7
[SPH11] 833 has hardness ratios not typical of SNRs. It is coincident with [PFH05] 234. We have identified diffuse H, [S ii], and [O iii] emission and thus regarded the source as an SNR candidate.
An extended emission line source elongated in the northeast to southwest direction (9″ 2″) is found on the H, [S ii], and [O iii] LGGS images (Fig. A3). The flux ratio of [S ii]/H = 1.40.7 suggests that the source is an SNR. Therefore, we classify this source as an SNR candidate.
4.2.5 [SPH11] 1286: XMMM31 J004342.08+414709.5
[SPH11] 1286 is a soft source, which marginally did not fulfill the criterion of . Diffuse H emission was found in the optical.
The LGGS images show a faint diffuse source in H, [S ii], and [O iii] (Fig. A6). The [S ii]/H flux ratio is . This value is at the border between SNRs and H ii regions, thus suggesting an SNR but not clearly ruling out the H ii region identification. Therefore, we classify this source as an SNR candidate.
4.2.6 [SPH11] 1372: XMMM31 J004404.71+414846.7
[SPH11] 1372 is a faint, soft X-ray source coincident with an extended optical source [WB92] 280, which was suggested as a possible SNR candidate by [MPV95] (source 3-072). It was therefore classified as an SNR by PFH05 and SPH11.
The optical source is also visible in the LGGS images (Fig. A6). The flux ratio derived from the LGGS data is [S ii]/H = 0.30.1, more typical for an H ii region than for an SNR. The source is highly extended (30″) and consists of an extended round region in the north and an additional arc-like structure in the southeast. Therefore, we classify the X-ray source as an SNR candidate, probably located in an H ii region.
4.2.7 [SPH11] 1535: XMMM31 J004451.07+412905.9
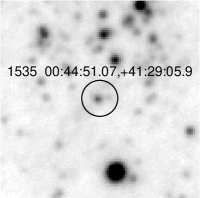
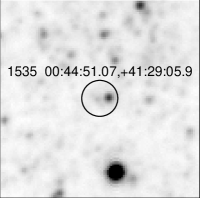
[SPH11] 1535 is coincident with the optical SNR [BW93] K583 and its radio counterpart and was thus identified as an SNR by PFH05 and SPH11.
The optical SNR is relatively compact with an extent of 8″ and an arc-like structure, which is open to the southwest (Fig. A9). It has a flux ratio typical for SNRs ([S ii]/H = 1.00.2). The SNR seems to be embedded in a shell-like H ii region extending to the northeast, best seen in the H image.
A closer look at the LGGS , , images has revealed two star-like objects within the X-ray error circle, i.e., in the projected interior of the optical SNR (Fig. 10). The object in the centre of the X-ray error circle is a star in M 31 with a magnitude of 19.43 listed as source D31 J004451.1+412905.6 in the catalogue of the DIRECT Project (Mochejska et al. 2001). The redder object to the west is 2MASS 00445095+4129058 with a magnitude of 16.063, listed in the 2MASS All-Sky Catalog of Point Sources (Cutri et al. 2003).
The X-ray emission of the SNR is most likely contaminated by the emission of these stellar objects. X-ray data with higher spatial resolution are necessary to separate the emission components. Therefore, we classfiy this XMM-Newton source as an SNR candidate.
4.3 Sources which are classified as no SNR candidates
| [SPH11] | H | [S ii] | [O iii] | [S ii]/H | Class. by | New |
|---|---|---|---|---|---|---|
| ID | [erg cm-2 s-1 arcsec-2] | [erg cm-2 s-1 arcsec-2] | [erg cm-2 s-1 arcsec-2] | SPH11a𝑎aa𝑎aClassification by SPH11. fg star: foreground star. The brackets indicate that these are candidates and the classifications hence need to be confirmed. | Class.b𝑏bb𝑏bNew classification. | |
| 472 | 2.2e–164.5e–17 | 1.4e–167.0e–17 | 0.0 | 0.60.3 | SNR | fg star |
| 500 | 1.7e–143.5e–15 | 5.4e–152.7e–15 | 3.8e–151.9e–15 | 0.30.2 | SNR | hard |
| 509 | 2.3e–174.8e–18 | 6.4e–173.2e–17 | 0.0e-+001.6e–17 | 2.81.5 | SNR | fg star |
| 682 | 1.2e–172.5e–18 | 3.6e–171.8e–17 | 0.0 | 0.0 | SNR | |
| 1121 | 4.6e–142.7e–15 | 9.6e–152.0e–15 | 5.0e–155.6e–16 | 0.20.1 | hard | hard |
| 1156 | 2.2e–151.3e–16 | 1.8e–153.7e–16 | 1.0e–151.1e–16 | 0.80.2 | SNR | hard |
| 1437 | SNR | |||||
| 1461 | 5.0e–142.9e–15 | 9.3e–152.0e–15 | 4.3e–151.3e–15 | 0.20.1 | fg star | fg star |
| 1468 | 5.1e–152.9e–16 | 2.1e–154.3e–16 | 4.4e–164.9e–17 | 0.40.1 | hard | hard |
| 1505 | 2.8e–168.5e–17 | 0.0 | 2.8e–168.5e–17 | 0.0 | SNR | AGN |
| 1534 | 8.4e–162.5e–16 | 0.05.9e–17 | 7.2e–162.2e–16 | 0.0 | SNR | fg star |
| 1608 | 2.3e–167.0e–17 | 0.0 | 0.07.9e–18 | 0.0 | SNR | fg star |
| 1611 | 1.8e–141.0e–15 | 8.2e–151.7e–15 | 2.6e–147.9e–15 | 0.50.1 | hard | hard |
| 1637 | 1.6e–174.9e–18 | 0.0 | 0.0 | 0.0 | SNR | hard |
| 1712 | 1.8e–135.5e–14 | 9.4e–142.0e–14 | 3.4e–141.0e–14 | 0.50.2 | SNR | |
| 1732 | 7.2e–154.2e–16 | 2.4e–154.9e–16 | 2.1e–156.4e–16 | 0.30.1 | SNR | hard |
| 1741 | 1.6e–154.9e–16 | 0.0 | 0.03.2e–17 | 0.0 | SNR | fg star |
4.3.1 [SPH11] 472: XMMM31 J004047.02+405146.7
[SPH11] 472 is a soft X-ray source with hardness ratios indicative of an SNR. As no foreground star was found, it was suggested as an SNR candidate by PFH05 and SPH11.
No diffuse optical line emission was detected in the LGGS H, [S ii], and [O iii] images (Fig. A2). The LGGS , , , and band images show a red optical point-like source inside the error circle of the XMM-Newton source (Fig. 8, top right). This optical source LGGS J004046.96+405148.2 has the colour = 1.4 and log() = –0.6, thus didn’t only marginally fulfill the criterion for stars of 1, log() (see Sect. 9.1 in SPH11). Therefore, we re-classify the source as a foreground star candidate.
4.3.2 [SPH11] 500: XMMM31 J004052.88+403624.4
[SPH11] 500 is a hard X-ray source. Owing to the positional coincidence with the optical SNR candidate with low confidence suggested by MPV95 (source 3-027), the source was classified as an SNR candidate by SPH11.
However, it is also listed in PFH05 and SBK09 as a hard source. An extended, diffuse source is visible at its position on the LGGS H image (Fig. A2), however the flux ratio of [S ii]/H = is lower than what is typical for SNRs. Therefore, this hard X-ray source with an optical counterpart that is probably no SNR, is no longer an SNR candidate.
4.3.3 [SPH11] 509: XMMM31 J004055.02+411216.4
[SPH11] 509 is a soft X-ray source and was classified as an SNR candidate based on its hardness ratios by SPH11.
However, on the LGGS , , , and band images, we find the star LGGS J004054.86+411217.1 at the X-ray position with = 1.3 and log() = –0.8 (Fig. 8, upper middle left). Therefore, we re-classify this sources as a foreground star candidate.
4.3.4 [SPH11] 682: XMMM31 J004140.28+405947.9
[SPH11] 682 is the faintest source in our list with a detection likelihood of . It was classified as an SNR candidate by SPH11 based on the hardness ratio criterion and the lack of a likely foreground star at its position.
However, with , the criterion is only marginally fulfilled. Furthermore, the fact that even was determined indicates that there is a hard component. Only faint H and [S ii] emission and no [O iii] emission is detected in the LGGS data (Table 5). No radio counterpart is known either. Therefore, we revise its classification and leave the source without classification.
4.3.5 [SPH11] 1156: XMMM31 J004310.43+413850.1
[SPH11] 1156 is a hard X-ray source, which was classified as an SNR candidate by SPH11 based on the positional coincidence with the source K89A in BW93.
[BW93] K89A is seen on the LGGS H and [S ii] images to the west of the X-ray source position (Fig. A5). It has a very faint [O iii] emission and a flux ratio of [S ii]/H 1 in the north. Therefore, the optical source was discussed as an SNR candidate. However, the XMM-Newton source is located east of [BW93] K89A and does not seem to be related to the optical source.
New optical follow-up observations (Hatzidimitriou et al., in prep.) have shown that the spectrum taken at the position of the XMM-Newton source is a composite spectrum of an early-type star and a nebular source with [S ii]/H = . This is in agreement with the value derived from the LGGS images (Table 5).
Neither the X-ray emission nor the optical emission is thus clearly indicative of an SNR at the position of [SPH11] 1156. Therefore, we classify the X-ray source as hard based on the X-ray hardness ratios.
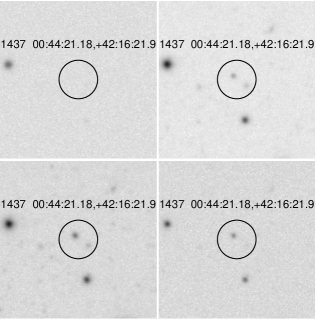
4.3.6 [SPH11] 1437: XMMM31 J004421.18+421621.9
[SPH11] 1437 is a faint soft X-ray source with low , which was suggested as an SNR candidate based on its hardness ratios by SPH11 (see Fig. 3).
The location of this source was not covered by the LGGS. Two faint sources are found on the SDSS-III , , and band images inside the XMM-Newton error circle (Fig. 4). These sources are not visible in the band image. The sources are listed in the USNO-B1.0 catalogue (Monet et al. 2003), both with = 20.6, 21.4 and = 19.6, 19.1, respectively. The XMM-Newton source [SPH11] 1437 is therefore most probably either a star or an AGN. We therefore no longer classify this source as an SNR candidate.
4.3.7 [SPH11] 1505: XMMM31 J004442.73+415340.5
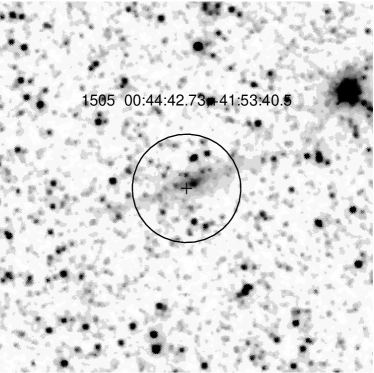
[SPH11] 1505 is a hard X-ray source with hardness ratios of , , , and . It was classified as an SNR candidate by SPH11 based on its hardness ratios and and the lack of a foreground star at its position.
The source is located south of the H ii region [PAV78] 799 (Fig. A9). It is obviously not related to the H ii region. Instead, there is apparently a galaxy at its position as can be seen on an HST image taken with ACS/WFC using the filter F814W (Fig. 11). This galaxy seems to have a clearly visible nucleus, which is located inside the 3 error circle of the XMM-Newton source position. This source also has an extended infrared counterpart in the Wide-field Infrared Survey Explorer (WISE) All-sky data release (Cutri & et al. 2012). Therefore, we classify [SPH11] 1505 as an AGN candidate.
4.3.8 [SPH11] 1534: XMMM31 J004450.02+415240.9
[SPH11] 1534 is a soft X-ray source and was classified as an SNR candidate by SPH11 based on its hardness ratios.
It is located near the optical SNR [BW93] K567 and its radio counterpart [B90] 308, which is seen at the northern edge of the H image (Fig. A9). However, two faint red sources are found on, e.g., the LGGS band image at the position of the XMM-Newton source, which are most likely stars (Fig. 8, lower middle left). The X-ray source seems not to be related to the SNR to the north. Because optical point sources are found, we no longer classify the X-ray source as an SNR candidate.
4.3.9 [SPH11] 1608: XMMM31 J004517.87+420502.1
[SPH11] 1608 is a faint soft X-ray source, which was classified as an SNR candidate by SPH11 based on its hardness ratios.
In the LGGS data, only faint H emission was detected. The LGGS , , and band images show a point source at the position of the XMM-Newton source (Fig. 8, lower middle right). This optical source (LGGS J004517.84+420501.7) has = 1.2 and log() = –0.6, thus did not marginally fulfill the criterion for stars (Sect. 9.1 in SPH11, see also Sect. 4.3.1). However, as there is a star within the X-ray error circle and no additional extended source in the optical that is indicative of an SNR, we now classify the X-ray source as a foreground star candidate.
4.3.10 [SPH11] 1637: XMMM31 J004528.35+414605.9
[SPH11] 1637 is a hard X-ray source. It was suggested to be an SNR candidate by PFH05 and SPH11 as it is located near the SNR candidate [MPV95] 1-013.
The source [MPV95] 1-013 can be found at the top edge of the LGGS H and [S ii] images in Fig. A11. The X-ray source is located south of it and does not seem to be related to the SNR candidate. Therefore, we no longer classify this hard X-ray source as an SNR candidate.
4.3.11 [SPH11] 1712: XMMM31 J004556.01+421117.2
[SPH11] 1712 is a faint, hard X-ray source. It is coincident with the optical source [BW93] K884 and was therefore suggested as an SNR candidate by SPH11.
The optical source [BW93] K884, however, has been suggested to be a supershell (Fig. A11). The [S ii]/H ratio derived from the LGGS data is 0.50.2 and hence more consistent with an H ii region.
The optical spectrum obtained in a new follow-up observation by Hatzidimitriou et al. (in prep.) indicates a composite of a most likely highly reddened Be star and nebular emission. The [S ii]/H ratio of 0.360.08 is consistent with the LGGS value and not indicative of an SNR.
As the X-ray source is hard and there is no optical emission suggesting an SNR nature, we no longer classify this source as an SNR candidate.
4.3.12 [SPH11] 1732: XMMM31 J004602.53+414513.2
[SPH11] 1732 is a hard X-ray source and was classified as an SNR candidate by PFH05 and SPH11 as it is located near the source [MPV95] 3-111, which had been suggested to be an SNR candidate.
However, [SPH11] 1732 is located 30″ distant from [MPV95] 3-111. It is located at the edge of a large diffuse structure seen in H (Fig. A11), but shows no clear correlation with the optical line emission. Therefore, we classify this X-ray source as a hard source and not as an SNR candidate.
4.3.13 [SPH11] 1741: XMMM31 J004604.42+414943.2
[SPH11] 1741 is a soft X-ray source with no optical counterpart that seems to be a foreground star. Therefore, the source was classified as an SNR candidate by PFH05 and SPH11. It has also been detected with Chandra ([WGK04], [DKG04] n1-48).
We find two optical point sources on the LGGS , , and band images, one inside and one right outside the error circle of the XMM-Newton source (Fig. 8, bottom). The optical source inside the error circle (LGGS J00460.38+414944.0) has the optical colour and log() = , indicative of a star. Therefore, we classify the X-ray source as a foreground star candidate.
5 Comparison to other X-ray catalogues
5.1 Comparison to the ROSAT catalogue
In the ROSAT source catalogues of SHP97 and SHL01, 16 sources were classified as SNRs. Thirteen out of the 16 sources were detected in the XMM-Newton survey. No counterpart was found for the ROSAT sources [SHL01] 129 (RX J0041.9+4046), [SHP97] 203 (RX J0042.8+4125), and [SHP97] 258 (RX J0043.9+4152).
The ROSAT source [SHP97] 284 (RX J0044.6+4125) is located between two XMM-Newton sources: [SPH11] 1497, which is an SNR with optical and radio counterparts, and 1481, which was classified as an SNR candidate by SPH11 based on its X-ray hardness ratios. Based on the new optical data of the LGGS, we confirmed [SPH11] 1481 as an SNR.
We have classified [SPH11] 1079 ([SHP97] 212) as a new SNR based on the optical line emission. In addition, we have confirmed that three XMM-Newton sources [SPH11] 472, 682, and 1637 with ROSAT counterparts ([SHP97] 92, [SHL01] 110, and [SHL01] 321, respectively) are no SNR candidates.
5.2 Comparison to Chandra sources
XMM-Newton detected five of six SNRs in M 31 that were classified based on Chandra observations: [KGP02] r2-57 ([SPH11] 883), [KGP02] r3-84 ([SPH11] 1040), [KGP02] r2-56 ([SPH11] 1050), [KGP02] r3-69 ([SPH11] 1060), and [KGP02] r3-63 ([SPH11] 1234). The Chandra source CXOM31 J004247.82+411525.7 that was identified as an SNR by Kong et al. (2003, source 2) is located between two bright sources and has not been resolved by XMM-Newton.
Williams et al. (2004a) classified the Chandra source [WGK04] n1-85 (also [DKG04]) as a variable X-ray source coincident with a radio SNR ([B90] 265). In addition, this source was identified as a transient source by Williams et al. (2006). It was not detected by XMM-Newton even though the position is covered by XMM-Newton observations, confirming its transient nature. Therefore, this source is not likely an SNR.
6 Discussion
6.1 Cumulative X-ray luminosity distribution

We estimated the luminosity of the SNRs and candidates listed in Tables 3 and 4 and thus obtained a cumulative luminosity distribution of the SNRs in M 31. For the M 31 SNRs we converted the XMM-Newton count rates into flux by assuming a thermal spectrum with keV, absorbed by a foreground column density of (MW) cm-2 and an additional (M31) cm-2 similar to values of the fits of the four brightest sources [SPH11] 969, 1050, 1066, and 1234. We simulated the flux assuming different models by varying the temperature in the range of keV and the foreground absorption (M31) cm-2 for the observed count rates and obtained an uncertainty of 20%. Assuming CIE or NEI model results in a difference in flux of 10% (see Table 2). As most of the sources are too faint to distinguish between CIE and NEI, we assume the same APEC model for all sources. For the cumulative luminosity distribution plot shown in Fig. 12, the luminosities in the energy band of 0.35 – 2.0 keV were calculated with the foreground absorption set to zero. We also included the source CXOM31 J004247.82+411525.7, which was identified as an SNR by Kong et al. (2003) but not resolved with XMM-Newton (see Sect. 5.2). For comparison, the luminosities for M 33 SNRs taken from Long et al. (2010) are plotted as well. These luminosities were converted from Chandra count rates by Long et al. (2010) assuming a thermal plasma model with keV and an absorbing cm-2, which correspond to the best fit values for the brightest SNRs in M 33 observed with Chandra.
As one can see in Fig. 12 the slope of the cumulative luminosity distribution of X-ray SNRs in M 31 and M 33 are comparable. Both distributions can be fitted with a power law with an index of . The distribution in M 33 seems to deviate from this power-law distribution for luminosities erg s-1 showing an excess. The slight difference in the shape of the cumulative luminosity distribution might indicate that the fraction of more luminous SNRs in M 33 is higher than in M 31. There are 24 sources brighter than erg s-1 in M 31 and nine in M 33. Above erg s-1, there are 13 sources in M 31 and seven in M 33 (see also Ghavamian et al. 2005; Long et al. 2010).
The number of SNRs in M 33 is higher than what is expected if we simply scale with the total mass of the galaxy, as M 33 is about 10 times less massive than M 31 (Corbelli 2003; Watkins et al. 2010). M 33 is a typical flocculent spiral galaxy with discontinuous spiral arms, in which star formation regions are found. In contrast to grand design spirals such as the Milky Way or M 31, in which density waves are believed to produce the spiral arms, gravitational instabilities together with turbulence in the interstellar medium seem to be the origin of the spiral structure and thus the on-going star formation in flocculent galaxies (Sellwood & Carlberg 1984; Elmegreen et al. 2003, and references therein). The star formation rate in the disk of M 31 is 0.27 yr-1 for kpc (Tabatabaei & Berkhuijsen 2010) corresponding to a star formation rate per unit area of Gyr-1 pc-2. This value is about six times lower than in M 33, for which a star formation rate per unit area of Gyr-1 pc-2 has been measured (Verley et al. 2009). The higher star formation rate implies a higher rate for the occurrence of core-collapse SNRs in M 33.
In addition, one should note that our list of SNRs in M 31 is based on XMM-Newton observations whereas the M 33 SNRs have been detected in a survey performed with Chandra. Not only was the Chandra survey of M 33 deeper, but the superior angular resolution of Chandra made it possible to detect smaller and thus most likely younger SNRs in M 33, which would not have been resolved and classified as an SNR in an XMM-Newton observation. However, the Chandra M 33 survey only observed the inner part of the galaxy inside the ellipse, whereas the XMM-Newton M 31 survey fully covered the ellipse.
6.2 Radial distribution
| Galaxy | Distancea𝑎aa𝑎aVilardell et al. (2010) for M 31 and Scowcroft et al. (2009) for M 33. [kpc] | Position Angleb𝑏bb𝑏bde Vaucouleurs et al. (1991). | Inclination Angleb𝑏bb𝑏bde Vaucouleurs et al. (1991). | Corrected b𝑏bb𝑏bde Vaucouleurs et al. (1991). | [kpc] |
|---|---|---|---|---|---|
| M 31 | 744 | 35° | 71° | 1555 | 16.8 |
| M 33 | 805 | 23° | 54° | 526 | 6.2 |
In the shock waves of SNRs, particles can gain energies up to 1015 eV or higher due to diffusive shock acceleration (Bell 1978a, b; Blandford & Ostriker 1978; Hillas 2005). Therefore, SNRs together with pulsars are thought to be the primary sources of Galactic cosmic rays (CRs). The distribution of SNRs and pulsars in our Galaxy is a crucial basis for the understanding of the CR distribution. Stecker & Jones (1977) studied the radial dependence of the Galactic SNR surface density using observational SNR data of Kodaira (1974) and pulsar data of Seiradakis (1977) and showed that it can be described as with being the radial distance to the Galactic centre. Using only Galactic shell-type SNRs, Leahy & Wu (1989) found a peak in the surface density distribution at 4 – 6 kpc distance from the Galactic centre. Case & Bhattacharya (1998) re-analysed the Galactic SNR data and suggested to use a dependence of the type for the radial surface density distribution. They obtained a scale length of kpc and a maximum of the distribution at about 5 kpc. Based on the obtained distribution of SNRs in our Galaxy, the spectral distribution of Galactic CRs can be modelled to explain the CR spectrum up to 1015 – 1016 eV (see, e.g., Hillas 2005). However, our vantage point is not ideal to study the source distribution in our Galaxy. To understand the distribution of SNRs in a spiral galaxy, it is thus necessary to study the most nearby spiral galaxies M 31 and M 33.


In order to obtain the radial distribution of SNRs in M 31, the positions of the SNRs and candidates in Tables 3 and 4 as well as the source CXOM31 J004247.82+411525.7 were first corrected for projection and their galactocentric distances were computed. Stiele et al. (2011) have also presented the radial distribution of SNRs and candidates in M 31 detected in the XMM-Newton LP. For comparing M 31 and M 33, the radial distances were normalised to . The positions of sources were binned into equidistant radial bins and the surface density was calculated for each annulus. The parameters used, i.e., distance, inclination angle, position angle, and are listed in Table 6. The SNR surface densities are plotted against the normalised radial distance in Fig. 13. We fitted the obtained radial surface density distribution of the SNRs in each galaxy with the model distribution introduced for the radio selected SNRs in the Milky Way
| (1) |
with a maximum at a radial distance of several kpc from the Galactic centre as originally suggested by Stecker & Jones (1977). The parameters of the distribution obtained by Case & Bhattacharya (1998) for our Galaxy are , and . The best-fit model curves according to Eq. 1 are plotted in Fig. 13 with dotted lines. This radial SNR distribution in M 31 and M 33 is different from the mass distribution of these galaxies derived from the rotation curves (e.g., Corbelli 2003; Corbelli et al. 2010, and references therein). The SNR distribution rather seems to follow the distribution of stars and gas, similar to what had been suggested for the Milky Way. For comparison, we also plot the distribution for the Milky Way normalised to the fitted maxima of the distributions in M 31 and M 33. The fitted curve indicates a maximum at about 5.5 kpc and 2 kpc for M 31 and M 33, respectively, corresponding to 0.3 for both galaxies. The distribution in M 31 seems to be almost flat for 17 kpc and falls exponentially outside , while the distribution in M 33 falls off exponentially for 4 kpc . This behaviour of the SNR distribution in M 31 seems to be correlated with the distribution of gas in M 31, which is known to have ring-like structures consisting of many spiral arms between a radius of kpc to 20 kpc, with the most prominent ring found at a radius of kpc (Sofue & Kato 1981; Braun 1991).
7 Summary
We have studied the X-ray and optical properties of SNRs and candidates in the source catalogue of the XMM-Newton LP survey of M 31. For the optical analysis we used the H, [S ii], and [O iii] emission line images as well as the band images of the LGGS (Massey et al. 2006), which covered M 31 in ten fields.
In addition to the 56 SNRs and candidates in the XMM-Newton survey source catalogue by SPH11, we found seven sources, which had not been classified as SNR candidates but showed optical line emission indicative of SNRs. Therefore, we included these seven sources also in the list of studied sources. We extracted X-ray spectra of the twelve brightest sources. Only four of the sources have high enough statistics to perform a more detailed analysis of the X-ray spectra taken with the XMM-Newton EPIC instruments. For the three brightest sources ([SPH11] 969, 1066, 1234) a collisional ionisation equilibrium model (APEC) does not reproduce the spectra well, while a non-equilibrium ionisation model (NEI) improves the fit. Two thermal components with two different temperatures are necessary for the spectrum of [SPH11] 1234 to achieve a satisfactory fit indicating that the X-ray emission is a superposition of at least two emission components.
For each SNR and candidate we measured the H, [S ii], and [O iii] fluxes as well as the [S ii]/H flux ratio and thus confirmed five new X-ray sources as SNRs. We want to point out that the final classification of this work applies to the X-ray source. Therefore, if, for example, the optical counterpart is likely an SNR but the X-ray source is either a soft source with a star in the positional error circle or is a hard source, the X-ray source was classified as an SNR candidate.
We identified 17 sources, which are either hard X-ray sources with no optical counterpart indicative of an SNR or with an optical counterpart that is likely a star or a background AGN. Therefore, we excluded these sources from the list of SNRs or candidates. In particular, source [SPH11] 1505, for which we found a galaxy with a bright nucleus as an optical counterpart, has been classified as an AGN candidate.
From the XMM-Newton LP survey catalogue, we have thus obtained a list of 26 X-ray SNRs and additional 20 bona-fide X-ray SNR candidates in M 31. The brightest SNRs have X-ray luminosities of erg s-1 in the 0.3 – 2.0 keV band.
Acknowledgements.
We have made extensive use of the optical data from the Local Group Galaxy Survey, which are kindly made available by Phil Massey and his collaborators.This work has also made use of SkyView and images from the Sloan Digital Sky Survey (SDSS) III. Funding for SDSS-III has been provided by the Alfred P. Sloan Foundation, the Participating Institutions, the National Science Foundation, and the U.S. Department of Energy. The SDSS-III web site is http://www.sdss3.org/. SDSS-III is managed by the Astrophysical Research Consortium for the Participating Institutions of the SDSS-III Collaboration including the University of Arizona, the Brazilian Participation Group, Brookhaven National Laboratory, University of Cambridge, University of Florida, the French Participation Group, the German Participation Group, the Instituto de Astrofisica de Canarias, the Michigan State/Notre Dame/JINA Participation Group, Johns Hopkins University, Lawrence Berkeley National Laboratory, Max Planck Institute for Astrophysics, New Mexico State University, New York University, Ohio State University, Pennsylvania State University, University of Portsmouth, Princeton University, the Spanish Participation Group, University of Tokyo, University of Utah, Vanderbilt University, University of Virginia, University of Washington, and Yale University.
Furthermore, this work is based on observations made with the NASA/ESA Hubble Space Telescope, obtained from the data archive at the Space Telescope Institute. STScI is operated by the association of Universities for Research in Astronomy, Inc. under the NASA contract NAS 5-26555.
This publication makes use of data products from the Wide-field Infrared Survey Explorer, which is a joint project of the University of California, Los Angeles, and the Jet Propulsion Laboratory/California Institute of Technology, funded by the National Aeronautics and Space Administration.
M.S. acknowledges support by the Deutsche Forschungsgemeinschaft through the Emmy Noether Research Grant SA 2131/1.
References
- Anders & Grevesse (1989) Anders, E. & Grevesse, N. 1989, Geochim. Cosmochim. Acta., 53, 197
- Baade & Arp (1964) Baade, W. & Arp, H. 1964, ApJ, 139, 1027
- Barnard et al. (2008) Barnard, R., Stiele, H., Hatzidimitriou, D., et al. 2008, ApJ, 689, 1215
- Bell (1978a) Bell, A. R. 1978a, MNRAS, 182, 147
- Bell (1978b) Bell, A. R. 1978b, MNRAS, 182, 443
- Bellazzini et al. (2003) Bellazzini, M., Cacciari, C., Federici, L., Fusi Pecci, F., & Rich, M. 2003, A&A, 405, 867
- Blair et al. (1981) Blair, W. P., Kirshner, R. P., & Chevalier, R. A. 1981, ApJ, 247, 879
- Blandford & Ostriker (1978) Blandford, R. D. & Ostriker, J. P. 1978, ApJ, 221, L29
- Block et al. (2006) Block, D. L., Bournaud, F., Combes, F., et al. 2006, Nature, 443, 832
- Braun (1990) Braun, R. 1990, ApJS, 72, 761
- Braun (1991) Braun, R. 1991, ApJ, 372, 54
- Braun & Walterbos (1993) Braun, R. & Walterbos, R. A. M. 1993, A&AS, 98, 327
- Brinks & Shane (1984) Brinks, E. & Shane, W. W. 1984, A&AS, 55, 179
- Brown et al. (2006) Brown, T. M., Smith, E., Ferguson, H. C., et al. 2006, ApJ, 652, 323
- Case & Bhattacharya (1998) Case, G. L. & Bhattacharya, D. 1998, ApJ, 504, 761
- Chu & Mac Low (1990) Chu, Y.-H. & Mac Low, M.-M. 1990, ApJ, 365, 510
- Corbelli (2003) Corbelli, E. 2003, MNRAS, 342, 199
- Corbelli et al. (2010) Corbelli, E., Lorenzoni, S., Walterbos, R., Braun, R., & Thilker, D. 2010, A&A, 511, A89
- Cutri & et al. (2012) Cutri, R. M. & et al. 2012, VizieR Online Data Catalog, 2311, 0
- Cutri et al. (2003) Cutri, R. M., Skrutskie, M. F., van Dyk, S., et al. 2003, VizieR Online Data Catalog, 2246, 0
- Dame et al. (1993) Dame, T. M., Koper, E., Israel, F. P., & Thaddeus, P. 1993, ApJ, 418, 730
- de Vaucouleurs et al. (1991) de Vaucouleurs, G., de Vaucouleurs, A., Corwin, Jr., H. G., et al. 1991, Third Reference Catalogue of Bright Galaxies, ed. de Vaucouleurs, G., et al.
- Dennefeld & Kunth (1981) Dennefeld, M. & Kunth, D. 1981, AJ, 86, 989
- Di Stefano et al. (2004) Di Stefano, R., Kong, A. K. H., Greiner, J., et al. 2004, ApJ, 610, 247
- D’Odorico et al. (1980) D’Odorico, S., Dopita, M. A., & Benvenuti, P. 1980, A&AS, 40, 67
- Dunne et al. (2001) Dunne, B. C., Points, S. D., & Chu, Y.-H. 2001, ApJS, 136, 119
- Elmegreen et al. (2003) Elmegreen, B. G., Leitner, S. N., Elmegreen, D. M., & Cuillandre, J.-C. 2003, ApJ, 593, 333
- Gelfand et al. (2004) Gelfand, J. D., Lazio, T. J. W., & Gaensler, B. M. 2004, ApJS, 155, 89
- Gelfand et al. (2005) Gelfand, J. D., Lazio, T. J. W., & Gaensler, B. M. 2005, ApJS, 159, 242
- Ghavamian et al. (2005) Ghavamian, P., Blair, W. P., Long, K. S., et al. 2005, AJ, 130, 539
- Giacconi et al. (1979) Giacconi, R., Branduardi, G., Briel, U., et al. 1979, ApJ, 230, 540
- Hillas (2005) Hillas, A. M. 2005, Journal of Physics G Nuclear Physics, 31, 95
- Jansen et al. (2001) Jansen, F., Lumb, D., Altieri, B., et al. 2001, A&A, 365, L1
- Kaaret (2002) Kaaret, P. 2002, ApJ, 578, 114
- Kodaira (1974) Kodaira, K. 1974, PASJ, 26, 255
- Kong et al. (2002a) Kong, A. K. H., Garcia, M. R., Primini, F. A., & Murray, S. S. 2002a, ApJ, 580, L125
- Kong et al. (2002b) Kong, A. K. H., Garcia, M. R., Primini, F. A., et al. 2002b, ApJ, 577, 738
- Kong et al. (2003) Kong, A. K. H., Sjouwerman, L. O., Williams, B. F., Garcia, M. R., & Dickel, J. R. 2003, ApJ, 590, L21
- Leahy & Wu (1989) Leahy, D. A. & Wu, X. 1989, PASP, 101, 607
- Long et al. (2010) Long, K. S., Blair, W. P., Winkler, P. F., et al. 2010, ApJS, 187, 495
- Magnier et al. (1995) Magnier, E. A., Prins, S., van Paradijs, J., et al. 1995, A&AS, 114, 215
- Massey et al. (2007) Massey, P., McNeill, R. T., Olsen, K. A. G., et al. 2007, AJ, 134, 2474
- Massey et al. (2006) Massey, P., Olsen, K. A. G., Hodge, P. W., et al. 2006, AJ, 131, 2478
- Mochejska et al. (2001) Mochejska, B. J., Kaluzny, J., Stanek, K. Z., & Sasselov, D. D. 2001, AJ, 122, 1383
- Monet et al. (2003) Monet, D. G., Levine, S. E., Canzian, B., et al. 2003, AJ, 125, 984
- Orio (2006) Orio, M. 2006, ApJ, 643, 844
- Osborne et al. (2001) Osborne, J. P., Borozdin, K. N., Trudolyubov, S. P., et al. 2001, A&A, 378, 800
- Pellet et al. (1978) Pellet, A., Astier, N., Viale, A., et al. 1978, A&AS, 31, 439
- Pietsch et al. (2005) Pietsch, W., Freyberg, M., & Haberl, F. 2005, A&A, 434, 483
- Scowcroft et al. (2009) Scowcroft, V., Bersier, D., Mould, J. R., & Wood, P. R. 2009, MNRAS, 396, 1287
- Seiradakis (1977) Seiradakis, J. H. 1977, in NASA Conference Publication, Vol. 2, NASA Conference Publication, ed. C. E. Fichtel & F. W. Stecker, 265–282
- Sellwood & Carlberg (1984) Sellwood, J. A. & Carlberg, R. G. 1984, ApJ, 282, 61
- Shaw Greening et al. (2009) Shaw Greening, L., Barnard, R., Kolb, U., Tonkin, C., & Osborne, J. P. 2009, A&A, 495, 733
- Sofue & Kato (1981) Sofue, Y. & Kato, T. 1981, PASJ, 33, 449
- Stark et al. (1992) Stark, A. A., Gammie, C. F., Wilson, R. W., et al. 1992, ApJS, 79, 77
- Stecker & Jones (1977) Stecker, F. W. & Jones, F. C. 1977, ApJ, 217, 843
- Stiele et al. (2008) Stiele, H., Pietsch, W., Haberl, F., & Freyberg, M. 2008, A&A, 480, 599
- Stiele et al. (2011) Stiele, H., Pietsch, W., Haberl, F., et al. 2011, A&A, 534, A55
- Strüder et al. (2001) Strüder, L., Briel, U., Dennerl, K., et al. 2001, A&A, 365, L18
- Supper et al. (2001) Supper, R., Hasinger, G., Lewin, W. H. G., et al. 2001, A&A, 373, 63
- Supper et al. (1997) Supper, R., Hasinger, G., Pietsch, W., et al. 1997, A&A, 317, 328
- Tabatabaei & Berkhuijsen (2010) Tabatabaei, F. S. & Berkhuijsen, E. M. 2010, A&A, 517, A77+
- Trinchieri & Fabbiano (1991) Trinchieri, G. & Fabbiano, G. 1991, ApJ, 382, 82
- Trümper (1982) Trümper, J. 1982, Advances in Space Research, 2, 241
- Turner et al. (2001) Turner, M. J. L., Abbey, A., Arnaud, M., et al. 2001, A&A, 365, L27
- van Speybroeck et al. (1979) van Speybroeck, L., Epstein, A., Forman, W., et al. 1979, ApJ, 234, L45
- Verley et al. (2009) Verley, S., Corbelli, E., Giovanardi, C., & Hunt, L. K. 2009, A&A, 493, 453
- Vilardell et al. (2010) Vilardell, F., Ribas, I., Jordi, C., Fitzpatrick, E. L., & Guinan, E. F. 2010, A&A, 509, A70+
- Walterbos & Braun (1992) Walterbos, R. A. M. & Braun, R. 1992, A&AS, 92, 625
- Watkins et al. (2010) Watkins, L. L., Evans, N. W., & An, J. H. 2010, MNRAS, 406, 264
- Weaver et al. (1977) Weaver, R., McCray, R., Castor, J., Shapiro, P., & Moore, R. 1977, ApJ, 218, 377
- Weisskopf et al. (2002) Weisskopf, M. C., Brinkman, B., Canizares, C., et al. 2002, PASP, 114, 1
- Williams (2003) Williams, B. F. 2003, AJ, 126, 1312
- Williams et al. (2004a) Williams, B. F., Garcia, M. R., Kong, A. K. H., et al. 2004a, ApJ, 609, 735
- Williams et al. (2006) Williams, B. F., Naik, S., Garcia, M. R., & Callanan, P. J. 2006, ApJ, 643, 356
- Williams et al. (2004b) Williams, B. F., Sjouwerman, L. O., Kong, A. K. H., et al. 2004b, ApJ, 615, 720
Appendix A XMM-Newton and LGGS images
See figa1.jpg to figa12.jpg.
Appendix B Supernova remnants and candidates in the XMM-Newton M 31 large survey catalogue
| [SPH11] | RA (2000.0) | Dec (2000.0) | Pos. error | Rate | a𝑎aa𝑎aDetection likelihood. | b𝑏bb𝑏bHardness ratios. | b𝑏bb𝑏bHardness ratios. | b𝑏bb𝑏bHardness ratios. | b𝑏bb𝑏bHardness ratios. |
|---|---|---|---|---|---|---|---|---|---|
| ID | [arcsec] | [cts/s] | |||||||
| SNRsc𝑐cc𝑐cClassification by SPH11. | |||||||||
| 182 | 00 39 23.50 | +40 44 19.1 | 5.30 | 2.0e–35.0e–5 | 13 | 0.950.27 | –0.640.20 | ||
| 263 | 00 39 45.28 | +40 29 49.9 | 3.37 | 3.7e–34.0e–5 | 96 | 0.420.10 | –0.930.09 | ||
| 474 | 00 40 47.19 | +40 55 24.6 | 2.69 | 6.4e–36.0e–5 | 180 | 0.900.06 | –0.630.08 | –0.880.20 | |
| 668 | 00 41 35.76 | +41 06 55.0 | 4.50 | 9.8e–32.0e–4 | 62 | 0.710.17 | –0.300.15 | –0.800.28 | 0.830.25 |
| 883 | 00 42 24.41 | +41 17 29.8 | 2.65 | 3.7e–34.0e–5 | 52 | 0.800.07 | –0.980.06 | ||
| 1040 | 00 42 49.11 | +41 24 06.6 | 2.38 | 9.2e–35.0e–5 | 330 | 0.480.05 | –0.840.05 | –1.000.27 | |
| 1050 | 00 42 50.47 | +41 15 56.7 | 3.28 | 1.1e–29.0e–5 | 73 | 0.530.08 | –0.960.06 | ||
| 1066 | 00 42 53.53 | +41 25 51.0 | 1.89 | 3.5e–21.0e–4 | 1400 | 0.560.03 | –0.700.03 | –0.940.11 | |
| 1234 | 00 43 27.93 | +41 18 30.5 | 1.79 | 7.4e–21.0e–4 | 6300 | 0.440.02 | –0.710.01 | –0.950.03 | |
| 1275 | 00 43 39.27 | +41 26 53.0 | 2.12 | 2.9e–21.0e–4 | 1200 | 0.390.04 | –0.760.04 | –0.870.12 | |
| 1291 | 00 43 43.97 | +41 12 32.7 | 2.15 | 1.7e–28.0e–5 | 620 | 0.770.04 | –0.450.04 | –0.940.06 | |
| 1328 | 00 43 53.69 | +41 12 04.4 | 2.80 | 1.1e–28.0e–5 | 270 | 0.530.07 | –0.580.07 | –1.000.12 | |
| 1351 | 00 43 58.25 | +41 13 28.7 | 3.17 | 6.0e–36.0e–5 | 86 | 0.420.10 | –0.780.10 | –0.480.43 | |
| 1372 | 00 44 04.71 | +41 48 46.7 | 6.39 | 2.0e–36.0e–5 | 9.0 | 0.780.28 | –0.550.24 | 1.000.26 | |
| 1386 | 00 44 09.53 | +41 33 20.9 | 4.49 | 2.0e–33.0e–5 | 26 | 0.420.17 | –0.780.13 | ||
| 1410 | 00 44 13.55 | +41 19 54.3 | 3.26 | 7.8e–38.0e–5 | 120 | 0.920.07 | –0.370.09 | –0.720.17 | |
| 1497 | 00 44 38.91 | +41 25 28.8 | 5.17 | 5.4e–31.0e–4 | 20 | 0.720.17 | –0.460.19 | –0.680.29 | |
| 1522 | 00 44 47.19 | +41 29 18.7 | 4.83 | 4.1e–36.0e–5 | 34 | 0.440.14 | –0.700.14 | ||
| 1535 | 00 44 51.07 | +41 29 05.9 | 2.71 | 1.5e–21.0e–4 | 250 | 0.180.08 | –0.220.09 | –0.510.12 | –0.550.53 |
| 1539 | 00 44 52.82 | +41 54 58.1 | 3.81 | 1.9e–33.0e–5 | 22 | 0.700.21 | –0.080.18 | –0.620.23 | |
| 1587 | 00 45 10.59 | +41 32 51.3 | 4.69 | 3.3e–37.0e–5 | 22 | 0.310.19 | –0.670.35 | ||
| 1593 | 00 45 12.31 | +42 00 29.6 | 4.16 | 1.6e–33.0e–5 | 13 | 0.890.16 | –0.430.18 | –0.100.32 | |
| 1599 | 00 45 13.94 | +41 36 15.5 | 2.52 | 1.9e–21.0e–4 | 590 | 0.710.05 | –0.550.05 | –1.000.05 | |
| 1793 | 00 46 24.71 | +41 55 41.6 | 3.18 | 4.7e–35.0e–5 | 140 | 0.550.09 | –0.660.10 | –0.870.37 | |
| 1805 | 00 46 27.91 | +42 08 06.7 | 4.03 | 7.4e–38.0e–5 | 120 | 0.450.09 | –0.730.10 | –1.000.43 | |
| SNR candidatesc𝑐cc𝑐cClassification by SPH11. | |||||||||
| 294 | 00 39 58.28 | +40 27 26.2 | 2.08 | 1.9e–28.0e–5 | 1300 | 0.640.03 | –0.610.04 | –0.950.07 | |
| 414 | 00 40 30.46 | +40 27 56.0 | 5.38 | 4.1e–38.0e–5 | 19 | 0.450.23 | –0.340.21 | –0.220.39 | |
| 419 | 00 40 31.92 | +40 58 37.4 | 4.85 | 2.1e–34.0e–5 | 15 | 0.200.20 | –0.820.23 | ||
| 441 | 00 40 40.39 | +40 30 12.3 | 4.28 | 3.7e–36.0e–5 | 41 | 0.750.12 | –0.740.15 | ||
| 472 | 00 40 47.02 | +40 51 46.7 | 4.04 | 3.5e–35.0e–5 | 44 | 0.610.13 | –0.700.15 | ||
| 500 | 00 40 52.88 | +40 36 24.4 | 3.07 | 5.6e–36.0e–5 | 94 | 0.690.30 | 0.700.11 | –0.180.10 | –0.420.23 |
| 509 | 00 40 55.02 | +41 12 16.4 | 5.23 | 2.2e–34.0e–5 | 12 | 0.520.19 | –0.670.19 | ||
| 521 | 00 40 58.94 | +41 03 00.6 | 6.72 | 2.2e–35.0e–5 | 10 | 0.800.19 | –0.460.20 | –0.880.38 | |
| 560 | 00 41 08.08 | +40 31 42.4 | 4.04 | 5.6e–37.0e–5 | 53 | 0.660.11 | –0.710.12 | –0.160.40 | |
| 682 | 00 41 40.28 | +40 59 47.9 | 5.11 | 1.6e–34.0e–5 | 7.6 | 0.610.23 | –0.480.26 | 0.110.38 | –0.270.57 |
| 969 | 00 42 39.82 | +40 43 18.8 | 1.84 | 7.3e–22.0e–4 | 4800 | 0.060.02 | –0.750.02 | –0.920.07 | |
| 1079 | 00 42 55.50 | +40 59 46.4 | 3.00 | 5.1e–36.0e–5 | 110 | 0.770.09 | –0.690.11 | –0.900.37 | |
| 1083 | 00 42 56.78 | +40 57 18.5 | 3.51 | 2.0e–33.0e–5 | 28 | 0.430.14 | –0.980.09 | ||
| 1148 | 00 43 08.85 | +41 03 05.4 | 5.25 | 2.7e–35.0e–5 | 16 | 0.660.16 | –0.600.21 | ||
| 1156 | 00 43 10.43 | +41 38 50.1 | 4.80 | 2.3e–34.0e–5 | 24 | 0.980.32 | 0.250.19 | 0.100.19 | |
| 1282 | 00 43 41.57 | +41 34 06.6 | 6.59 | 2.4e–33.0e–5 | 38 | 0.080.14 | –0.960.15 | ||
| 1332 | 00 43 54.13 | +41 20 47.3 | 6.10 | 4.7e–38.0e–5 | 22 | 0.120.17 | –0.910.18 | ||
| 1370 | 00 44 04.55 | +41 58 06.5 | 5.05 | 2.8e–36.0e–5 | 21 | 0.940.14 | –0.960.14 | ||
| 1437 | 00 44 21.18 | +42 16 21.9 | 6.22 | 2.1e–36.0e–5 | 8.5 | 0.730.21 | –0.640.25 | ||
| 1481 | 00 44 34.90 | +41 25 12.7 | 5.69 | 4.2e–38.0e–5 | 20 | 0.970.11 | –0.870.17 | ||
| 1505 | 00 44 42.73 | +41 53 40.5 | 2.19 | 7.0e–35.0e–5 | 840 | 0.500.27 | –0.730.27 | 0.970.04 | 0.500.04 |
| 1534 | 00 44 50.02 | +41 52 40.9 | 3.67 | 2.8e–35.0e–5 | 26 | 0.590.19 | –0.390.17 | –0.540.31 | |
| 1548 | 00 44 55.73 | +41 56 55.2 | 4.24 | 1.9e–34.0e–5 | 20 | 0.950.13 | –0.340.19 | –0.830.34 | |
| 1608 | 00 45 17.87 | +42 05 02.1 | 6.19 | 2.4e–35.0e–5 | 14 | 0.570.20 | –0.530.25 | ||
| 1637 | 00 45 28.35 | +41 46 05.9 | 2.58 | 5.7e–35.0e–5 | 170 | 0.340.33 | 0.700.11 | –0.060.10 | –0.060.15 |
| 1669 | 00 45 38.26 | +41 12 46.9 | 5.13 | 3.4e–31.0e–4 | 16 | 0.650.31 | –0.610.38 | ||
| 1712 | 00 45 56.01 | +42 11 17.2 | 4.60 | 3.4e–37.0e–5 | 18 | 0.610.26 | 0.040.25 | 0.020.24 | –0.150.37 |
| 1732 | 00 46 02.53 | +41 45 13.2 | 4.11 | 4.3e–37.0e–5 | 28 | 0.950.64 | 0.520.19 | –0.130.17 | –0.160.30 |
| 1741 | 00 46 04.42 | +41 49 43.2 | 3.09 | 5.6e–37.0e–5 | 90 | 0.330.11 | –0.650.14 | –0.780.42 | |
| 1748 | 00 46 06.34 | +41 29 23.6 | 4.21 | 2.4e–34.0e–5 | 27 | 0.580.19 | –0.400.21 | –0.170.35 | 0.540.23 |
| 1796 | 00 46 25.39 | +41 09 38.7 | 5.06 | 9.7e–32.0e–4 | 32 | 0.330.22 | –0.480.21 | 0.330.27 | –0.590.43 |
Appendix C SDSS images
See figc1.jpg.
Appendix D Sources with unchanged classification
D.1 SNRs
D.1.1 [SPH11] 182: XMMM31 J003923.50+404419.1
[SPH11] 182 is a soft X-ray source with hardness ratios indicative of an SNR. No foreground star was found at its position. The X-ray source is coincident with the optical SNR [DDB80] 1-4, which corresponds to [BA64] 474 and [PAV78] 118. Based on these results the source was classified as an SNR by SPH11.
The optical source is clearly visible in all three emission line images of the LGGS (Fig. 2) and has a limb-brightened shell that is bright in the southeast. The diameter of the optical SNR is 16″. We confirm the SNR classification based on the [S ii]/H flux ratio (Table 3). The LGGS band images show several blue point-like sources at the position of the SNR indicating a group of young stars.
D.1.2 [SPH11] 474: XMMM31 J004047.19+405524.6
[SPH11] 474 has hardness ratios indicative of an SNR and is coincident with the optical SNR [DDB80] 1-7. A radio counterpart [GLG04] 68 was found with , which might indicate a PWN (GLG05).
From the analysis of the LGGS narrow band images, we derive an [S ii]/H flux ratio of (Fig. A2) and thus confirm the SNR identification. The source is rather compact with a diameter of 5″, corresponding to 18 pc.
D.1.3 [SPH11] 883: XMMM31 J004224.41+411729.8
[SPH11] 883 has hardness ratios indicative of an SNR and is coincident with the Chandra source [KGP02] r2-57, which has been identified as an SNR by WSK04 based on additional studies of LGGS and Very Large Array radio data.
Its optical line flux ratio is [S ii]/H = , corroborating the SNR nature. The optical source has an arc-like structure with an extent of 9″ (Fig. A4). It is brightest in the east. This source is the second closest SNR to the center of the galaxy with a galactocentric distance of about 860 pc.
D.1.4 [SPH11] 1040: XMMM31 J004249.11+412406.6
[SPH11] 1040 is coincident with the Chandra source [KGP02] r3-84, which has been identified as an SNR by WSK04, as well as with the radio source [B90] 97. Therefore, it was classified as an SNR by PFH05 and SPH11.
There is significant H, [S ii], and [O iii] emission at its position and the flux ratio of [S ii]/H = confirms its SNR nature (Fig. A4). The optical SNR has a patchy, ring-like morphology with an extent of 6″ and is brightest in the north. It is surrounded by faint, diffuse H emission.
D.1.5 [SPH11] 1050: XMMM31 J004250.47+411556.7
[SPH11] 1050 is a soft source and is coincident with the Chandra source [KGP02] r2-56, which was identified as an SNR by Kong et al. (2003). Therefore, the XMM-Newton source was classified as an SNR by SPH11. The source also has an extended radio counterpart [B90] 101. It is located at a distance of about 70″ from the galactic center (i.e., about 250 pc).
In the optical the SNR is a rather compact source with an extent of 3″ (Fig. A4). On the LGGS images, it is located at the edge of the central part of M 31 where the subtracted continuum images are saturated as can be seen on the [S ii]/H ratio image.
D.1.6 [SPH11] 1066: XMMM31 J004253.53+412551.0
[SPH11] 1066 is a bright X-ray source with a detection likelihood of . It is coincident with a Chandra source that has been classified as an SNR by KGP02 (r3-69), the optical SNR [DDB80] 1-13 ([BA64] 521), and its radio counterpart [B90] 106. Therefore, the XMM-Newton source was classified as an SNR by PFH05 and SPH11.
There is significant H, [S ii], and [O iii] emission at its position and the flux ratio of [S ii]/H = confirms its SNR nature (Fig. A4). It is slightly elongated in the north-south direction with a size of 4″ 8″, being brighter in the south. The relatively hard X-ray spectrum and the rather small extent of the source seen in the optical suggest that it is a young SNR.
D.1.7 [SPH11] 1234: XMMM31 J004327.93+411830.5
[SPH11] 1234 is the brightest source in our list with and is a soft X-ray source. It is coincident with the Chandra source [KGP02] r3-63 identified as an SNR by Kong et al. (2002a), the optical SNR [MPV95] 2-033, and the radio source [B90] 142. Therefore, it was classified as an SNR by PFH05 and SPH11.
Its XMM-Newton spectrum is best fitted with a combination of two thermal components (see Sect. 3.1). The soft X-ray spectrum indicates that it is not strongly absorbed. In addition, since there is significant emission even below 0.5 keV but almost no emission above 1 keV this source might be a rather old SNR. The optical source seen on the LGGS H, [S ii], and [O iii] images has a horse-shoe shaped structure with an extent of 8″, corresponding to pc (see Fig. A6). It is brighter on one side (northwest) and is open to the other side (southeast), typical for SNRs evolving in a medium with a density gradient. There is also significant extended diffuse emission visible in the optical emission line images around the SNR, which indicates that the SNR might be embedded in a superbubble. The X-ray spectrum of the SNR might therefore be contaminated by thermal emission from the interstellar gas in its environment.
D.1.8 [SPH11] 1275: XMMM31 J004339.27+412653.0
[SPH11] 1275 is a bright source () embedded in a region with soft diffuse emission. The X-ray position agrees very well with the optical SNR [MPV95] 3-059, which is also a radio source ([B90] 158). Therefore, the source was classified as an SNR by PFH05 and SPH11.
Its [S ii]/H flux ratio is 0.90.2. The SNR has a half-circular shape in the optical, which is open to the northwest and has an extent of 7″ (Fig. A6).
D.1.9 [SPH11] 1291: XMMM31 J004343.97+411232.7
[SPH11] 1291 is a soft X-ray source and has been classified as an SNR based on its positional coincidence with the radio source [B90] 166, which is an extended continuum source. O06 also discussed the possibility of this source being an SNR ([O06] 4).
In the optical it is located in between two diffuse sources in the east and the south visible in H, most likely H ii regions (Fig. A6). There is neither significant [S ii] nor [O iii] emission. Therefore, the source is most likely a non-radiative SNR.
D.1.10 [SPH11] 1328: XMMM31 J004353.69+411204.4
[SPH11] 1328 is a soft X-ray source coincident with the optical SNR [BW93] K230A (Fig. A7) and was thus classified as an SNR by PFH05 and SPH11. Radio emission that fills the western half of the gap between the optical line emission was also found.
In the optical, the source consists of brighter regions in the north and the south, which are both extended to the east-west direction, thus forming a parallel structure. The entire structure has an extent of 15″.
D.1.11 [SPH11] 1351: XMMM31 J004358.25+411328.7
[SPH11] 1351 is a soft source coincident with the optical SNR [BW93] K252 ([DDB80] 18) and the radio source [B90] 199. Therefore, it was classified as an SNR by PFH05 and SPH11.
In the optical the source has an extent of 12″ and is located on the southern edge of the more extended structure visible on the H image (Fig. A7). The [S ii]/H flux ratio of fulfills the criterion for SNRs. In the optical, the source has a half-shell structure in the south with filaments extending to the north. In general, it has a patchy morphology.
D.1.12 [SPH11] 1386: XMMM31 J004409.53+413320.9
[SPH11] 1386 is a soft X-ray source. In the catalogues of PFH05 and SPH11 it was classified as an SNR based on the positional coincidence with the radio source [B90] 217.
It is located inside the H ii region [WB92] 315, which can also be seen in the LGGS images (Fig. A8). The [S ii]/H flux ratio at the X-ray position is low (). Therefore, the source is likely a non-radiative SNR.
D.1.13 [SPH11] 1410: XMMM31 J004413.55+411954.3
[SPH11] 1410 is a soft source coincident with the optical SNR [BW93] K327 with the radio counterpart [B90] 224. Therefore, it was classified as an SNR by SPH11.
The X-ray position coincides with a knot with an extent of 4″ in the optical emission line images located at the southern edge of a more extended diffuse emission (Fig. A8). The extended emission is likely an H ii region, whereas the optical SNR has a flux ratio of [S ii]/H = .
D.1.14 [SPH11] 1497: XMMM31 J004438.91+412528.8
[SPH11] 1497 is a faint soft source and has been classified as an SNR by PFH05 and SPH11 based on its coincidence with an SNR candidate suggested by [MPV95]. It is the counterpart of the optical and radio SNR [BW93] K506A, [B90] 278.
Its morphology of the optical line emission is that of a circular shell with a diameter of 12″ and is best seen in the [S ii] image (Fig. A9). There is a bright blob-like H source east to the SNR. While the SNR shell has an [S ii]/H flux ratio of 1.0, the H blob makes the [S ii]/H ratio of the total SNR lower ().
D.1.15 [SPH11] 1522: XMMM31 J004447.19+412918.7
[SPH11] 1522 is a soft X-ray source and coincides with the optical SNR [BW93] K548 and was thus identified as an SNR by PFH05 and SPH11.
A shell with an extent of 10″ is seen on the LGGS images, which is slightly elongated in the east-west direction (Fig. A9) and is brighter to the west. Its [S ii]/H flux ratio of is clearly indicative of an SNR. A nebula bright only in H with a similar size is located northeast of the SNR.
D.1.16 [SPH11] 1539: XMMM31 J004452.82+415458.1
[SPH11]1539 is the X-ray counterpart of the optical SNR [BW93] K594 and its radio counterpart [B90] 316. Therefore, it was identified as an SNR by PFH05 and SPH11.
It has an extent of 8″ in the optical and is brighter in the north (Fig. A10). Its [S ii]/H flux ratio is 1.00.4.
D.1.17 [SPH11] 1587: XMMM31 J004510.59+413251.3
[SPH11] 1587 is a faint, soft X-ray source and is positionally coincident with a shell-type radio source [B90] 354 with an offset of 3″. It has thus been classified as an SNR by SPH11.
No optical emission is detected at its position. Therefore, the SNR seems to be non-radiative.
D.1.18 [SPH11] 1593: XMMM31 J004512.31+420029.6
[SPH11] 1593 is a faint, soft X-ray source and is coincident with a radio source [B90] 365 with an amorphous shape and was thus classified as an SNR by SPH11.
Faint shell-like emission can be seen in H, [S ii], [O iii] images (Fig. A10) with a diameter of about 30″. Its optical flux ratio [S ii]/H is 1.00.4, indicating its SNR nature. Therefore, we also classify this source as an SNR, most likely a highly evolved SNR. It is so far the largest X-ray SNR detected in M 31.
D.1.19 [SPH11] 1599: XMMM31 J004513.94+413615.5
[SPH11] 1599 is the X-ray counterpart of the optical SNR [DDB80] 19 ([BW93] K717) and the radio source [B90] 367. It was identified as an SNR by PFH05 and SPH11.
The optical SNR has an extent of 10″. It is bright in the west and has a diffuse extension to the east (Fig. A10). The X-ray poisition coincides with the bright part in the optical.
D.1.20 [SPH11] 1793: XMMM31 J004624.71+415541.6
[SPH11] 1793 is a soft X-ray source coincident with the source [PFH05] 745. The X-ray source has an extended radio counterpart [B90] 472 and was thus classified as an SNR by PFH05 and SPH11.
Only faint emission is seen on the LGGS images (Fig. A12). The optical flux ratio [S ii]/H is 0.70.3. Based on the X-ray properties and the coincidence with a radio continuum source, we also classify this source as an SNR, which is most likely non-radiative.
D.1.21 [SPH11] 1805: XMMM31 J004627.91+420806.7
[SPH11] 1805 is a soft X-ray source coincident with the radio source [B90] 476 and was thus classified as an SNR by PFH05, O06, and SPH11.
Very faint optical line emission is detected on the LGGS images. The [S ii]/H flux ratio of 3.01.1 is indicative of an SNR.
D.2 SNR candidates
D.2.1 [SPH11] 294: XMMM31 J003958.28+402726.2
[SPH11] 294 is a bright X-ray source with hardness ratios indicative of an SNR. As no foreground star is detected it has been suggested as an SNR candidate by PFH05 and SPH11.
We have determined H and [S ii] fluxes from the LGGS images, however, the source is very faint (Fig. A1). Therefore, we keep the classification of this source as an SNR candidate. If it is an SNR, the optical fluxes indicate that it is likely non-radiative.
D.2.2 [SPH11] 414: XMMM31 J004030.46+402756.0
[SPH11] 414 is a hard source and thus was not classified as an SNR candidate based on the hardness ratios but has been suggested as an SNR candidate based on the positional coincidence with the radio source [GLG04] 198 with a radio spectral index of . Its radio properties indicate emission from a PWN (GLG05).
We detect neither H, [S ii], nor [O iii] emission on the LGGS images (Fig. A1). Therefore, if the source is an SNR, it has to be non-radiative. A PWN might produce hard X-ray emission. Based on the radio coincidence, we keep its identification as an SNR candidate.
D.2.3 [SPH11] 419: XMMM31 J004031.92+405837.4
[SPH11] 419 is a soft X-ray source with hardness ratios indicative of an SNR. No optical source is detected at its position that might be a foreground star. Therefore, it has been classified as an SNR candidate by SPH11.
We do not detect any emission in the narrow-band filter images of the LGGS (Fig. A1). If the source is an SNR it has to be non-radiative. Because of lack of additional information, we keep the SNR candidate classification.
D.2.4 [SPH11] 441: XMMM31 J004040.39+403012.3
[SPH11] 441 is a soft X-ray source with hardness ratios indicative of an SNR. No foreground star was found at its position. Therefore, it has been classified as an SNR candidate by PFH05 and SPH11.
D.2.5 [SPH11] 521: XMMM31 J004058.94+410300.6
[SPH11] 521 is one of the faintest X-ray sources with a detection likelihood of . Its hardness ratios suggest that it is an SNR candidate. No optical counterpart was found that could be a foreground star. It was therefore proposed as an SNR candidate by PFH05 and SPH11.
The X-ray source seems to be surrounded by a very extended optical source, which is visible in H, [S ii], and [O iii] (Fig. A2) and has a low flux ratio [S ii]/H = , hence is an H ii region. The X-ray source therefore remains an SNR candidate.
D.2.6 [SPH11] 560: XMMM31 J004108.08+403142.4
[SPH11] 560 is a soft X-ray source, which was classified as an SNR candidate by PFH05 and SPH11 based on its hardness ratios and the lack of a foreground star as a possible optical counterpart.
Faint H and [S ii] emission was measured at its position on the LGGS images. This source thus remains an SNR candidate.
D.2.7 [SPH11] 969: XMMM31 J004239.82+404318.8
[SPH11] 969 is a bright X-ray source with a detection likelihood of . Its hardness ratios suggest that it is an SNR candidate. As no foreground star was found, the XMM-Newton source was suggested to be an SNR candidate by SPH11. The X-ray source has also been detected with Chandra ([WGK04] s1-84).
There is neither a point source nor significant extended emission in the optical at and around the source. Without any confirmation in optical or radio, this source is still classified as an SNR candidate.
D.2.8 [SPH11] 1083: XMMM31 J004256.78+405718.5
[SPH11] 1083 is a soft X-ray source with no foreground star at its position and hence has been classified as an SNR candidate by SPH11.
No optical source is detected at its position on the LGGS images. Therefore, if it is an SNR, it is non-radiative. The source remains an SNR candidate.
D.2.9 [SPH11] 1282: XMMM31 J004341.57+413406.6
[SPH11] 1282 is a soft X-ray source with no foreground star as a possible counterpart and thus was classified as an SNR candidate by SPH11. PFH05 classified the X-ray as a candidate for a super-soft source.
There is faint optical line emission on the LGGS image with an extent of 14″ (Fig. A6). The flux ratio of is not significantly high enough to classify the optical source as an SNR. It is very diffuse and patchy, similar to [SPH11] 1148 and 1328. This source still remains an SNR candidate based on its X-ray hardness ratios.
D.2.10 [SPH11] 1332: XMMM31 J004354.13+412047.3
[SPH11] 1332 is a soft X-ray source with no foreground star as possible counterpart, which was classified as an SNR candidate by PFH05 and SPH11 based on its hardness ratios.
D.2.11 [SPH11] 1669: XMMM31 J004538.26+411246.9
[SPH11] 1669 is a faint soft X-ray source, which was classified as an SNR candidate by SPH11 based on its hardness ratios and the lack of a foreground star as its possible counterpart.
The position of the X-ray source was not observed by the LGGS. No optical counterpart is found on the SDSS-III images (Fig. C, upper left). Radio emission has not been detected at its position so far either. This source remains an SNR candidate based on its X-ray properties.
D.2.12 [SPH11] 1748: XMMM31 J004606.34+412923.6
[SPH11] 1748 is a faint soft X-ray source, which marginally fulfilled the hardness ratio criterion for SNR candidates and has no optical counterpart indicative of a star. Therefore, it was classified as an SNR candidate by SPH11.
The LGGS did not cover the position of the X-ray source. The SDSS-III images show no source at the XMM-Newton position inside the error circle (Fig. C, upper right). A radio counterpart is not known either. Therefore, this source remains an SNR candidate.
D.2.13 [SPH11] 1796: XMMM31 J004625.39+410938.7
[SPH11] 1796 was classified as an SNR candidate by PFH05 and SPH11 based on and and the lack of a foreground star at its position.
The source was not covered by the LGGS. The SDSS-III images show no source inside the XMM-Newton positional error circle (Fig. C, lower panel). A radio counterpart is not known either. With no additional information available, this source remains an SNR candidate.
D.3 No SNRs
D.3.1 [SPH11] 1121: XMMM31 J004303.70+413717.2
[SPH11] 1121 is a hard source and was not suggested to be an SNR candidate by SPH11. However, we have studied this source because of a coincident diffuse optical emission seen in H and [S ii].
Diffuse emission is seen both on the H and [S ii] LGGS images (Fig. A5). However, the flux ratio is [S ii]/H = , not indicative of an SNR. The diffuse optical source at and north of the X-ray emission is most likely an H ii region. As this source is hard in X-rays and there is no optical counterpart indicative of an SNR, we do not classify it as an SNR candidate and keep the hard classification.
D.3.2 [SPH11] 1461: XMMM31 J004428.62+414948.7
[SPH11] 1461 is a soft source and was classified as a foreground star candidate by SPH11 because stars with characteristic log() values are found in the X-ray error circle, with an optically red object close to the center of the X-ray error circle. However, the H image also revealed a diffuse source right next to the X-ray source in the north.
The diffuse optical source is visible in H, [S ii], and [O iii] emission (Fig. A8). The flux ratio [S ii]/H = , indicative of an H ii region. Therefore, the origin of the soft X-ray emission seems to be either a star or an H ii region and the source is no SNR candidate.
D.3.3 [SPH11] 1468: XMMM31 J004430.56+412306.2
[SPH11] 1468 is a hard X-ray source. As diffuse H emission was found in the optical we considered this source for further studies.
The LGGS images show an extended diffuse source in H and [S ii] (Fig. A8). The [S ii]/H flux ratio is . This value is at the border between SNRs and H ii regions. While the more extended optical source seems to be an H ii region, we cannot rule out that there is an SNR located at the same position. However, as the X-ray emission does not indicate an SNR, we do not classify [SPH11] 1468 as an SNR candidate.
D.3.4 [SPH11] 1611: XMMM31 J004518.44+413936.3
[SPH11] 1611 is a hard X-ray source coincident with [PFH2005] 626 and [SBK2009] 220 and was classified as a hard source by SPH11. Diffuse optical H [S ii], and [O iii] emission was found around the X-ray source.
The extended optical source can be seen on the LGGS emission line images (Fig. A11). The X-ray source is located close to the northern rim of the optical source, coincident with a brighter shell-like structure. The entire optical source has a flux ratio of [S ii]/H = 0.4 – 0.5. The optical source is most likely a large H ii region. The X-ray hardness ratios do not even marginally indicate an SNR. Therefore, we do not consider this sources as an SNR candidate.