Molecular and atomic line surveys of galaxies II:
Unbiased estimates of their star formation mode
Abstract
We make use of our ‘minimal’ cold interstellar medium (ISM) emission line model that predicts the molecular and atomic line emission per unit dense, star-forming gas mass (Geach & Papadopoulos 2012; Paper I) to examine the utility of key line ratios in surveys of the so-called star formation ‘mode’ as traced by =. We argue that and its proxies provide very sensitive, extinction-free discriminators of rapid starburst/merger-driven versus secular quiescent/disk-like stellar mass assembly, with the most promising diagnostic to be applied in the near-future being CO J() / [C i]() . These lines are accessible across nearly the full range (thus covering the bulk of galaxy evolution) with the Atacama Large Millimeter Array. In addition to their diagnostic power, another advantage of this combination is the similar observed frequencies ( GHz) of the lines, resulting in nearly spatially–matched beams for a fixed aperture, thus mitigating the effects of resolution/morphology bias in the interpretation of galaxy-averaged line ratios. Finally we discuss the capability of deep blind redshift surveys with the high frequency component of the Square Kilometer Arrray (SKA) in discovering H2-rich galaxies with very low values. These could be the progenitors of starburst galaxies seen prior to the onset of star formation; such galaxies could be a class of extreme outliers from local (gas surface density)–(star formation rate) scaling laws, which would exclude them from current star formation or stellar mass selected samples. Our conservative model suggests that SKA could detect such systems residing at at a rate of 20–200 per hour.
Subject headings:
galaxies: ISM — galaxies: starburst — galaxies: evolution — cosmology: observations — ISM: molecules: CO, HCN1. Introduction
The prevailing ‘mode’ of star formation in the distant Universe, namely merger-driven starbursts versus isolated star-forming gas-rich disks – with their H2 gas as traced by its carbon monoxide (CO) line emission – is now a topic of intense interest after the discovery of numerous galaxies at high redshifts with gas fractions above 50% that seem to follow the latter mode (e.g. Daddi et al. 2010; Tacconi et al. 2010). Nevertheless, the indicators used in such studies, namely the near Galactic value of the factor, and low-excitation low-J CO spectral line energy distributions (SLEDs) are strongly degenerate when it comes to the star formation mode (Papadopoulos et al. 2012) and thus cannot be used to securely argue for a bi-modal distribution of star formation modes. Moreover using ratios of single CO line luminosities (used as measures of total molecular gas mass) to infrared luminosity (used as star formation rate proxy) as mode indicators is fraught with uncertainty because the value of the remains both highly uncertain and dependant on galaxy type, molecular gas surface density and kinematic state, as well as average star formation activity (see Narayanan et al. 2011 for a recent exposition).
In the local Universe the star formation ‘mode’ seems to be very well (i.e. uniquely) indicated by the fraction of the total gas reservoir residing in the dense phase: , a fact that can be easily exploited in high redshift galaxy surveys. In this article, we explore practical means of determining the star formation mode of galaxies, using low-J CO or [C i]() and hydrogen cyanide (HCN) line surveys as the most effective tool for determining = as a function of redshift. Selecting galaxies through is independent of the various selection criteria used in traditional galaxy surveys, and is unaffected by degeneracies of CO SLEDs in determining (Papadopoulos et al. 2012).
For the purposes of this work we seek good proxies of the dense gas mass fraction and investigate their observational prospects in the distant Universe, especially in survey mode, but will not delve into the details of how such proxies can be translated into actual values. Multi-J and multi-species molecular line observations are needed for this (e.g. Greve et al. 2009), which will soon become routine for the Atacama Large Millimeter Array (ALMA). We note that the prize from actual estimates of values and direct measurements of turbulent line widths in the molecular gas of distant star-forming galaxies with sensitive imaging interferometers like ALMA (see Swinbank et al. 2011 for an example for a gas-rich starburst at ) will be to properly investigate proposed universal turbulence-regulated star formation theory for galaxies (Krumholz & McKee 2005).
Finally we outline some of the unique discovery possibilities that very deep low-J CO () surveys with the Square Kilometer Array (SKA) can offer when it comes to gas-rich systems with very low values that can only be discovered with blind surveys. Such galaxies will have negligible HCN J() and CO line emission, and would be extreme outliers of the Schmidt–Kennicutt relation (Kennicutt 1998), unselected by current high-redshift galaxy surveys as these are based, directly or indirectly, on the star formation rate (SFR, e.g. optical/near-IR lines from H ii regions, (sub)mm dust thermal continuum, and cm non-thermal continuum). This population would be valuable for extending our understanding of the gas properties and early star formation histories of massive galaxies. Where relevant, we assume a flat cosmological model, with , and km s-1 Mpc-1.
2. Practical investigations of the star formation mode of galaxies
2.1. Theoretical basis
Paper I presented a model for the abundance of molecular and atomic line-emitting galaxies seen across cosmic time, using a ‘minimal’ model for the cold molecular interstellar medium (ISM). We envision that future surveys will assemble large samples of high-z systems with bright molecular line mission, be it in a totally blind sense, or by (sub)mm/cm spectroscopic follow-up of a SFR (most likely proxied by the submm continuum) or stellar mass limited sample (achievable with deep optical/near-infrared surveys). A survey of the star formation mode would be a powerful probe of galaxy evolution, since it would perform the dual task of measuring the evolution of the total gas fraction of star-forming galaxies, the nature of the star formation (burst or secular), and a more accurate prediction of the rate of consumption of the cold gas reservoirs.
A prominent bi-modality of the values in merger-driven versus isolated disk star formation is actually expected as a general characteristic of supersonic turbulence because of the much larger (5–30) turbulent line widths observed in CO line emission in mergers/ultraluminous infrared galaxies (ULIRGs) than in isolated spiral disks (Downes & Solomon 1998). This difference is expected to be a general characteristic of merger versus isolated disk systems (Narayanan et al. 2011). The resulting difference in the corresponding 1-dimensional average Mach numbers (where ) leads to much higher dense gas mass fractions in the ISM of mergers than in isolated disks given that the probability distribution function of the molecular gas density in supersonic turbulence is well approximated by a log-normal distribution with a dispersion of (Padoan & Nordlund 2002).
The very enhanced dense gas mass fractions molecular gas mass fraction expected to be in structures with overdensities (where , and is the gas density) is then given by
| (1) |
The typically large velocity dispersions of (30–140) km s-1 in the molecular gas disks of the merger systems found in ULIRGs (and recently even in a molecular gas disk fueling star formation in an spectacular starburst at , see Swinbank et al. 2011), with corresponding large will dramatically extend the gas density probability distribution function towards high values where much of the molecular gas mass will lie, quite unlike the less turbulent molecular gas in isolated disks (see Figure 1). Thus for giant molecular clouds (GMCs) in typical spiral disks only 3% of their mass is expected to be at overdensities (5104 cm-3 for a typical GMC with cm-3) while for the highly turbulent gas in mergers this is 45%, and can be even higher (e.g. Greve et al. 2009).

2.2. Practical tracers of the star formation mode
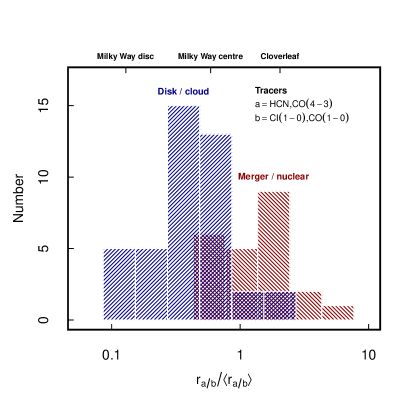
In the following we consider various combinations of molecular and atomic lines as proxies of . A summary from available line data for mostly local galaxies can be found in Figure 2 where we plot normalized line ratios for a sample of observations of (i) quiescent star forming disks and dark clouds and (ii) galactic nuclei, mergers and starburst galaxies, compiled from the literature (Gao & Solomon 2004, Israel et al. 1998, 2001, 2003, Barvainis et al. 1997, White et al. 1994, Petitpas & Wilson 1998). We define the normalized ratios as , where and correspond to (for example) the line brightness luminosities of the dense and total gas tracers HCN J() and CO J() with representing the average over the entire sample.
It is clear from Figure 2 that carefully-picked line diagnostics can sensitively distinguish between ‘disk’ and ‘burst’ mode, with dividing the two classes. Individual tracers (e.g. HCN J() and CO J() line ratios) can be even more sensitive than what the distribution in Figure 2 indicates, with factors of 10 difference between ‘disk’ and ‘burst’ mode (see §2.2.1). Moreover, the sample presented in Figure 2 is dominated by local systems while high redshift observations present more of a challenge as global line measurements may represent wide spatial averages (smearing out the line ratio for composite systems), but also because the observed frequencies of lines available in the local Universe will be redshifted out of the current range of sensitive facilities for certain important cosmological spans of time.
We now will now discuss several of these tracers in more detail, highlighting their relative merits with a view to identifying diagnostic tools that will be suitable for practical surveys of the star formation mode of galaxies over large spans of cosmic time.
2.2.1 HCN J() / CO J() , HCN J() / CO J()
This is the cleanest indicator available, with local studies showing a clear bi-modality for the ISM in merger-driven starbursts versus isolated disks with lower SFRs in the local Universe (Gao & Solomon 2004), with HCN tracing the dense, star-forming gas mass, and low-J CO tracking the total gas reservoir. Arguably this line combination is the most direct tracer of ; extensive observations of local galaxies show this line ratio to be an excellent way to discriminate between different modes, with high values of – found exclusively in compact, merger-driven, extreme starbursts while – for isolated spiral disks with extended star formation (e.g. Solomon et al. 1992; Gao & Solomon 2004).
Observing HCN J() ( GHz) and CO J() ( GHz) has the disadvantage that, although this line combination will be accessible with ALMA for local systems (important for an even more robust calibration in terms of ), by CO J() is redshifted out of the ALMA bands and remains inaccessible until in the cm bands (and accessible with other cm-wave facilities). In addition, due to the broad telluric absorption feature at GHz, there will be a broad HCN J() and CO J() ‘desert’ in the interval, limiting the use of this tracer for intermediate redshift work.
Due to the aforementioned shortcomings, this particular indicator will only be effective for probing very local galaxies rather than those at cosmologically significant redshifts of , and thus cannot satisfactorily measure over the peak of the global star formation rate density in a well-sampled, tomographic manner. However, given the small range of both CO and HCN –, the transition of these two molecules can also be used to the same effect. This allows ALMA to survey up to as the rest frequencies of CO J() and HCN J() are at 230.538 GHz and 177.264 GHz respectively. HCN J() can be accessed by ALMA out to , and HCN J() out to . Given the order of magnitude differences expected for the -type of ratios between mergers and isolated disks it is very likely that even HCN J() and ratios such as HCN J() / CO J() or HCN J() / CO J() will remain practical proxies of out to using ALMA. Moreover, given the tremendous sensitivity boost at (sub)mm wavelengths that ALMA represents, the necessary calibration of such ‘hybrid’ HCN/CO ratios in terms of will be trivial for large numbers of star-forming galaxies in the local Universe.
2.2.2 HCN J() / [C i]() , HCN J() / [C i]()
This is a potentially powerful tracer of , with – as mentioned above – the HCN J() and HCN J() line luminosities proportional to the dense star-forming gas mass, and [C i]() scaling with total molecular gas mass, but with many advantages over low-J CO lines (see Paper I). The higher rest frequency of [C i]() ( GHz), compared to HCN J() means that the corresponding [C i]() observations would be conducted with ALMA Bands 6 and lower.
Local data support the notion of the ratio of HCN J() and [C i]() lines as a proxy, with 0.55–2.2 observed in ULIRGs ( [C i]() data presented in Papadopoulos & Greve 2004; Greve et al. 2009, and HCN J() data from Gao & Solomon 2004). In comparison, for disk-dominated quiescent galaxies, , although it can rise up to 0.5 for vigorously star-forming disks like that of NGC 1068 (using HCN J() data from Gao & Solomon [2004] and [C i]() data from Israel et al. [2009]). Further benchmarking work on this ratio as a practical mode indicator must be done locally (now possible from high altitude dry sites like the Chajnantor plateau) before applying it in the distant Universe. A larger body of multi-J HCN line data along with [C i]() measurements and models of the abundance111It must be stressed that abundance uncertainties affect all H2 mass measurements utilizing optically thin lines (e.g. 13CO). Among those atomic carbon is the species with the simplest, mostly cosmic ray controlled chemistry. are necessary to both benchmark -type ratios as indicators as well as help disentangle the effects of high SFRs (and thus [C/H2]-boosting cosmic rays) on this valuable mode indicator (see also §2.2.4).
2.2.3 12CO/13CO ratios for
The ratios are not proxies of but rather of the turbulent velocity fields of giant molecular clouds in star-forming galaxies. Numerous studies have shown that in disks, with low values found in Milky Way type systems and larger ones in vigorously star-forming disks (e.g. Casoli et al. 1992; Aalto et al. 1995; Papadopoulos & Seaquist 1999). Ratios are found exclusively in merger systems and are thought to be the result of the highly turbulent ISM and the enhanced gas temperatures produced by the dissipation of their supersonic turbulence (Aalto et al. 1995; Greve et al. 2009 and references therein).
The advantage of using isotopologue line ratios as proxies of merger versus isolated-disk star formation modes, even if such ratios are not proxies of , is obvious: the convenience yielded by their frequency proximity. Wide bandwidth receivers allow the possibility of deep surveys with simultaneous CO and 13CO line observations. Objects with would be considered as harbouring merger-driven star formation, while all the rest would be in the disk mode. This method can safely be used up to , partly because of lack of local 13 CO J() or higher-J line data (the 13 CO J() line lies precariously close to an atmospheric absorption feature) but also because higher-J CO lines will progressively cease to be good tracers of the average velocity fields of molecular clouds and begin tracing their self-gravitating, dense regions (Ossenkopf 2002). Nevertheless recent measurements of a large in a distant ULIRG-hosting QSO (Henkel et al. 2010) indicate that such a diagnostic may remain a good star formation mode indicator up to .
Finally we note that a competing explanation for the very high ratios observed in all ULIRGs exists, attributing them to much higher abundances in such systems (Casoli et al. 1992; Henkel & Mauersberger 1993 and references therein), possibly caused by a different stellar initial mass function in merger/starburst systems. If this is true it would make a less ‘clean’ star formation mode indicator unless a strong link can be proven between such isotopic enhancements and merger-driven star-forming systems.
2.2.4 CO J() / [C i]()
The ratio has the key advantage that the lines used have similar rest frequencies, ( GHz, and thus similar beams for a given aperture), while both remain accessible to ALMA across a large span of cosmic time. It is assumed that CO J() traces mostly dense star-forming gas, an expectation borne out both by observations (e.g. Petitpas & Wilson 1988; Nieten et al. 1999; Papadopoulos et al. 2012) as well as models of emergent CO line emission from turbulent molecular clouds (Ossenkopf 2002). Finally, both lines benefit from a positive k-correction with respect to lower-J lines making them suitable for (H2 mass)-sensitive high-z work.
Unfortunately, their relatively high frequencies and the lack of multi-beam receivers at such frequencies has prevented the assembly of a large body of CO J() and [C i]() line data in the extragalactic domain. Nevertheless, enough data is assembled to examine if a significant bi-modality of indeed exists for starburst environments dominated by large dense gas reservoirs (typical of merger-driven systems) versus low-SFR environments in disks. In this comparison we also consider CO J() and [C i]() data obtained for galactic nuclei (e.g. NGC 253) including that of the Galactic Center as representative of the average molecular ISM properties of the merger-driven starbursts in ULIRGs (the high turbulence yielding also very high values in galactic centers). For such environments we obtain (data from Israel et al. 1995, 1998, 2001, 2003; Petitpas & Wilson 1998; Barvainis et al. 1997; Papadopoulos & Greve 2004; Papadopoulos et al. 2004) where the dispersion represents that of the measured values. These include the Galactic Center, the nuclei of various nearby galaxies (NGC 253, Maffei 2, M 83), a distant strongly-lensed QSO (The Cloverleaf at ) and a local ULIRG/QSO (Mrk 231). For disk-dominated star-forming environments, the available literature data yield – with the lowest value (0.43) found for the outer Galaxy and a quiescent cloud in M 31 (0.45). Somewhat higher values are obtained for the inner Galaxy (0.83) and star-forming spirals such as NGC 4826 and NGC 3079 (1.3, and see Figure 2).
Thus it is seems that the ratio can be a practical star formation mode indicator in the ALMA regime, with differences up to factors of 10 between mergers and disk-dominated systems. We note however that the intense cosmic ray fluxes expected in starburst environments can significantly boost the [Ci/H2] abundance ratio (e.g. Papadopoulos et al. 2004 and references therein), reducing the ratio in extreme starbursts. This may be happening in the inner 500 pc of M 82 where a rather low is measured (White et al. 1994). Chemical models of [Ci/H2] as a function of average cosmic ray energy densities (SFR density) are necessary to account for such effects as well as reducing the [Ci/H2] abundance uncertainties (also needed for (H2) estimates when using the the [C i]() line luminosity). We expect that even crude models of a SFR-dependant (i.e. cosmic ray-dependant) [Ci/H2] average abundance will yield (cosmic rayGalactic) ratios (i.e. referenced to a common Galactic cosmic ray energy density) that will be even more sensitive to (and thus the star formation mode) by much reducing the little overlap that exists for this currently cosmic ray-uncorrected star formation mode proxy (and ) in Figure 2.
2.3. CO J() and [C i]() line flux predictions and the design of a practical star formation mode survey
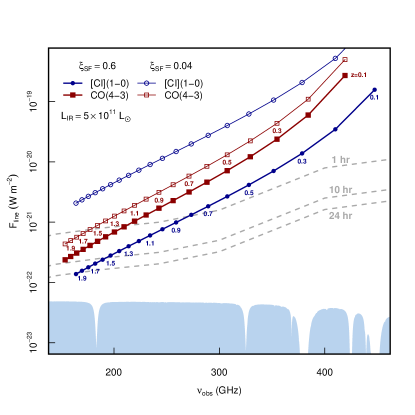
In light of the distinct advantages that this diagnostic offers for high-z studies, in Figure 3 we plot the fluxes of the [C i]() and CO J() lines for a galaxy at undergoing a burst () and disk-mode star formation (). To calculate the line fluxes, we use our minimalist ISM model presented in Paper I, assuming the ‘supervirial’ and ‘virial’ versions of the model for the burst and disk mode respectively (see §3 of Paper I for further details). The [C i]() line flux is estimated from the total gas mass following equation 11 of Papadopoulos, Thi & Viti (2004), adopting an excitation value of (where is the ratio of the column density of gas in level to the ground state, appropriate for the lower temperature and excitation conditions when averaged over a global gas reservoir. The line ratios predicted from our model are for and for ; in agreement with the normalized values presented in Figure 2.
We compare the predicted line fluxes to the 5 sensitivity (for channels of 300 km s-1) of full-power ALMA (assumed to be 50 antennas) in integrations of 1, 10 and 24 hours. This highlights the suitability of this line combination as a tool for surveys of the star formation mode, with both CO J() and [C i]() lines detectable in realistic times for relatively normal galaxies over the full span of cosmological time pertinent to galaxy evolution in both disk and burst modes. The similarity of the line frequencies are key, because they provide nearly spatially matched beams (for a given dish, and in the case of interferometers, array configurations222In Paper I and here, we have assumed the most compact array configuration will be used in survey mode.), and this can be critical in mitigating the effect of any structural bias in the interpretation of such line ratios due to the ‘mixing’ of line emission from systems with different star formation modes that may exist in relative close proximity in merger configurations (e.g. Ivison et al. 2010). Moreover, in the cases of well-resolved individual systems the ratio can give a quick approximate ‘reading’ of the gas surface density ratio as a function of position within the galaxy. This level of detail, while certainly of interest to other types of studies concerning, for example, the detailed gas dynamics and its inward transport in galactic disks, will still be valuable for uncovering ‘milder’ merger systems where the original disk is not destroyed but its is nevertheless enhanced by minor merger events.
3. Searching for H2-rich galaxies with ultra-low star formation rates in the distant Universe
One of the most exciting aspects of deep blind molecular line surveys is their potential to discover gas-rich systems with very low levels of star formation; i.e. very low . This could be a new class of objects that may be currently omitted by even the deepest galaxy surveys as these depend always on the SFR either directly (e.g. optical/near-infrared lines from H ii regions) or indirectly (non-thermal cm continuum, (sub)mm dust continuum). The SKA and its pathfinders can search for the H i phase of such systems while deep low-J CO and [C i]() line observations (the latter with ALMA) can reveal their molecular gas reservoir. Of course the existence of the latter and its detectability via CO and [C i]() lines assumes some significant metal enrichment of its ISM (so H2 can form within reasonable time and CO, [C i]() can be there to trace it) and thus some initial star formation episode. This need not contradict very low SFRs in the subsequent evolution of such systems, as a combination of structural properties (e.g. large thin disks), star formation feedback, and very different average ISM properties (very low density molecular clouds with little molecular cooling) may act to suppress SFRs over long periods of time.
This has already been shown possible, albeit for short periods of time, for gas-rich and metal-poor disks with otherwise typical structural characteristics (Papadopoulos & Pelupessy 2010). During such periods these systems can undergo ‘bursts’ of very inefficient SF (as well as ‘bursts’ of very efficient star formation) that would place these systems as extreme deviants of the local Schmidt-Kennicutt (S–K) SFR/gas density scalings. Regardless whether H2-rich galaxies with ultra-low SFRs are simply a) short (S–K)-deviant periods over much longer lifetimes of otherwise normal SF galaxies (e.g. ‘pre-starbursts’: gas-rich systems seen just prior to a burst of intense star formation), or b) a completely new class of objects widely spread across cosmic epoch, deep low-J CO and [C i]() blind line surveys are the way to find them. The [C i]() line is particularly promising because of its large positive k-correction (with respect to low-J CO lines) yet easy excitation, and its potential to trace the metal-poor ISM with much of CO dissociated by far-UV radiation (or simply never formed in sufficient abundances) leaving [C i]() and [C ii] as the dominant form of carbon. On the other hand, the SKA will have the sensitivity and field of view making it favourable for searching for low-J CO at high-redshift compared to [C i]() in the ALMA bands. We note that the [C ii] line can trace such ISM much more sensitively than [C i]() but unfortunately it becomes accessible to sensitive ALMA bands only for (Figure 2 in Paper I), and it cannot be easily ´´translated´´ to total molecular gas mass like the latter.
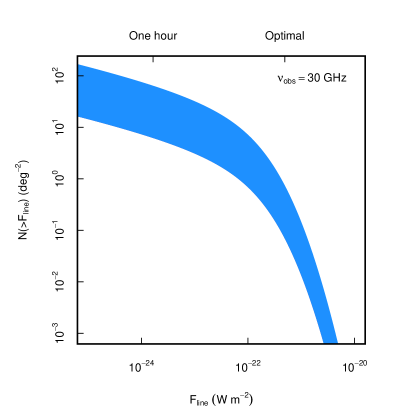
Here we consider a naïve model, where it is assumed that every star-forming galaxy goes through a brief pre-starburst phase prior to the onset of star formation, such that the abundance of sources is simply proportional to number of galaxies contributing to the infrared luminosity density used in our abundance model (Paper I): . We assume a pre-starburst ‘duty cycle’ of % and ‘low’ mode of , such that the majority of gas is in the cold, quiescent phase. Clearly the SKA with its sensitivity, wide field of view and access to low-J CO lines at is the most suitable facility for a search of pre-starburst galaxies. We present the cumulative number counts of CO J() emitters at GHz (assuming an instantaneous bandwidth of 4 GHz) and % in Figure 4. Operating at the ‘optimal’ flux limit that maximizes the detection rate for a fixed observing time (i.e. where the integral counts are proportional to , see Blain et al. 2000; Carilli & Blain 2002), we predict that a blind survey with SKA could detect these S–K outliers at at rate of 20–200 galaxies per hour333assuming the latest design specifications for a high-frequency SKA: skatelescope.org, S. Rawlings, private communication, 2011. This model is certainly too simplistic; cosmological simulations that include a prescription for the chemistry and the evolution of the cold molecular gas might be better placed to make predictions for the abundance and detectability of S–K outliers with ultra-low SFRs at high- (Obreschkow et al. 2009; Obreschkow, Heywood & Rawlings, 2011; Lagos et al. 2011, 2012; J. E. Geach et al. 2012 in preparation).
Finally we note that imaging of dense gas tracers such as HCN and carbon monosulfide (CS) line emission along with indicators of total molecular gas distribution such as CO J() , CO J() and [C i]() lines is of paramount importance for extracting information on important evolutionary parameters of galaxies such as (with more gas-rich systems expected at high redshifts irrespective of the star formation mode) and gas consumption timescales . Indeed it is only for the dense gas phase that the latter have the intended meaning as the duration of the observed star formation event, though in the literature the longer timescales of are often used, a rather poor choice as not all of the molecular gas is relevant to star formation, only the dense phase.
4. Conclusions and summary
In this work we use our minimal molecular and atomic line emission model presented in Paper I (where it was used to assess the practicality of blind galaxy surveys using ISM molecular and atomic lines), to discuss practical surveys of the star formation ‘mode’ of galaxies, i.e. isolated disks versus mergers, using the mass fraction of the dense star-forming gas phase versus the total molecular gas mass residing in star-forming galaxies. We argue that theoretical expectations as well as local molecular line studies point to as a very sensitive, extinction-free, measure of the star formation mode, independent of any galaxy morphological criteria. Moreover does not suffer from well-known degeneracies of low-J CO lines and the values of the so-called factor which make them poor star formation mode indicators of galaxies. Among the various proxies of we discuss, including HCN/CO (), HCN J() / [C i]() , ratios, we find that the CO J() / CO J() ratio currently offers the most immediately practical path to star formation mode surveys using ALMA, with the similarity of the lines’ frequencies offering observing efficiency, and the nearly matched beam size for a given telescope (the most suitable being ALMA for galaxy evolution studies) being an important advantage. Sensitive 12CO/13CO for line ratio surveys are another promising route maintaining the latter advantage, though such ratios are not direct proxies of rather than of the average turbulence levels in the ISM environments of disks (with low 12CO/13CO ratios) and mergers (with high 12CO/13CO ratios).
We note that for uniquely parametrizing the in gas-rich star-forming systems in the distant Universe, the specific high-density gas tracers used are not important. As sensitivities dramatically improve in the era of ALMA, other tracers will become available; for example, CS lines will also become suitable, with the same merger-versus-disk bi-modality expected for the corresponding and ratios. Of course before any foray into the high redshift Universe any proxy of must be calibrated locally with large samples of star-forming galaxies, a task easily performed with the vastly improved sensitivities of ALMA for all typical dense (and total) molecular gas mass tracers.
Finally we comment on the capabilities of upcoming observing facilities in searching for H2-rich galaxies with ultra-low star formation rates in the distant Universe. These would be extreme outliers of the local (SFR density)-(gas mass) Schmidt-Kennicutt (S–K) relations, and deep low-J CO and [C i]() line observations with the SKA and ALMA are the only way to discover them. The [C ii] line can also be used to trace such systems very effectively with ALMA, especially if they are metal-poor, but only at very high redshifts where the line is redshifted into the sensitive ALMA bands (Paper I), while its luminosity cannot be straightforwardly assigned to total molecular gas mass. Future cosmological simulations of galaxy evolution that include their molecular gas phase can inform on such possibilities, but it must be emphasized that such a putative population of (S–K) relation outlier gas-rich galaxies with ultra-low SFRs represents pure discovery space for deep molecular and atomic ISM line surveys using ALMA, SKA and its precursors, and thus should certainly be undertaken.
P.P.P. would like to thank the Director of the Argelander Institute of Astronomy Frank Bertoldi, the Rectorate of the University of Bonn, and the Dean U.-G. Meissner, for their ‘Hausverbot’ initiative that was a catalyst for finishing this work ahead of schedule. J.E.G. is supported by a Banting Postdoctoral Fellowship administered by the Natural Sciences and Engineering Research Council of Canada.
References
- Author et al. (2012) Aalto S., Booth R. S., Black J. M., & Johansson L. E. B. 1995, A&A, 300, 369
- Author et al. (2012) Barvainis R., Maloney P., Antonucci R., & Alloin D. 1997, ApJ, 484, 695
- Author et al. (2010) Béthermin, M., Dole, H., Lagache, G., Le Borgne, D., Penin, A., 2011, A&A, 529, 4
- Author et al. (2012) Casoli F., Dupraz C., & Combes F. 1992, A&A, 264, 55
- Author et al. (2012) Daddi E., Bournaud F., Walter F. et al. 2010, ApJ, 713, 686
- Author et al. (2012) Downes D., & Solomon P. M. 1998, ApJ, 507, 615
- Author et al. (2012) Gao Y., & Solomon P. M. 2004, ApJ, 606, 271
- Author et al. (2012) Greve, T. R., Papadopoulos, P. P., Gao, Y., Radford, S. J. E., 2009, ApJ, 692, 1432
- Author et al. (2012) Henkel C., & Mauersberger R. 1993, A&A, 274, 730
- Author et al. (2012) Henkel C., Downes D., Weiss A., Riechers D. & Walter F. 2010, A&A, 516, 111
- Author et al. (2012) Israel F. P., White G. J., & Baas F. 1995, A&A, 302, 343
- Author et al. (2012) Israel F. P., Tilanus R. P. J., & Baas F. 1998, A&A, 339, 398
- Author et al. (2012) Israel F. P., & Baas F. 2001, A&A, 371, 433
- Author et al. (2012) Israel F. P., Baas F. 2003, A&A, 404, 495
- Author et al. (2012) Israel F. P. 2009, A&A, 493, 525
- Author et al. (2012) Kennicutt, R. C. Jr., 1998, ApJ, 498, 541
- Author et al. (2012) Krumholz M., & McKee C. F. 2005, ApJ, 630, 250
- Author et al. (2012) Lagos C. Del P, Baugh, C. M., Lacey, C. G., Benson, A. J., Kim, H.-S., Power, C., 2011, MNRAS, 418, 1649
- Author et al. (2012) Lagos, C. del P., Bayet, E.; Baugh, C. M.; Lacey, C. G.; Bell, T.; Fanidakis, N.; Geach, J., 2012, 2012arXiv1204.0795L
- Author et al. (2012) Narayanan D., Krumholz M., Ostriker E. C., & Hernquist L. 2011, MNRAS, 418, 664
- Author et al. (2012) Nieten C., Dumke M., Beck R., & Wielebinski R. 1999, A&A, 347, L5
- Author et al. (2012) Obreschkow, D., Klöckner, H.-R., Heywood, I., Levrier, F., Rawlings, S., 2009, ApJ, 703, 1890
- Author et al. (2012) Obreschkow, D., Heywood, I., Rawlings, S., 2011, ApJ, 743, 84
- Author et al. (2012) Ossenkopf V. 1992, A&A, 391, 295
- Author et al. (2012) Padoan P. & Nordlund 2002, ApJ, 576, 870
- Author et al. (2012) Papadopoulos, Thi, & Viti, 2002, ApJ, 579, 270
- Author et al. (2012) Papadopoulos P. P. & Seaquist E. R. 1988, ApJ, 492, 521
- Author et al. (2012) Papadopoulos P. P., & Greve T. R. 2004, ApJ, 615, L29
- Author et al. (2012) Papadopoulos P. P. & Seaquist E. R. 1999, ApJ, 516, 114
- Author et al. (2012) Papadopoulos P. P., van der Werf P., Xilouris E. M., Isaak K. G., Gao Yu., & Muehle S., 2011, MNRAS (submitted, arXiv:1109.4176)
- Author et al. (2012) Petitpas G. R., & Wilson C. D. 1998, ApJ, 503, 219
- Author et al. (2012) Solomon P. M., Downes D., Radford S. J. E., & Barrett J. W. 1997, ApJ, 478, 144
- Author et al. (2012) Swinbank A. M., et al. 2011, ApJ, 742, 11
- Author et al. (2012) Tacconi, L. J., et al. 2010, Nature, 463, 781
- Author et al. (2012) White G. J., Ellison B., Claude S., Dent W. R. F., & Matheson D. N. 1994, A&A, 284, 23