Evidence for asymmetric distribution of circumstellar material around Type Ia supernovae.
Abstract
We study the properties of low–velocity material in the line of sight towards nearby Type Ia Supernovae (SNe Ia) that have measured late phase nebular velocity shifts (), thought to be an environment–independent observable. We have found that the distribution of equivalent widths of narrow blended Na I D1 & D2 and Ca II H & K absorption lines differs significantly between those SNe Ia with negative and positive , with generally stronger absorption for SNe Ia with . A similar result had been found previously for the distribution of colors of SNe Ia, which was interpreted as a dependence of the temperature of the ejecta with viewing angle. Our work suggests that: 1) a significant part of these differences in color should be attributed to extinction, 2) this extinction is caused by an asymmetric distribution of circumstellar material (CSM) and 3) the CSM absorption is generally stronger on the side of the ejecta opposite to where the ignition occurs.
Since it is difficult to explain 3) via any known physical processes that occur before explosion, we argue that the asymmetry of the CSM is originated after explosion by a stronger ionizing flux on the side of the ejecta where ignition occurs, probably due to a stronger shock breakout and/or more exposed radioactive material on one side of the ejecta. This result has important implications for both progenitor and explosion models.
Subject headings:
supernovae: general — distance scale1. INTRODUCTION
Type Ia Supernovae (SNe Ia) are important tools for understanding the evolution of the Universe because of their high luminosities and light–curve homogeneity, which led to their standardization for cosmological distance measurements (Phillips, 1993; Hamuy et al., 1996) and the discovery of the acceleration of the Universe (Riess et al., 1998; Perlmutter et al., 1999). They are also important because of their complex nucleosynthetic output and high ejecta kinetic energies ( erg), which make them key ingredients for galaxy evolution theory.
Unfortunately, we still lack a clear understanding of the nature of SN Ia progenitors. Although it is generally accepted that their progenitors are carbon oxygen white dwarfs (CO WD) in mass transfering binary systems (for a review, see Hillebrandt & Niemeyer, 2000), there is no agreement on what their companions are, whether the CO WD reaches the Chandrasekhar mass at ignition, what the mechanism that triggers the ignition is and how the CO WD burns to form the ejecta.
Perhaps the two scenarios that best match observed SN Ia spectra and light curves are those considered in Röpke et al. (2012): either a stably accreting carbon oxygen white dwarf (CO WD) that reaches the Chandrasekhar mass (), undergoes a thermonuclear runaway and burns in a deflagration to detonation transition, in the –single degenerate (SD) scenario (Nomoto et al., 1984; Khokhlov, 1991); or a pair of CO WDs that merge and ignite dynamically in the violent double degenerate (DD) scenario (Pakmor et al., 2012).
Two significant differences between both scenarios are the typical central densities at ignition and the distribution of circumstellar material (CSM) around their progenitor systems. In the –SD scenario the central density at ignition is sufficiently high to avoid the synthesis of radioactive 56Ni in favor of stable iron group elements (IGEs) in the innermost regions of the ejecta. The –SD scenario has potentially abundant CSM that could be produced by either the wind of the donor star, weak nova explosions experienced by the accretor, or by mass loss due to inefficient mass transfer. In the violent DD–scenario, conversely, the primary central density is never high enough to avoid the synthesis of radioactive 56Ni in the innermost regions of the ejecta, and since the merger and ignition happen in a dynamical time–scale there is no time to leave a significant imprint in the CSM.
The –SD scenario appears to over–produce IGEs (Nomoto et al., 1984), which are not produced significantly in the violent DD scenario. Observations of flat–topped profiles of Fe II lines in the optical and NIR at late phases has been argued to be evidence for stable IGEs in the innermost regions of the ejecta (Höflich et al., 2004; Gerardy et al., 2007). Moreover, significant nebular velocity shifts () measured in these flat–topped profiles have been suggested as evidence for off–center ignition scenarios, which is expected in –SD scenarios (see e.g. Nonaka et al., 2012). The relation between and other properties such as the rate of evolution of the velocity of Si absorption lines (the velocity gradient) or the colors during the photospheric phase of evolution (Maeda et al., 2010; Maeda et al., 2011; Cartier et al., 2011) seems to lend support to this picture.
For the nearby SN 2011fe, there is evidence for lack of interaction between the ejecta and a companion star or a companion star wind. The radius of the companion star has been constrained to be less than 0.1 (Bloom et al., 2012; Nugent et al., 2011; Brown et al., 2011), and its mass loss, less than yr-1 (Horesh et al., 2012). However, Sternberg et al. (2011) showed that SNe Ia show an excess of blue-shifted narrow Na lines, which is evidence for CSM around type Ia progenitors ejected before explosion. Particular cases, specifically SN 2002ic (Hamuy et al., 2003), SN 2006X (Patat et al., 2007, c.f. Chugai 2008), SN 1999cl (Blondin et al., 2009) and SN 2007le (Simon et al., 2009) have also provided evidence for CSM around SNe Ia, although in the case of SN 2002ic the nature of the explosion is unclear (Benetti et al., 2006).
Simon et al. (2009) noted that SNe Ia with variable narrow absorption lines tend to have broad lines and high velocity gradients. Foley (2012a) recently suggested that higher velocity at peak, redder SNe Ia are preferentially found in lower mass host galaxies, but also that they have an excess of blue-shifted absorption systems (Foley et al., 2012b). These observations highlight the importance of understanding the relation between progenitor systems and dust properties for cosmological distance determinations (e.g. Goobar, 2008; Folatelli et al., 2010). Since SNe Ia with are known to have higher velocity gradients, generally associated to higher velocities at peak, and to be redder (Maeda et al., 2010; Maeda et al., 2011), we investigate the relation between the presence or absence of narrow Na I D1 & D2 and Ca II H & K absorption lines (hereafter Na and Ca lines), a proxy for material in the line of sight, with , a geometrical proxy that should depend only on viewing angle (Maeda et al., 2010) and that should therefore be independent of any evolutionary or host galaxy effects.
2. SAMPLE SELECTION AND DATA ANALYSIS
In this work we have used the sample of 25 nearby SNe Ia with measured nebular velocity shifts () derived by Blondin et al. (2012) and Maeda et al. (2011) for which we have measured equivalent widths (EWs) of Na (24 SNe) and Ca (23 SNe) absorption systems. The EWs were obtained from mid–resolution spectra in the public Center for Astrophysics (CfA) spectra database (Blondin et al., 2012; Jha et al., 1999; Branch et al., 2003; Matheson et al., 2008; Wang et al., 2009) for most SNe Ia, from Silverman et al. (2011) for SN2009dc, from high–resolution spectra in the European Southern Observatory (ESO) archive for SN 2000cx, SN 2001el and SN 2006X, from Sternberg et al. (2011) for SN 2007sr and SN 2007af, using Yaron & Gal-Yam (2012), values from the literature for SN 1986G, SN 2004eo and SN 2006dd (Phillips, 1993; Pastorello et al., 2007; Stritzinger et al., 2010), and our own X–Shooter (Vernet et al., 2011) data for SN 2010ev. We note that although there are public spectra for SN 1990N and SN 2004eo, we do not use them because they appear to have been artificially smoothed in the wavelength direction, removing all evidence for narrow lines.
2.1. Equivalent width determination
We have written a Python script to measure EWs in every SN for every epoch available. The script first defines the continuum by tracing straight lines between nodes automatically defined. The position of the nodes is chosen to avoid being too close to the lines being measured, and the flux associated to every node is defined by locally averaging the observed flux with typical velocity ranges proportional to the separation between nodes and a continuous smoothing function. After the nodes are placed and the continuum defined, we visually inspect the spectra, divide the observed flux by the continuum and compute the area below unity within 300 km s-1 of every line in :
| (1) |
where are the fluxes of pixels with velocities within 300 km s-1 of the line of interest, is the continuum value for every pixel, and is the wavelength separation between pixels. In order to obtain more robust EW determinations, for every SN we use the median EW among all available epochs, excluding those epochs with significantly larger errors.
We have considered four sources of error in our method somewhat conservatively: flux measurement uncertainties (), continuum flux uncertainties (), possible systematic deviations in our method (), and the median absolute deviation (a robust error measurement) of the EWs for different epochs for every SN (). and were obtained using the quoted flux uncertainties for every spectra at different wavelengths and propagating errors using equation (1) to compute the EW uncertainty, :
| (2) |
where are the flux uncertainties in every pixel, is the uncertainty associated to the continuum at every pixel, defined as the average node flux uncertainty of the closest two nodes to every pixel, and where each node uncertainty is defined by weighting the ’s in the same way as the flux of every node is defined.
To determine we have run our script assuming that the lines are in positions of the spectra where no low velocity absorption lines should be found, changing these positions artificially along the spectra and using quadratically averaged values of the derived EWs as the final errors. To determine we simply computed the median absolute deviation of the measured EWs at different epochs, excluding those values with relatively large errors.
2.2. Validation of the method
| Name | [km s-1] | EW(Na) | EW(Ca) |
|---|---|---|---|
| SN 1986G | -639 600 | 3.60 0.01 | 1.75 0.01 |
| SN 1990N | -478 600 | NA | NA |
| SN 1994D | -2220 220 | 0.05 0.22 | 0.06 0.25 |
| SN 1994ae | -1204 600 | 0.36 0.16 | 0.33 0.22 |
| SN 1995D | -1193 600 | 0.32 0.21 | 0.23 0.29 |
| SN 1997bp | 2539 410 | 1.81 0.21 | 1.12 0.26 |
| SN 1998aq | -1157 129 | 0.19 0.16 | 0.35 0.20 |
| SN 1998bu | -1351 305 | 0.63 0.12 | 0.07 0.16 |
| SN 2000cx | -172 600 | -0.07 0.08 | -0.01 0.01 |
| SN 2001el | 980 206 | 0.66 0.04 | 0.67 0.10 |
| SN 2002bo | 2258 361 | 2.48 0.18 | 1.20 0.26 |
| SN 2002dj | 2021 414 | 1.09 0.33 | 0.78 0.31 |
| SN 2002er | 582 600 | 1.77 0.17 | 1.62 0.31 |
| SN 2003du | -443 283 | 0.07 0.21 | -0.02 0.22 |
| SN 2003hv | -2825 384 | -0.09 0.25 | -0.41 0.41 |
| SN 2003kf | 1070 201 | 0.41 0.20 | 0.69 0.25 |
| SN 2004dt | -2623 600 | 0.23 0.23 | -0.02 0.36 |
| SN 2004eo | -170 25 | 0.00 0.20 | NA |
| SN 2005cf | -123 600 | 0.04 0.21 | 0.23 0.20 |
| SN 2006X | 2832 343 | 2.06 0.04 | 0.80 0.06 |
| SN 2006dd | -1553 201 | 3.22 0.08 | 1.00 0.10 |
| SN 2007af | 831 350 | 0.39 0.02 | 0.28 0.17 |
| SN 2007sr | 1185 600 | 0.29 0.01 | 0.09 0.26 |
| SN 2009dc | -1190 600 | 0.94 0.15 | 2.00 0.31 |
| SN 2010ev | 2145 225 | 0.67 0.05 | 0.37 0.02 |
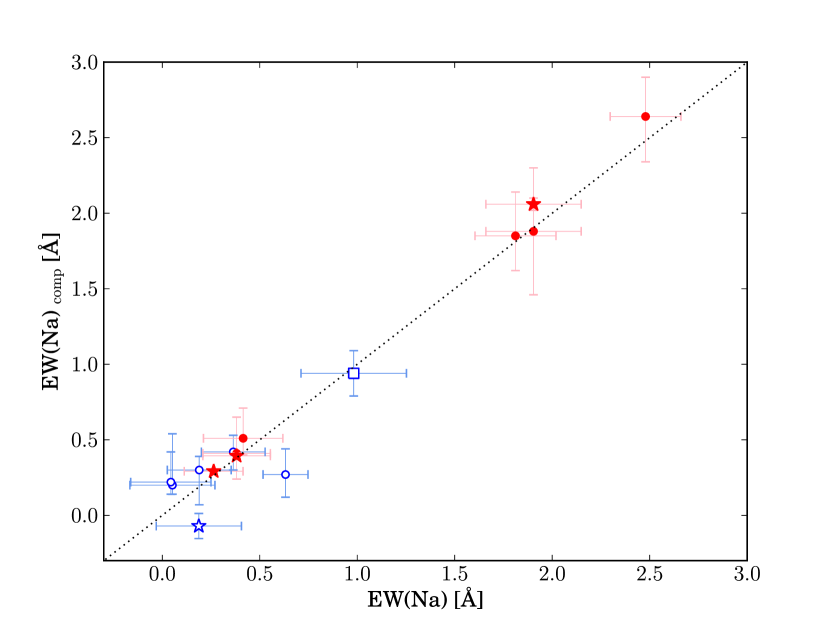
We have compared our measurements of the EWs with those in the literature and with those obtained from publicly available high–resolution spectra, as shown in Figure 1. Our results are consistent within errors in 14 out of 15 measurements, with the only exception being SN 1998bu, for which we obtained a significantly higher EW, that upon visual inspection appears to be due to continuum definition uncertainties. We have also compared our measurements with those obtained with IRAF’s splot routine and found consistent values in 90% of the cases, without any highly significant exception. The nebular velocities and equivalent widths used in this analysis are shown in Table 1.
3. RESULTS
| KS test | E(B-V)SNooPy | (B-V) | MW Na | Host Na | MW Ca | Host Ca |
|---|---|---|---|---|---|---|
| –value | 0.006 | 0.002 | 0.268 | 0.013 | 0.402 | 0.030 |
In order to test whether SNe Ia with negative and positive have different distributions of intervening material in the line of sight, we have performed Kolmogorov–Smirnov (KS) tests of the cumulative distribution function (CDF) of the measured equivalent widths of Na and Ca lines caused by intervening material in the Milky Way and in the SN host galaxies. We have also tested whether SNe Ia with negative or positive have different extinction or color properties using E(B-V) values obtained with SNooPy (Burns et al., 2011) and (B-V) values from SiFTO (Conley et al., 2008) best–fitting models. The KS test results are shown in Table 2.
| KS test | Morphological type | Galaxy inclination | NCRNUV | NCRHα |
|---|---|---|---|---|
| –value | 0.133 | 0.390 | 0.768 | 0.944 |
As expected, the distribution of intervening Milky Way material between SNe Ia with negative and positive is consistent with being drawn from the same parent population. However, the likelihood that the distribution of intervening material in their host galaxies is the same is significantly smaller. Given that the separation of the sample by the sign of should be purely geometrical, we should not expect any significant differences in the distributions of host Na and Ca lines, unless the intervening material is of circumstellar nature and with an asymmetric distribution.
To test whether the different distributions of EWs are caused by an unlikely combination of host galaxy properties, we compare the distributions of host galaxy morphological types and inclinations from the Asiago catalogue (Barbon et al., 1999) and the higher resolution pixel based statistic NCR (James & Anderson, 2006) that quantifies any association with regions of star formation (SF) using GALEX NUV (23 out of 25 SNe) and our own maps (14 out of 25 SNe), separating between SNe Ia with and . We do not find any significant difference between these two populations for global (morphological type and inclination) or local (NCR statistics) host galaxy properties. The KS test –values are shown in Table 3.
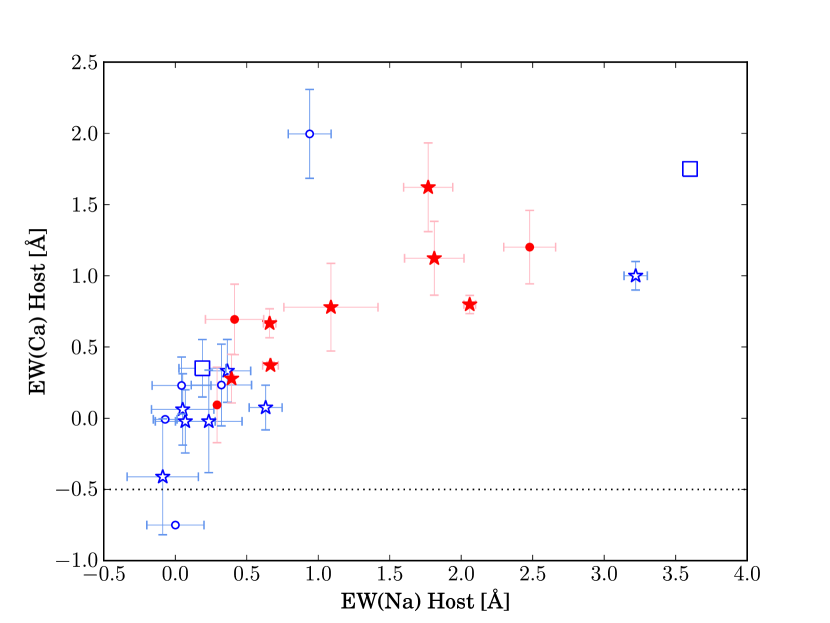
In Figure 2 we plot the measured EWs for the Na and Ca lines divided by the sign of . Red filled symbols are SNe with and blue open symbols, those with . Stars indicate SNe Ia occurring in pixels associated to SF (NCR), circles indicate SNe Ia occurring in pixels with no association to SF (NCR) and squares indicate SNe Ia with no NCRNUV measurements. SN 2004eo, which only has a reported non–detection of Na in (Pastorello et al., 2007) and for which we associate a typical error of 0.2 Å, is shown below the dotted line. In this figure, SNe Ia with appear clustered at relatively low EW values, with three exceptions at high EWs, whereas SNe Ia tend to have higher EWs in general. This suggests that the intervening CSM absorbs more light opposite to the direction of where the ignition occurs.
The fact that some SNe Ia show high EWs and (3 out of 14) is expected, since in some cases the EWs will be due to host galaxy material and not CSM absorption. Even if their high EWs are due to CSM our KS tests rule out that these exceptions are significant. In particular, SN 1986G and SN 2006dd appear to be located behind prominent dust lanes of their host galaxies and SN 2006dd has the second highest NCRNUV statistic in our sample (0.827), implying a possible association with SF. However, SN 2006dd and SN 2009dc have been suggested to show some signs of CSM based on their Na line evolution (Stritzinger et al., 2010) and light curve shape (Taubenberger et al., 2011), hence we cannot rule out that their high EWs are due to CSM.
Most SNe Ia with in Figure 2 have some degree of association with SF (NCR), which could be associated to higher EWs due to non–CSM in the line of sight. However, only 2 out of 10 SNe Ia with are strongly associated with SF (NCR), whereas 4 out of 15 SNe with are strongly associated to SF. This suggests that higher EWs in our sample are not primarily due to host galaxy non–CSM, which is consistent with the excess of blue–shifted Na lines found by Sternberg et al. (2011), and which is supported by the high –values for the NCRNUV and NCRHα KS tests in Table 3. It could also be argued that NCR statistics are only a measure of relative SF within galaxies. To account for this, we have removed early–type galaxies from our sample and repeated the KS tests from Table 2, obtaining significantly low –values of 0.022 and 0.018 for the distribution of EW(Na) and EW(Ca), respectively.
4. DISCUSSION AND CONCLUSIONS
Our main conclusion is that the distribution of EWs from narrow blended Na and Ca lines differs significantly between SNe Ia with negative and positive . Because the sign of should be purely geometrical, it should not correlate with any host galaxy or average SN properties. This suggests that part of the lines are formed by CSM ejected by the progenitor before explosion, which is found asymmetrically distributed after explosion. The differences in color found for SNe Ia with different (Maeda et al., 2011), which we confirm using SNooPy and SiFTO light curve fitting, should be explained in part by extinction due to an asymmetric distribution of CSM, and not by different ejecta temperatures with viewing angle alone.
There are two possibilities to explain this result: 1) the CSM material is asymmetrically ejected from the system before explosion and is aligned with the side of the ejecta where ignition occurs, or 2) the CSM material is initially spherically symmetric and is affected by an asymmetric distortion after explosion, which is stronger on the side where ignition occurs.
One possible physical process that could break the symmetry of the WD and have an effect on both the direction of ignition and the distribution of CSM is rotation. However, rotation should produce cylindrically symmetric systems, where positive or negative should lead to the same average CSM properties in the line of sight. Another possibility is the gravitational field of a companion star, but the typical velocity offsets found for the absorbing material in Sternberg et al. (2011) implies that the material was ejected at a time before explosion much longer than the expected orbital period of the progenitor systems, again producing some cylindrical symmetry in average.
Thus, we conclude that only 2) is possible to explain our results. One way to produce an asymmetric distribution of dust, EW(Na) and EW(Ca) is to have an asymmetric ionizing field after explosion. This would destroy most of the dust and ionize Na and Ca in the direction where ignition occurs. A comparison with pre–explosion images of the core–collapse SN 2012aw (Fraser et al., 2012) supports the idea of dramatic changes in extinction after explosion. The fact that the correlations are found to be stronger for dust (colors) than for EW(Na) and EW(Ca) is suggestive, since they are in ascending order of ionization potential. One problem with this interpretation could be the constraints in radio and X–ray for CSM–ejecta interactions. This would be solved if the material were placed far enough from the ejecta, and only in some cases allow the ejecta to interact with the CSM, as was seen in SN 2002ic, SN 2006X and 2007le, or if the measured EWs are due to saturated lines in low mass, clumpy CSM with a wide distribution of velocities.
Our results provide hints about the explosion asymmetry and CSM properties of SN Ia progenitors. If a larger sample confirms that most SNe Ia with have high EWs of Na and Ca absorption lines, the majority of progenitors should contain significant CSM. If this is the case, most SNe Ia with should have more strongly ionizing fields (higher energy photons) after explosion, either during shock breakout, or afterwards if more radioactive material is exposed in the ignition side of the explosion.
Finally, significant CSM is consistent with some –SD or slow DD scenarios (e.g. Fryer et al., 2010) and not with violent DD scenarios. However, in our interpretation it is difficult to explain the SNe Ia with and low EWs, which may suggest that multiple progenitor scenarios are at work.
www.weizmann.ac.il/astrophysics/wiserep. Based on observations
made with the European Southern Observatory telescopes obtained from
the ESO/ST-ECF Science Archive Facility. Based on observations made
with the NASA Galaxy Evolution Explorer. GALEX is operated for NASA by
the California Institute of Technology under NASA contract NAS5-98034.
References
- Barbon et al. (1999) Barbon, R., Buondí, V., Cappellaro, E., & Turatto, M. 1999, A&AS, 139, 531
- Benetti et al. (2006) Benetti, S., Cappellaro, E., Turatto, M., et al. 2006, ApJ, 653, L129
- Blondin et al. (2009) Blondin, S., Prieto, J. L., Patat, F., et al. 2009, ApJ, 693, 207
- Blondin et al. (2012) Blondin, S., Matheson, T., Kirshner, R. P., et al. 2012, AJ, 143, 126
- Bloom et al. (2012) Bloom, J. S., Kasen, D., Shen, K. J., et al. 2012, ApJ, 744, L17
- Branch et al. (2003) Branch, D., Garnavich, P., Matheson, T., et al. 2003, AJ, 126, 1489
- Brown et al. (2011) Brown, P. J., Dawson, K. S., de Pasquale, M., et al. 2011, arXiv:1110.2538
- Burns et al. (2011) Burns, C. R., Stritzinger, M., Phillips, M. M., et al. 2011, AJ, 141, 19
- Cartier et al. (2011) Cartier, R., Förster, F., Coppi, P., et al. 2011, A&A, 534, L15
- Chugai (2008) Chugai, N. N. 2008, Astronomy Letters, 34, 389
- Conley et al. (2008) Conley, A., Sullivan, M., Hsiao, E. Y., et al. 2008, ApJ, 681, 482
- Folatelli et al. (2010) Folatelli, G., Phillips, M. M., Burns, C. R., et al. 2010, AJ, 139, 120
- Foley (2012a) Foley, R. J. 2012, ApJ, 748, 127
- Foley et al. (2012b) Foley, R. J., Simon, J. D., Burns, C. R., et al. 2012, arXiv:1203.2916, Accepted for ApJ.
- Fraser et al. (2012) Fraser, M., Maund, J. R., Smartt, S. J., et al. 2012, arXiv:1204.1523
- Fryer et al. (2010) Fryer, C. L., Ruiter, A. J., Belczynski, K., et al. 2010, ApJ, 725, 296
- Gerardy et al. (2007) Gerardy, C. L., Meikle, W. P. S., Kotak, R., et al. 2007, ApJ, 661, 995
- Goobar (2008) Goobar, A. 2008, ApJ, 686, L103
- Hamuy et al. (1996) Hamuy, M., Phillips, M. M., Suntzeff, N. B., et al. 1996, AJ, 112, 2408
- Hamuy et al. (2003) Hamuy, M., Phillips, M. M., Suntzeff, N. B., et al. 2003, Nature, 424, 651
- Hillebrandt & Niemeyer (2000) Hillebrandt, W., & Niemeyer, J. C. 2000, ARA&A, 38, 191
- Höflich et al. (2004) Höflich, P., Gerardy, C. L., Nomoto, K., et al. 2004, ApJ, 617, 1258
- Horesh et al. (2012) Horesh, A., Kulkarni, S. R., Fox, D. B., et al. 2012, ApJ, 746, 21
- James & Anderson (2006) James, P. A., & Anderson, J. P. 2006, A&A, 453, 57
- Jha et al. (1999) Jha, S., Garnavich, P. M., Kirshner, R. P., et al. 1999, ApJS, 125, 73
- Khokhlov (1991) Khokhlov, A. M. 1991, A&A, 245, L25
- Kotak et al. (2004) Kotak, R., Meikle, W. P. S., Adamson, A., & Leggett, S. K. 2004, MNRAS, 354, L13
- Maeda et al. (2010) Maeda, K. et al. 2010, Nature, 486, 82
- Maeda et al. (2011) Maeda, K., Leloudas, G., Taubenberger, S., et al. 2011, MNRAS, 413, 3075
- Matheson et al. (2008) Matheson, T., Kirshner, R. P., Challis, P., et al. 2008, AJ, 135, 1598
- Nomoto et al. (1984) Nomoto, K., Thielemann, F.-K., & Yokoi, K. 1984, ApJ, 286, 644
- Nonaka et al. (2012) Nonaka, A., Aspden, A. J., Zingale, M., et al. 2012, ApJ, 745, 73
- Nugent et al. (2011) Nugent, P. E., Sullivan, M., Cenko, S. B., et al. 2011, Nature, 480, 344
- Pakmor et al. (2012) Pakmor, R., Kromer, M., Taubenberger, S., et al. 2012, ApJ, 747, L10
- Pastorello et al. (2007) Pastorello, A., Mazzali, P. A., Pignata, G., et al. 2007, MNRAS, 377, 1531
- Patat et al. (2007) Patat, F., Chandra, P., Chevalier, R., et al. 2007, Science, 317, 924
- Perlmutter et al. (1999) Perlmutter, S. et al. 1999, ApJ, 517, 565
- Phillips et al. (1987) Phillips, M. M., Phillips, A. C., Heathcote, S. R., et al. 1987, PASP, 99, 592
- Phillips (1993) Phillips, M. M. 1993, ApJ, 413, L105
- Riess et al. (1998) Riess, A. G. et al. 1998, AJ, 116, 1009
- Röpke et al. (2012) Röpke, F. K., Kromer, M., Seitenzahl, I. R., et al. 2012, ApJ, 750, L19
- Silverman et al. (2011) Silverman, J. M., Ganeshalingam, M., Li, W., et al. 2011, MNRAS, 410, 585
- Simon et al. (2009) Simon, J. D., Gal-Yam, A., Gnat, O., et al. 2009, ApJ, 702, 1157
- Sternberg et al. (2011) Sternberg, A., Gal-Yam, A., Simon, J. D., et al. 2011, Science, 333, 856
- Stritzinger et al. (2010) Stritzinger, M., Burns, C. R., Phillips, M. M., et al. 2010, AJ, 140, 2036
- Taubenberger et al. (2011) Taubenberger, S., Benetti, S., Childress, M., et al. 2011, MNRAS, 412, 2735
- Vernet et al. (2011) Vernet, J., Dekker, H., D’Odorico, S., et al. 2011, A&A, 536, A105
- Wang et al. (2009) Wang, X., Li, W., Filippenko, A. V., et al. 2009, ApJ, 697, 380
- Yaron & Gal-Yam (2012) Yaron, O., & Gal-Yam, A. 2012, arXiv:1204.1891