Keck/NIRC2 Imaging of the Warped, Asymmetric Debris Disk Around HD 32297
Abstract
We present Keck/NIRC2 band high-contrast coronagraphic imaging of the luminous debris disk around the nearby, young A star HD 32297 resolved at a projected separation of = 0.3–2.5″ ( 35–280 AU). The disk is highly warped to the north and exhibits a complex, “wavy” surface brightness profile interior to 110 AU, where the peaks/plateaus in the profiles are shifted between the NE and SW disk lobes. The SW side of the disk is 50–100% brighter at = 35–80 AU, and the location of its peak brightness roughly coincides with the disk’s mm emission peak. Spectral energy distribution modeling suggests that HD 32297 has at least two dust populations that may originate from two separate belts likely at different locations, possibly at distances coinciding with the surface brightness peaks. A disk model for a single dust belt including a phase function with two components and a 5–10 AU pericenter offset explains the disk’s warped structure and reproduces some of the surface brightness profile’s shape (e.g. the overall “wavy” profile, the SB peak/plateau shifts) but more poorly reproduces the disk’s brightness asymmetry and the profile at wider separations ( 110 AU). Although there may be alternate explanations, agreement between the SW disk brightness peak and disk’s peak mm emission is consistent with an overdensity of very small, sub-blowout-sized dust and large, 0.1–1 mm-sized grains at 45 AU tracing the same parent population of planetesimals. New near-IR and submm observations may be able to clarify whether even more complex grain scattering properties or dynamical sculpting by an unseen planet are required to explain HD 32297’s disk structure.
Subject headings:
stars: early-type, planetary systems, stars: individual HD 322971. Introduction
Debris disks are signposts of planets and planet formation (e.g. Wyatt, 2008; Kenyon and Bromley, 2008). Supporting this picture, the two stars with independently confirmed, directly imaged planetary systems HR 8799 and Pictoris (Marois et al., 2008, 2010; Currie et al., 2011a; Lagrange et al., 2010) are surrounded by luminous debris disks (Smith and Terrile, 1984; Rhee et al., 2007; Su et al., 2009). Similarly, Fomalhaut has a candidate planetary companion located just interior to the star’s bright debris ring (Kalas et al., 2008).
In the absence of a directly imaged planet, resolved imaging of debris disks may provide indirect evidence for a massive planet’s existence, may help constrain the unseen planet’s properties, and thus can help identify promising targets for future direct imaging (e.g. Wyatt et al., 1999). For example, the inclined or “warped” component of Pictoris’s debris disk (Heap et al., 2000; Golimowski et al., 2006) is likely due to the directly imaged planet (Augereau et al., 2001; Dawson et al., 2011) and also provides an estimate for the planet’s mass independent of planet cooling models (Lagrange et al., 2010). Dynamical sculpting by a planet/planets may explain the sharp inner edge and pericenter offset of Fomalhaut’s debris ring (Kalas et al., 2005; Quillen et al., 2006; Kalas et al., 2008). Other debris disk structures may be due to non-planet processes, in particular interactions with the interstellar medium or perturbations from a nearby star, as has been proposed to explain images of disks around HD 15115 and HD 61005 (e.g. Kalas et al., 2007; Hines et al., 2007).
The nearby ( ; van Leeuwen, 2007) A5 star HD 32297 is another example of a young star surrounded by a luminous, spatially-resolved, debris disk. At 30 Myr old (Kalas et al., 2005), it is roughly coeval with HR 8799 and may probe debris disk evolution at a stage just after they are most collisionally active (Kenyon and Bromley, 2008; Currie et al., 2008, 2009). Like Pic and HR 8799, HD 32297 has a large infrared (IR) excess emission due to circumstellar dust first identified from IRAS data. Schneider et al. (2005) thus selected HD 32297 for Hubble Space Telescope(HST) NICMOS (F110W) coronagraphic imaging and resolved the disk out to an angular distance (from the star) of 3.3″ ( 400 AU). HD 32297 was subsequently resolved in the optical (Kalas, 2005), near-IR (1.6–2.2 , Debes et al., 2009; Mawet et al., 2009), thermal infrared (10–20 , Moerchen et al., 2007; Fitzgerald et al., 2007), and millimeter (1.3mm Maness et al., 2008).
Previous work has claimed that HD 32297’s disk structure is shaped by planet sculpting as well as non-planet processes. Debes et al. (2009) identified an asymmetry in the disk scattering efficiency between the northeast and southwest sides (see also Kalas, 2005). They argued that ISM sculpting explains this feature much like it explains some properties of the HD 15115 and HD 61005 disks. Schneider et al. (2005) identified a brightness asymmetry between the two disk sides, a feature consistent with sculpting by a massive planet (see also Maness et al., 2008).
The two mechanisms, ISM sculpting and planets, are not mutually exclusive. New images of the HD 15115 and HD 61005 disks reveal cleared inner regions and/or pericenter offsets, both of which are plausibly due to a planetary companion (Rodigas et al., 2012; Buenzli et al., 2010). Additionally, multiple debris belts, scaled analogues to the solar system’s asteroid belt and Kuiper belt, are also likely planet signposts and may reside around HD 61005, HD 15115, and HD 32297 (Fitzgerald et al., 2010; Maness et al., 2008; Rodigas et al., 2012).
To determine which mechanisms are responsible for shaping HD 32297’s debris disk structure, we need new, high signal-to-noise images with which to derive precise disk properties. Although Schneider et al. (2005) identify a disk brightness asymmetry consistent with planet sculpting, they caution that the disk brightness measurements close to the coronagraphic spot (r 0.3–0.4″) which provide the basis for this asymmetry are highly uncertain. PSF subtraction errors due to the completely opaque NICMOS coronagraphic spot may limit our ability to conclusively identify disk structure at these small, speckle-dominated separations. Moreover, if the asymmetry identified a planet-induced density structure, it should align with the mm emission peak (Maness et al., 2008). However, it is not clear whether these asymmetries are aligned and thus whether they identify small and large grains originating from the same parent population. The Palomar/ image from Mawet et al. (2009) has limited spatial resolution. While they did recover Schneider et al.’s brightness asymmetry, higher spatial resolution observations could confirm and help clarify the physical origin of this and other features. For example, new data could identify breaks in the disk brightness profile that may reveal evidence for the multiple debris belts inferred from modeling unresolved IR data.
To further clarify the nature of the HD 32297 debris disk, we present new coronagraphic imaging obtained at ( 2 ) with the Keck telescope on Mauna Kea, resolving the disk at angular separations of 0.3–2.5″. §2 describes our observations and extraction of the disk images. In §3, we investigate basic disk properties (position angle, full-width half-maximum, and surface brightness) as a function of angular separation from the star. We then combine imaging with new, unresolved broadband photometry from the Spitzer Space Telescope and the WISE satellite to constrain the disk structure and identify the location(s) of the disk emission (§4). Finally, we compare our analyses to those from previous work on HD 32297 (§5) and investigate the physical mechanisms responsible for sculpting the disk emission (§6).
2. NIRC2 Data
2.1. Observations
We imaged HD 32297 on UT November 20, 2011 with the NIRC2 camera mounted on Keck II using the filter ( = 2.16 ) in the narrow camera mode (9.952 mas/pixel Yelda et al., 2010) with correlated double sampling. The Keck AO system delivered diffraction limited images with a FWHM of 4.9 pixels ( 49 mas). To enhance our ability to extract the HD 32297 disk emission from the bright stellar halo, we centered the star behind the 0.6″ diameter, partially-transmissive coronagraphic spot and used the ”large hex” pupil plane mask.
Our HD 32297 data consist of coadded 30s exposures with a cumulative integration time of 20 minutes and were taken through transit (HA = [-0.22,0.35]) in “vertical angle” or angular differential imaging mode (ADI, Marois et al., 2006). Over the course of these exposures, the parallactic angle changed by 36 degrees. While light cirrus caused fluctuations in the source transmission (as measured from the PSF core behind the coronagraphic mask) on the order of 10%, observing conditions were otherwise stable.
To flux calibrate the data, we measure the flux of the PSF core of HD 32297 as viewed through the partially transmissive coronagraphic mask and corrected for the extinction through the mask. To determine the extinction, we use Keck/NIRC2 observations of HD 15115 taken in August 2011 in photometric conditions with the same coronagraphic spot size that were flux-calibrated with a standard star HD 3029. From the August data, we measure the extinction through the 0.6″ spot to be 6.91 0.15 mags, slightly less than but comparable to extinction estimates in for 1–2″ spot diameters (Metchev et al., 2009). Uncertainties in the aperture correction inside the coronagraphic spot due to scattered light from the spot edge limit the precision of our estimate. We did observe a photometric standard (p486r) 90 minutes after our HD 32297 imaging sequence. Although conditions became highly variable during the standard star observations due to patchy cloud coverage, our absolute flux calibration implied from the least extincted standard star frames agrees with that derived from the coronagraph transmission to within 0.3 magnitudes.
2.2. Image Processing
Basic image processing and high-contrast imaging techniques follow methods outlined in Currie et al. (2010, 2011a, 2011b). We employ standard dark subtraction and flatfielding corrections, identify and interpolate over hot/cold pixels, and apply the distortion correction determined from Yelda et al. (2010). For image registration, we exploit the fact that the PSF core is visible through the coronagraphic mask and is unsaturated. We register each image to subpixel ( 0.1 pixels) accuracy by determining the centroid position of the first image in the sequence and then determining the relative offset between the reference image and subsequent images by solving for the peak in the cross-correlation function for each image pair. Finally, we subtract off a radial profile to remove the smooth seeing halo and make a second pass through the images to identify remaining bad pixels.
To extract a detection of the HD 32297 disk, we adopt the Locally Optimized Combination of Images approach (LOCI Lafreniere et al., 2007), using an updated version of the LOCI-based code employed in Currie et al. (2011b), which will be detailed later (Currie et al., 2012, T. Currie, 2012 in prep.). Following Thalmann et al. (2011), we reduce the data using “conservative” LOCI settings more appropriate for extended sources (i.e. disks, not planets), where we consider rotation gaps of 1.5–5 FWHM, optimization areas () of 1000–3000 the FWHM area, optimization geometries of 0.5–2, and subtraction annuli () of 5–10 pixels wide (see Lafreniere et al., 2007, for more details). To determine the signal-to-noise per resolution element of our disk detection, we convolve the image with a beam size equal to 1 FWHM and compare pixel counts to the standard deviation of counts within a 1 FWHM-wide annulus111The focus of this paper is imaging and characterizing the HD 32297 debris disk. While we do not present data reductions with methods more optimized for point source detection, we plan to do so in a future work. Finally, we correct for photometric/astrometric biases inherent in LOCI-based processing by imputing fake disks into each registered image and comparing the predicted and measured disk properties (e.g. surface brightness, full-width half maximum, position angle). Our method follows that first developed by Rodigas et al. (2012) and is described in full in the Appendix.
2.3. HD 32297 Disk Image
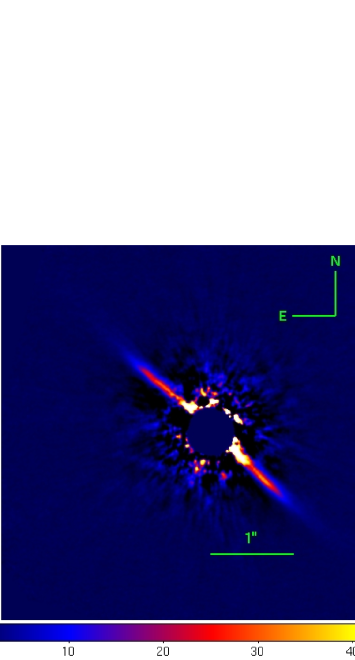
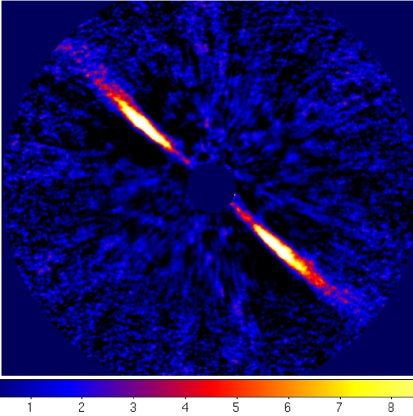
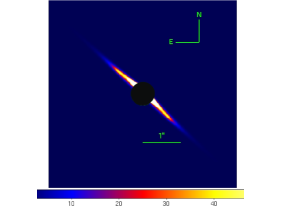
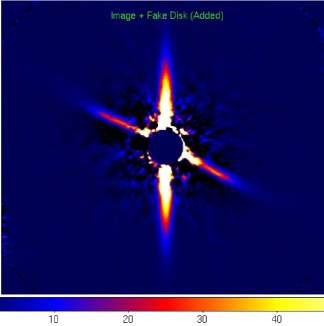
Figure 1 shows the image and signal-to-noise map for our “conservative” LOCI reduction assuming a rotation gap criterion of 2.5, = 3000, = 1, and = 10, which balances our ability to detect the disk at small separations by attenuating speckles (favoring smaller , ) but without oversubtracting the disk (favoring larger , ). As evidenced by the signal-to-noise map, we detect the disk at SNR 3 from r = 2.5″ all the way to the edge of the coronagraphic spot at 0.3″. The peak signal-to-noise per pixel is 19. The disk emission along the midplane is more than 10 significant at 0.85–1.4″, while some regions of disk emission at 0.3–0.5″ on the SW side are still more than 5- significant. Visually inspecting the image and signal-to-noise map reveals significant disk structure. Most notably, the disk emission traces a distinct “bow” shape, where the disk position angle clearly changes with radial separation.
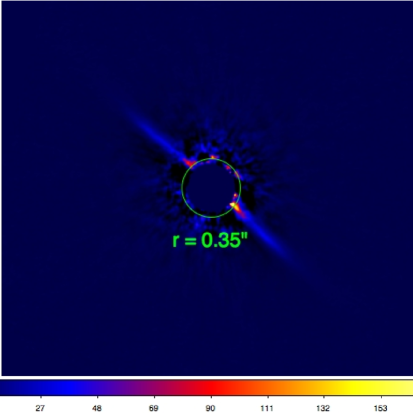
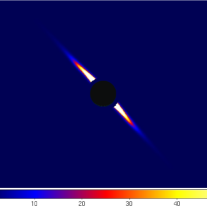
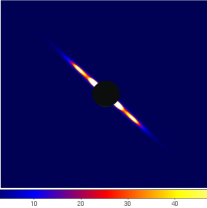
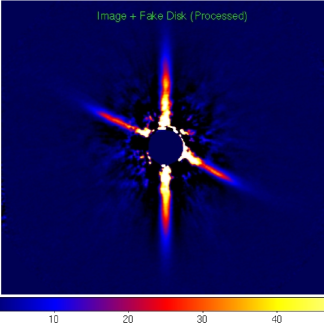
Furthermore, the disk exhibits a significant brightness asymmetry at small separations ( 0.7″). Figure 2 redisplays our disk image with a different color stretch to better illustrate the brightness differences between the two sides of the disk. Interior to = 0.35″ (identified with a circle), the SW side is significantly brighter than both the NE side as well as any pixel value for residual speckles located at different azimuthal separations; the NE side has a peak brightness only slightly larger than the brightest speckle. Exterior to this separation, there are no residual speckles as bright as either side of the disk, and the SW is still clearly brighter at least out to 0.6″ (yellow/red region on the SW side).
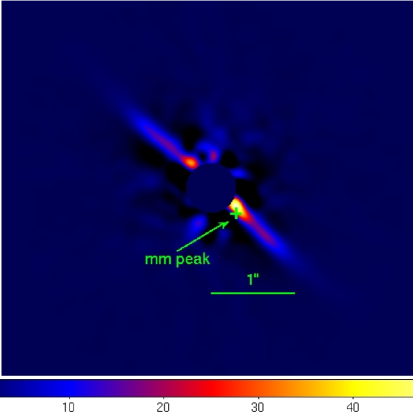
Our Keck image agrees well with the previous best results, which were obtained with the extreme-AO Well-Corrected Sub-Aperture on Palomar presented by Mawet et al. (2009) using classical (not ADI) imaging. Convolved to the Palomar/WCS beamsize (Figure 2, bottom panel), our image strongly resembles that of Mawet et al.’s. The disk appears highly asymmetric with the SW side being brighter extending all the way to the coronagraphic spot (0.3″ in our image compared to 0.4″ in theirs). As with the Mawet et al. (2009) data, the NE side appears fainter and truncated. Moreover, the brightest portion of the disk on the SW side roughly overlaps with the mm continuum peak (Maness et al., 2008).
3. Analysis
Here, we investigate the HD 32297 disk geometry and surface brightness profile, following methods similar to those described in Rodigas et al. (2012). We perform analysis on the image shown in Figure 1. The disk properties we report are corrected for photometric/astrometric biases inherent in LOCI processing (see Appendix).
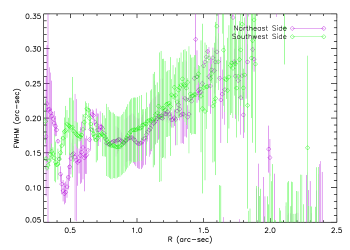
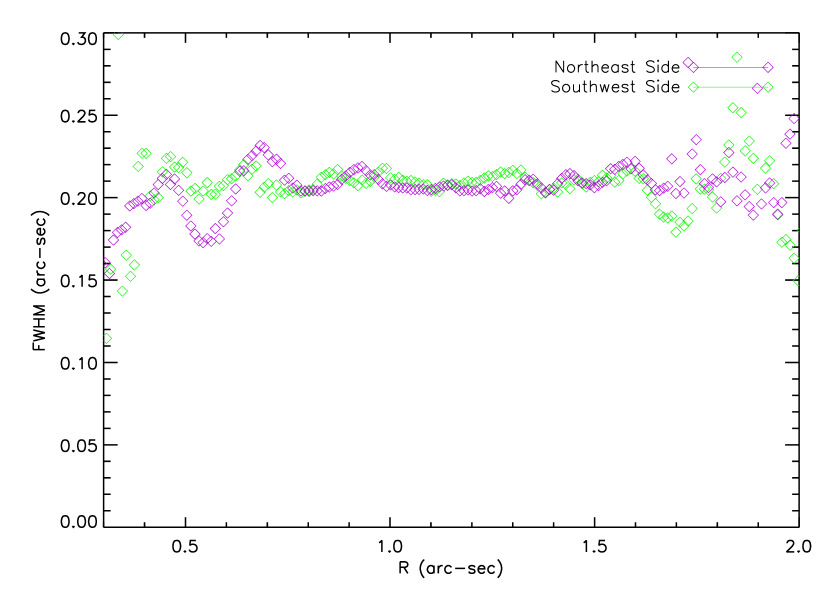
3.1. Disk FWHM
To better assess the HD 32297 disk morphology, we measure the disk FWHM perpendicular to the disk’s major axis as a function of stellocentric distance. First, we identify the brightest pixels at each radial separation for the NE and SW lobes, respectively. Next, we place a 5 pixel by 21 pixel box centered on the brightest pixel and sum up the counts/pixel along each row of the box, producing a 1D array of 21 values. Finally, we fit a Gaussian to this array, which yields the disk midplane location and the disk FWHM at that location.
Figure 3 displays the disk FWHM as a function of stellocentric distance for the NE (purple) and SW (green) sides. The errors correspond to the residuals of the Gaussian fits divided by the “throughput” for the disk FWHM as determined in the Appendix. On both sides, the disk FWHM steadily decreases from 0.25″ at r = 1.5″ to 0.15″ at r = 1″. Interior to = 1″, the disk FWHM fluctuates about a constant value, though this behavior is likely due to the difficulty of fitting a Gaussian profile in speckle-dominated regions, not bona fide clumpy structure. Beyond = 1.5″, where the disk emission approaches the photon noise limit, the FWHM estimates fluctuate wildly.
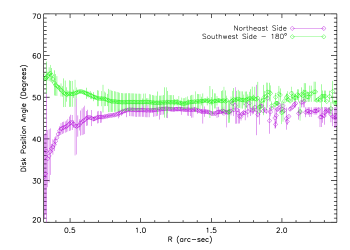
3.2. Disk Position Angle
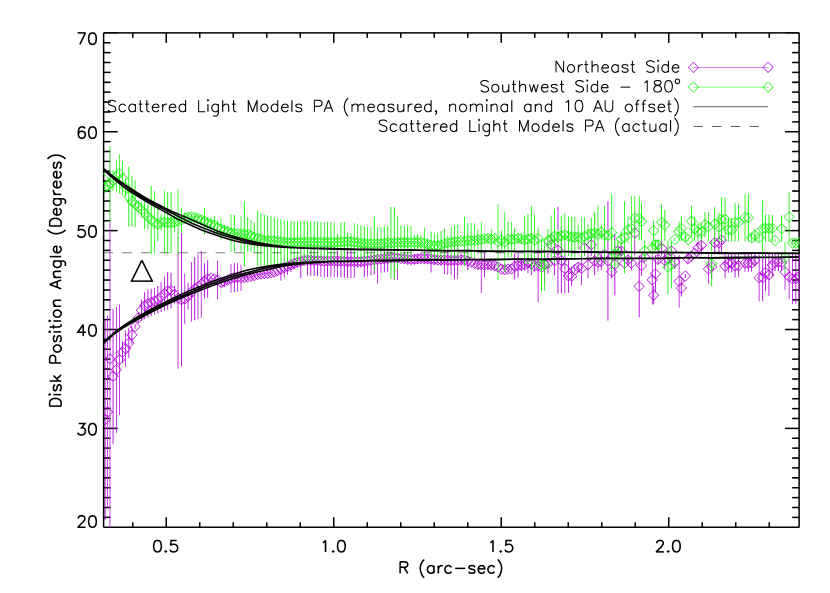
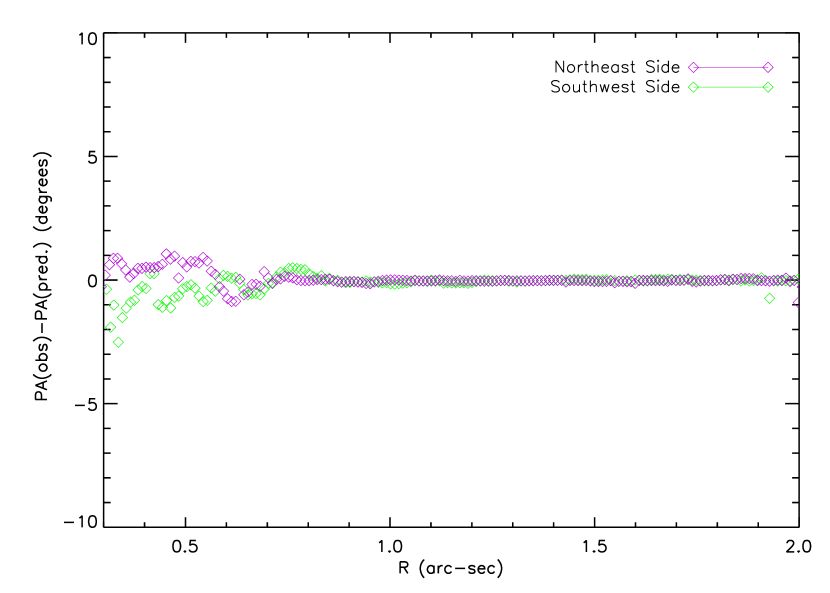
To quantify the “bow” structure easily seen in Figure 1 and identify any additional warping, we calculate the disk position angle as a function of stellocentric distance for both the NE and SW sides using the disk midplane pixel locations from the Gaussian fits described in §3.1. The position angle uncertainty at each radius results from the difference between the Gaussian-fitted disk midplane location at the radius and a midplane location defined by the brightest pixel. Here we formally assume a systematic uncertainty of 0.009∘ from the Yelda et al. astrometric calibration, although fitting errors always dominate.
Beyond r = 0.9″, both sides of the disk maintain a constant position angle, although they are misaligned by 3–4 degrees. Between 0.3″ and 0.9″, though, the disk emission on both sides curves towards the north, with the position angle decreasing on the NE side by more than 20∘ and increasing by 10∘ on the SW side. On the SW side, this curvature is not continuous, leveling off at 232∘ at 0.5–0.6″ before resuming at smaller separations. Beyond = 1.6″, the disk exhibits no obvious curvature/warping, though photon noise degrades the precision of our estimates.
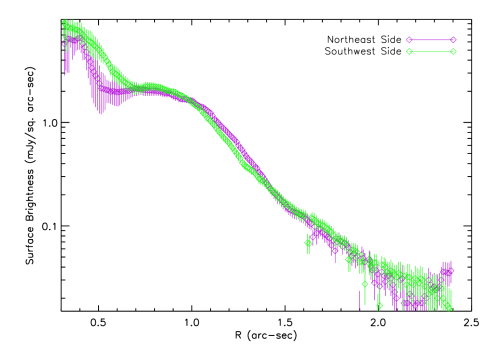
3.3. Disk Surface Brightness Profile
To calculate the disk surface brightness (SB), we follow Rodigas et al. (2012) and determine the median surface brightness in /2 in a 18-pixel diameter circular aperture. We determine uncertainties in the median disk surface brightness (also in /2) at a given angular separation in a way analogous to that which we used to determine the disk SNR/pixel. Specifically, at each pixel radius corresponding to a Gaussian-fitted disk midplane location we calculate the uncertainty in SB within non-overlapping circular apertures identical in size to that which we use to determine the disk SB and covering all azimuthal angles exterior to the disk. We adopt the standard deviation of these SB estimates as the uncertainty in the disk SB at each radius.
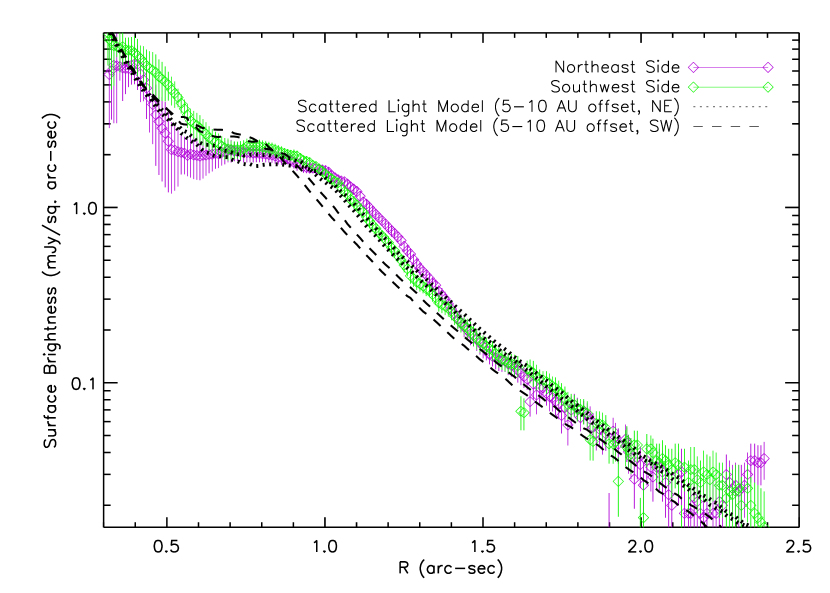
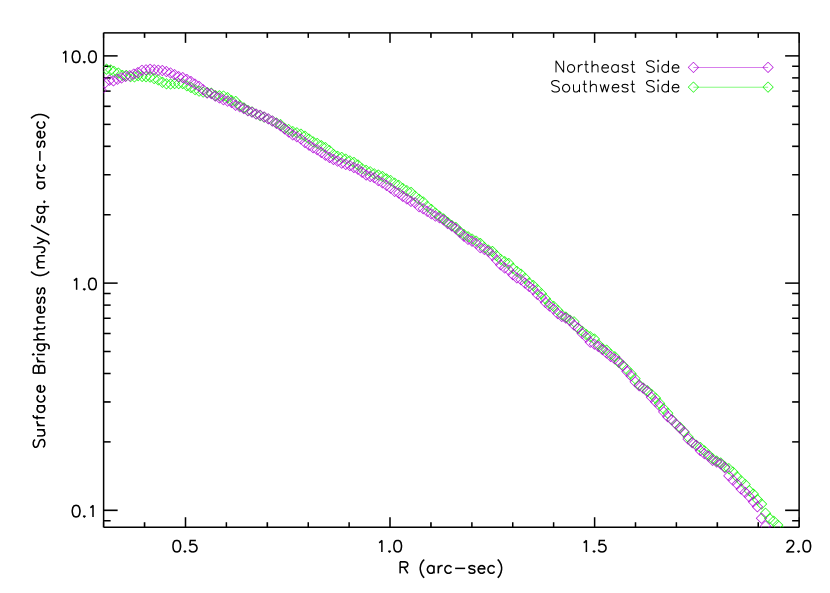
Figure 4 displays the surface brightness profiles for both sides of the disk. On both sides, the disk steadily brightens from = 2.5″ to = 1″. However, at smaller separations the profiles change dramatically. On the NE side, the disk has a roughly constant brightness at 0.5–0.9″ before brightening from 3 to 6 / at 0.5″ to 0.4″. The SW side of the disk displays a similar behavior: a nearly constant brightness at 0.7–0.9″, a possible slight dip in brightness at 0.7″, and a sharp jump in brightness by a factor of 4 from 0.7″ to 0.4″. Thus, the disk SB profile appears “wavy” interior to = 1″.
The two sides of the disk differ slightly in some other important respects. The locations of the peaks/plateaus closer to the star for the NE side than for the SW side. The shifted profiles are consistent with the dust ring being located at different stellocentric distances between the NE and SW sides: a pericenter offset. The NE side also plateaus and may drop slightly at 0.3–0.35″. Conversely, on the SW side the disk continues to brighten all the way to our inner working angle of 0.3″.
Moreover, our analysis confirms evidence for a brightness asymmetry between the NE and SW sides. These differences are significant even at small separations where we detect the disk at a lower SNR. Interior to 0.6″, the median uncertainty in the disk SB is 2.8 on the NE side and 4.6 on the SW side. While these uncertainties are large, they are significantly smaller than the brightness differences at = 0.5–0.6″, where the SW side is 2–3 times brighter. At these angular separations, the +/- 1- range in SB between the two sides do not overlap. The SW side of the disk is 50% brighter at r 0.3–0.4″, although the large error bars for the NE side SB make this difference less statistically significant.
We model the surface brightness profiles over = 0.3–2.5″ to derive power law indices and assuming a functional form of = Xb. As a first guess, we take the logarithm of the surface brightness, adopt uniform weighting to each datapoint, and estimate the power indices by fitting a straight line and deriving the slope. We then refine our power law index estimates by performing a Levenberg-Marquardt minimization, while considering measurement errors. To more precisely estimate the locations of the power law breaks, we perform the above steps iteratively, varying the break locations and adopting ones that minimize the reduced between the data and the model.
Table 1 summarizes our results. We fail to identify any power law to either lobe that quantitatively fits the entire radial extent of the disk. For the NE (SW) side, the goodness-of-fit value () declines to zero at 1.0″ (0.9″). Assuming a single power law for both sides, we derive best-fit coefficients of = 2.13, = -6.01 at = 1.05–2.5″ for the NE side and = 1.72, = -5.49 for the SW side at = 0.95–2.5″. However, the goodness-of-fit criterion for the NE side is low ( 0.75), indicating that at least this side may be best modeled as a broken power law (see also Schneider et al., 2005; Debes et al., 2009).
For the NE side, the best-fit indices assuming a broken power law are = 2.23, = -6.19 at = 1.1–1.4″ and = 1.31, = -5.13 at = 1.4–2.5″. For the SW side, the best-fit indices are similar: = 1.78, = -5.71 at = 1–1.6″ and = 1.66, = -5.33 at = 1.65–2.5″222While the inner and outer fitted radii reported here are the ones for which a power law fit is most applicable, we obtain similar results for slightly different radii: e.g. for = 0.95″ and =1.65″.. Formally, our values for have a large uncertainty since the goodness-of-fit criterion remains above 0.95 for 20% and 0.5.
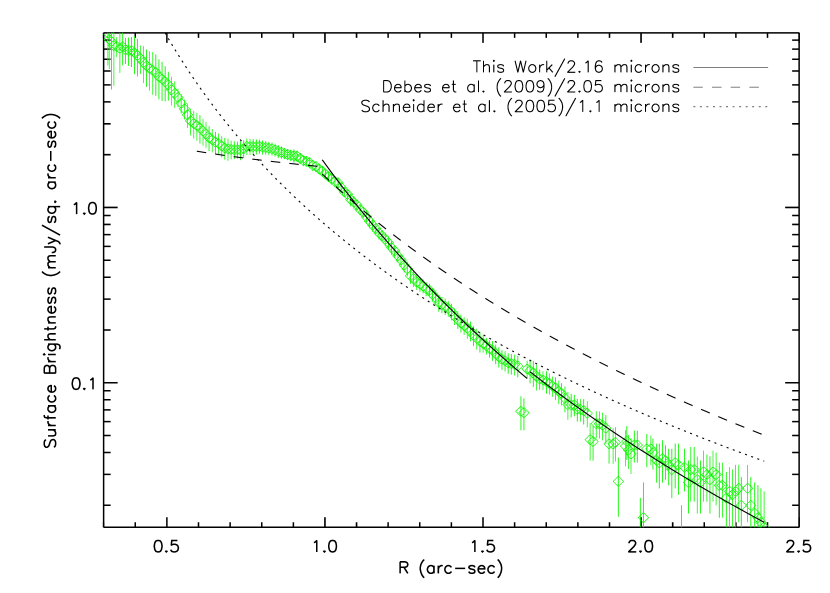
We can compare our SB profiles to those from Schneider et al. (2005) and Debes et al. (2009) to understand how the profiles change with wavelength. In general, the shape of the SB profiles show good agreement with those derived from 1.1 data by Schneider et al. (2005). Although they do not draw attention to any steep increase in SB at = 0.5–0.7″, their Figure 2 provides some evidence for this feature, at least on the SW side. While we do not find evidence for a steep drop in SB at = 0.3–0.5″ for the NE side as they do, the SB does plateau at = 0.4″ and drop slightly. The 2.05 profile from Debes et al. (2009) does not extend to 0.5–0.6″, so we cannot know whether they too find evidence for a jump in SB at small separations. Our profiles are significantly steeper than those from Schneider et al. (2005) and Debes et al. (2009) at 1 ″ obtained at shorter wavelengths (Figure 5).
4. Debris Disk Modeling
4.1. Scattered Light Modeling
To understand the disk’s grain properties and morphology, we compare our image to synethetic resolved disk models with a range of scattering properties. We modeled a number density distribution of dust for the disk in the following cylindrical form, which allows for a variety of disk morphologies:
| (1) | |||||
| (2) |
where can be interpreted as the location of a birth ring of planetesimals generating a collisional cascade of dust with a characteristic width . We assume a Gaussian scale height to the disk at all radii, and we allow for a power-law decrease in dust density beyond some radius , thus allowing for combinations of ring-like and disk-like structures. We place dust particles at various distances from the star following the density distribution above and distribute them uniformly in the azimuthal angle (). To derive the integrated surface brightness, we project the density distribution on a two dimensional plane after transforming the coordinates of dust particles to account for inclination and position angle and scale the result to the observed surface brightness of the disk in the Keck images. The surface brightness, , of each particle is determined from its distance from the star and its scattering angle assuming a two component Henyey-Greenstein phase function:
| (3) |
A multi-component phase function for circumstellar dust may be favored. For example, the phase function of zodiacal dust in the Solar System has been modeled with multiple Henyey-Greenstein components, including a significant backscattering component (Hong et al., 1985). Recently, observations of HR 4796A’s disk surface brightness as a function of scattering angle showed an incredibly flat inferred phase function for its dust at scattering angles (Dalle Ore et al., 2011), and observations of the protoplanetary disk HD 100546 at multiple wavelengths require forward scattering grains where the phase function becomes flatter at scattering angles (Mulders et al., 2012).
Figure 6 displays the model that best reproduces the overall disk morphology and two rejected models. We attempted several possible structures and combinations of parameters, obtaining a good fit to the data with the model presented in Table 2 and shown in the left panel. A more rigorous exploration of parameter space and their possible degeneracies is beyond the scope of this paper.
To account for its warped, bow-shaped appearance, the disk must contain some highly forward scattering grains at 110 AU, which cause a brightness asymmetry between the front and back sides of the disk. At low scattering angles (small projected separations) the brightness asymmetry is more pronounced than at larger projected separations, causing a change in the midplane position angle. This type of “warping” structure is also seen in HD 15115 (Debes et al., 2008; Rodigas et al., 2012). However, the sharp breaks in the surface brightness at 1″ are hard to reproduce with typical single component Henyey-Greenstein phase functions (middle panel), requiring a flatter phase function at larger scattering angles (left panel). The surface brightness breaks could conceivably be reproduced by a superposition of two rings of isotropically scattering dust (right panel), but such a configuration does not give rise to the disk’s warped appearance. We cannot exclude the presence of a second inner ring (i.e. at 35–50 AU) for our modeled dust phase function, especially if the dust in the disk at wider separations is slightly less forward scattering than we have modeled. This would allow the inner disk to dominate the surface brightness at small projected separations.
Although our two-component forward scattering model is simple, it reproduces some key disk features. Figure 7 and 8 (left panel) compares this model to the observed SB profile. The model clearly succeeds in reproducing the disk warping at 1″ and the surface brightness profile break/turnover at 110 AU. The model grains’ strong forward scattering at small angles causes the disk to appear very bright again at small projected separations ( 0.6″). This feature agrees with our measured SB profile (Figure 8), though taken at face value the model predicts that this brightness accelerates, whereas the measured profile appears to flatten at 0.4″, especially for the NE side. Furthermore, our scattered light model predicts that the disk emission should be roughly axisymmetric. However, at 0.6″ the disk’s SW side is significantly brighter and the profile breaks appear offset.
The disk’s asymmetric SB profile breaks could indicate an asymmetry in the disk’s distance from the star as a function of position angle: e.g. a pericenter offset. To investigate whether a pericenter offset better reproduces the SB profile, we reconstruct a scattered light model with identical grain scattering properties as our two-component model but make the SW side of the disk 5–10 AU closer to the star than the NE side (Figure 8). This model predicts that the NE side’s SB profile break starts at wider separations ( 1.1″ vs. 0.9″ for the SW side) and that the SW side should be brighter at 0.5–0.9″, in agreement with the observed SB profiles.
The pericenter offset model’s fidelity isn’t perfect: the SW side is significantly underluminous and the exact locations of the breaks are not well reproduced. However, its success in reproducing the asymmetric SB profile breaks motivates more detailed scattered light disk modeling. In particular, all single ring models (regardless of any pericenter offset) predict that the disk’s sides should be equally luminous at 0.3–0.4″. Our data indicate otherwise (the SW side is still brighter by 50%), suggesting the need for further modifications for our scattered light model. New, higher SNR images of HD 32297’s disk will clarify the angular separation range over which the SW side is brighter and thus provide important constraints for future disk modeling.
4.2. Spectral Energy Distribution Modeling
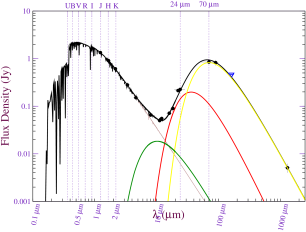
For a separate but related probe of the HD 32297 disk properties, we modeled the disk spectral energy distribution (SED) from point-source photometry including newly-available data from the Spitzer Space Telescope, WISE mission, and AKARI satellite (Werner et al., 2004; Wright et al., 2010; Murakami et al., 2007). Table 3 lists the photometric data we consider.
Our methods follow those outlined in Plavchan et al. (2009), where we identify the best-fit dust temperature(s), grain properties, and effective emitting areas incorporating a downhill simplex algorithm (“Amoeba”) as described in Press et al. (1992). We consider cases where the dust radiates like a blackbody such that = (280K/T)2 and where the dust’s emissivity scales with the effective grain size beyond a critical wavelength (Backman et al., 1992), , which can place grains of a given temperature at larger distances. We solve for the disk model parameters that minimize the fit residuals relative to the flux ( = ). In all cases, we assume that the grain populations have a characteristic size: for simplicity, we do not consider a grain size distribution.
Even though we include photometry not previously modeled, our fits are likely to be highly degenerate (e.g. Maness et al., 2008; Fitzgerald et al., 2007). Therefore, instead of identifying the single best-fit model and 95% confidence interval, we use several separate SED model runs to explore more focused questions about the HD 32297 disk properties:
-
•
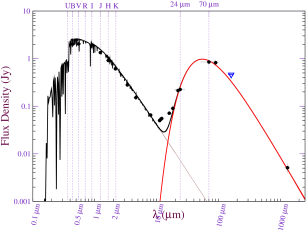
Model 1 – A Single Dust Population – Here we assume that only one dust population contributes to the disk’s IR-to-mm emission and allow to vary. Our goal with this fit is to determine whether HD 32297’s disk must have more than one dust population.
-
•
Model 2 – Two Dust Populations, One Dust Belt at a Fixed Location – Here we include two dust populations and allow their emissivity laws to vary but fix them to the same location. We place the belt at = 85 AU, or roughly interior to where the disk surface brightness profile begins to flatten. Our goal here is to determine whether more than one dust location is required.
-
•
Models 3–5 – Two Dust Populations/Belts, Fixed Emissivity – Here we identify the best-fitting model with two dust populations in two distinct belts, assuming either that the grains behave as blackbodies or have a emissivity law. This approach follows that of Maness et al. (2008) and will allow us to assess whether their formalism provides a better match to the photometry than assuming one dust population/belt.
-
•
Model 6 – Two Dust Populations/Belts, Variable Emissivity, Fixed Location – Here, we fix the locations of the dust to the peak of the surface brightness profiles: 0.4″ and 1″ or 45 AU and 110 AU, which roughly cover the locations of the SB plateaus in the NE and SW sides. Our goal here is to see whether we can identify a good-fitting disk model that identifies the local maxima in the surface brightness profile as the locations of two separate debris belts.
-
•
Models 7-9 – Three Dust Populations/Belts, Variable Emissivity, Variable/Fixed Location – Maness et al. (2008) suggest that three separate dust populations are needed to fit the HD 32297 SED. In one case, we fix all the belts to be at 85 AU and incorporate a third, warmer dust population varying in grain size and emissivity. In two cases, we fix the outer two dust belts at 45 AU and 110 AU, while varying grain size and emissivity and incorporate a third warmer dust population varying in in radius, grain size, and emissivity.
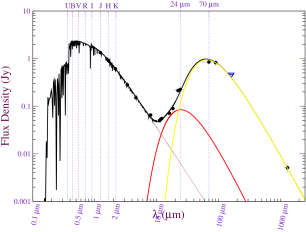
Figure 9 displays some of our SED modeling results, which are reported in Table 4. For all best-fit models, the stellar effective temperature is 7870-7890 K and the star has little extinction ( 0.03). Regardless of our assumed particle emissivity law, a single dust population model (Model 1, top-left panel) poorly reproduces the SED, as was found previously (Fitzgerald et al., 2007), significantly underpredicting the flux density at 8–22 . Formally, having two or three dust populations in one belt at 85 AU (i.e. top-right panel) significantly improves the fit ( = 0.05–0.08). However, the required grain sizes are too small ( 4 nm–0.2 ) to be realistic. Thus, the dust likely arises from more than one single-temperature dust population with given grain size and emissivity power law.
Fits assuming blackbody grains but incorporating two dust components at different locations significantly improve the fit ( 0.16; top-right) compared to a single dust component model. The fits imply that the dust responsible for 10–1000 emission is at 1.2–22 AU or 0.01–0.2″, but Fitzgerald et al. (2007), Moerchen et al. (2007), and Maness et al. (2008) show that the disk emission instead originates on scales more comparable to 30–100 AU. The broad range of orbital radii is indicative of the significant model degeneracies involved. Assuming that at least one of the dust components has an emissivity of = 1 yields fits with larger grains (0.3–3 ) but worsens the fit ( 0.17–0.21). Thus, if the dust disk geometries approximate thin, isothermal rings and consistent of grains dominated by a single, characteristic size, the grains likely have emissivity power laws somewhere between 0 and 1.
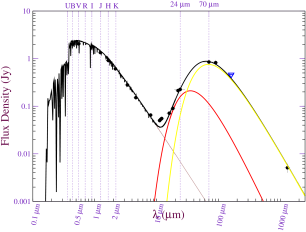
The bottom panels of Figure 9 show that it might be possible for the debris rings to reside at locations equal to the scattered light brightness peaks ( 45 AU, 110 AU) and reproduce the IR to mm disk emission. A two dust population model (Model 6; bottom-left) reproduces the SED well at 1–8 and 17–1300 but underpredicts the disk emission at 12 by 50%. Starting with the Model 6 results and incorporating a third dust population, we reproduce the SED if the dust is at 14 AU (171 K), although the emissivity power law for this population is unphysical ( 7.3)333This model run finds 7.3 as the “best-fit” model because the Amoeba code treats as a true free parameter, regardless of whether the value is physical, and exploits a gap in SED coverage at 10 to achieve a better fit. and the grain sizes for the coldest dust component are too small (Model 8). However, allowing the emissivity law and grain sizes for all three components to vary yields an excellent fit to the data (RMS 0.06). The emissivity laws and grain sizes for this model (Model 9; bottom-right) are reasonable ( = 0.37–0.77; = 0.20–0.70 ). Here, the third component is at 1 AU with a temperature of 430 K and is responsible for the weak 8 excess and substantially contributes to the disk emission at 12–17 . Thus, although it is not necessary, it is at least possible to identify the surface brightness profile peaks at 45 AU and 110 AU with separate thin dust rings responsible for broadband emission at 8–1300 provided that there exists an unresolved, warmer dust component located interior to 45 AU.
We emphasize that the model fits we report in Table 4 are but some of many possibile fits, the range of which is further limited by our input assumptions about the disk. For example, because our model is set up only to consider infinitely thin, isothermal rings, it is unclear whether the warmer dust emission we identify originates in a separate ring or rather an annulus, the outer edge of which we see at wider separations. Given the extreme number of model degeneracies, the most we can say is that 1) the debris emission must originate from more than one population at 2) multiple locations and 3) among the many possibile configurations, the dust populations may coincide with the surface brightness peaks. To make further progress, we need high spatial resolution, high SNR imaging of the disk at a wider range of wavelengths to derive much more stringent constraints on the dust sizes/scattering properties and location(s) of the dust population(s) (e.g. Debes et al., 2009; Rodigas et al., 2012).
5. Comparisons to Previous HD 32297 Results
From optical coronagraphic imaging, Kalas et al. (2005) find evidence for warping in the HD 32297’s disk, especially for the NE side, where the disk at 500–600 AU appears swept back compared to midplane regions at smaller angular separations. They attribute the warp to ISM sculpting of the disk as it moves south through ISM material. The warped structure we resolve curves in the opposite direction from that expected due to ISM sculpting (see images for HD 32297/15115/61005 from Debes et al., 2009) and does so for both sides of the disk. Furthermore, ISM sculpting should be prominent only at larger separations in our images, where the disk is weakly detected ( 1.5″), because the grains need time to become entrained in the ISM flow (e.g. Debes et al., 2009). However, optical and near-IR imaging probe two very different characteristic grain populations, and the size scales over which we resolve the disk do not overlap. Thus, our results are not in conflict. Rather, ISM sculpting may explain the optical image but does not explain the near-IR image.
We confirm and clarify three major claims from previous near-IR imaging (Schneider et al., 2005; Mawet et al., 2009; Debes et al., 2009). First, we verify the brightness asymmetry found by Schneider et al. and Mawet et al. (2009) at small ( 45–55 AU) separations and show that it persists down to 35 AU, albeit at a lower statistical significance. Second, we recover a break/deviation in the SB power law at 100 AU found by Debes et al. (2009). Our new results show that the SB profile at smaller separations does not follow an extension of the power law describing the disk at larger separations: instead, it appears wavy. Finally, Mawet et al. (2009) claim that the NE side of the disk emission is truncated at 0.6″. We find that the NE SB profile flattens (not brightens) from 1″ to 0.5″. Assuming that their coronagraph attenuates some flux at separations slighter greater than their inner working angle (0.4″), most of the NE side emission will be hidden from their view. In contrast, the SW side clearly begins to brighten at wider separations ( 0.5–0.6″) visible by Mawet et al. (2009). Thus, our results agree.
Thermal IR imaging from Fitzgerald et al. (2007) and Moerchen et al. (2007) shows that the HD 32297 disk has an inner clearing devoid of grains slightly larger than those we can probe with our data. Fitzgerald et al. find that the disk exhibits a bilobed structure and most of its 11.2 emission originates from 0.5–0.6″, characteristic of a dust ring with an inner edge at 60 AU. Moerchen et al. resolve the disk at 12 and 18 out to slightly wider separations ( 1.3″). Based on the disk’s brightness temperature, they likewise find evidence for an inner clearing, albeit one that is slightly larger ( 80 AU). The plateaus in our SB profiles could identify the inner boundaries of dust populations (e.g. Rodigas et al., 2012). Under this interpretation, our image is consistent with a dust belt truncated at 1″ ( 110 AU) and a second one at 0.4–0.6″ (45–70 AU). Because these authors did not analyze their data in the same way it is difficult to compare their results between each other and their combined results against ours. Still, their results and ours are qualitatively consistent with the HD 32297 disk having at least one dust population truncated at small separations.
In agreement with Maness et al. (2008)’s mm study, we find evidence for at least two dust grain populations, responsible for the mid-IR excess emission and far-IR/submm excess, respectively (see also Moerchen et al., 2007). They are able to fit the SED from 1 to 100 but not 1300 , a discrepancy they explain by adding a third, cold dust population. Our modeling generally fits the SED from 17 to 1300 but slightly underpredicts emission at 12 , a discrepancy we can solve if there exists an additional, unresolved warm dust population. Our different results are likely a byproduct of our modeling assumptions: they allow the dust populations to be spatially extended but fix the particle emissivity law, whereas we assume the dust is confined in isothermal rings but allow the emissivity law to vary.
As noted in §3, the peak of HD 32297’s mm emission from Maness et al. lies close to the bright inner disk region on the SW side. While formally the position angle ( 46∘) of the mm emission is offset by 10 degrees, it tracks the disk’s position angle at wider separations much better. The disk’s warped appearance at 1″ is due to its strong forward scattering at small angles. If the disk’s grains instead isotropically scattered starlight, its emission would lie almost directly on top of the mm peak. Thus, we identify the mm and near-IR brightness asymmetry as originating from the same location. Assuming the grains responsible for both the mm and near-IR emission are likely the result of collisions, they may trace the same parent population of planetesimals.
5.1. Summary and Future Work
Using Keck/NIRC2 coronagraphic imaging, we resolve the HD 32297 disk at a high signal-to-noise from = 0.3″ to = 2.5″. We determine basic disk properties (SB, FWHM, position angle), compare our image to disk models with a range of (grain) scattering properties, and model newly-available, broadband photometry to provide a complementary investigation of HD 32297’s circumstellar environment. We obtain the following major results:
-
•
1. We discover that HD 32297’s debris disk exhibits a prominent warped or “bow”-shaped structure interior to 1 ″ ( 110 AU).
-
•
2. Our new data clarifies the disk’s surface brightness profile at small separations. We find that it has a “wavy” profile interior to 110 AU with a plateau extending to 0.5–0.7″ (55–80 AU) before the disk brightens by factors of 3–4 at smaller separations.
-
•
3. The disk exhibits significant asymmetries between the two sides. The SW side is brighter at 0.3–0.6″ by 50–150%, with the most statistical differences being at 0.5–0.6″. These separations are roughly where the disk’s mm emission peaks and are consistent with previous results (e.g. Schneider et al., 2005). Our new analysis identifies new asymmetries, revealing that the locations of the peaks/plateaus in surface brightness are likely shifted between the two sides, consistent with non-azimuthally symmetric structure.
-
•
4. A disk model with a flat phase function and strongly forward scattering grains where the dust ring is centered on the star reproduces the “bow” structure, marginally reproduces the “wavy” SB profile and fails to reproduce the NE/SW asymmetries. A disk model with a 5–10 AU pericenter offset reproduces the asymmetric SB profile breaks interior to 1″, although its brightness asymmetry is limited to 0.5–0.9″ and its match to the SB at wider separations is far poorer. Thus, dust scattering plays a critical role in explaining key observed disk properties, but it is unclear whether it explains all of the disk’s properties we identify.
-
•
5. HD 32297 must be surrounded by more than one dust population likely arising from different locations in the disk. Although these populations need not be identifiable from our image, we can fit the disk SED by placing dust populations at the locations of the SB peaks from our image provided that there exists additional warm dust that we cannot yet resolve.
-
•
6. The disk’s brightness peak at 0.4″ coincides with the peak mm emission (Maness et al., 2008). If the grains responsible for both peaks are the result of collisions, they may trace the same parent population of planetesimals.
In summary, the HD 32297 disk appearance is broadly shaped by ISM interactions (Kalas et al., 2005; Debes et al., 2009) at wide separations and by its grain scattering properties at small separations (this work). However, it is unclear whether either of these features by themselves explain the disk’s SB profile and (especially) the disk’s brightness asymmetry. Furthermore, SED modeling provides evidence for multiple dust populations, possibly multiple belts. To explain the disk’s SB profile/multiple dust populations and (especially) brightness asymmetry, we may need to invoke other mechanisms.
Planets can sculpt dust into debris rings (e.g. Kalas, 2005; Quillen et al., 2006; Kalas et al., 2008). Furthermore, planets can trap dust into resonant structures, which can appear as bright, overdense regions like the brightness peak imaged here and in the mm at 0.4″ (e.g. Liou and Zook, 1999; Kuchner and Holman, 2003; Stark and Kuchner, 2008). As argued by Wyatt et al. (2006) and Maness et al. (2008), the detectability of the resonant structure may be wavelength dependent. Large grains producing mm emission are fragments of the colliding planetesimals in resonance, but cannot be rapidly removed by radiative forces. Thus they can trace the parent body resonant structure. Small, (sub)-micron sized grains likewise may trace resonant structure since they are preferentially produced in the most collisionally active, highest density regions and are otherwise quickly removed by radiation pressure. Grains with intermediate sizes producing emission at intermediate wavelengths (e.g. thermal IR) can be pushed out of resonance by radiation pressure/PR drag but are not small enough to be rapidly removed from the system (Wyatt et al. 2006; though see Kuchner and Stark 2010). Thus, it is possible that our near-IR image, when combined with the mm image, identifies planet-induced structure.
Further near-IR and (sub)mm imaging is required to verify whether the SB profiles and brightness asymmetries are bona fide evidence for an embedded planet. The current state-of-the-art near-to-mid IR high-contrast imaging facilities like the Large Binocular Telescope have already shown great promise for resolving disk’s like HD 32297’s in scattered light and imaging self-luminous gas giant planets (Rodigas et al., 2012; Skemer et al., 2012) and upcoming planet imagers like SCExAO on Subaru, GPI on Gemini-South, and SPHERE on the VLT will be even more capable (Esposito et al., 2011; Martinache and Guyon, 2009; Macintosh et al., 2008; Beuzit et al., 2008). Moreover, the thermal IR is well suited for imaging exoplanets with a wide range of ages (e.g. Marois et al., 2010; Currie et al., 2011b; Rodigas et al., 2011), especially for stars like HD 32297 whose bright, edge-on debris disk degrades planet sensitivity limits in the near-IR. Imaging with the Atacama Large Millimeter Array (ALMA) can resolve the HD 32297 debris disk up to factor of 50 better than the CARMA observations reported by Maness et al. and thus will provide a far better probe of any planet-induced structure in the HD 32297 debris disk.
References
- Augereau et al. (2001) Augereau, J. C., 2001, A&A, 370, 440
- Backman et al. (1992) Backman, D., et al., 1992, ApJ, 385, 670
- Beuzit et al. (2008) Beuzit, J.-L., et al., 2008, SPIE, 7014, 41
- Buenzli et al. (2010) Buenzli, E., et al., 2010, A&A, 524, 1L
- Currie et al. (2008) Currie, T., et al., 2008, ApJ, 672, 558
- Currie et al. (2009) Currie, T., Lada, C. J, et al., 2009, ApJ, 698, 1
- Currie et al. (2010) Currie, T., et al., ApJ, 2010, 721, 177L
- Currie et al. (2011a) Currie, T., Burrows, A., et al., 2011a, ApJ, 729, 128
- Currie et al. (2011b) Currie, T., Thalmann, C., et al., 2011b, ApJ, 734, 36L
- Currie et al. (2012) Currie, T., Fukagawa, M., et al., 2012, ApJ submitted, arXiv:1206.0483
- Dalle Ore et al. (2011) Dalle Ore, C. M., et al., 2011, A&A, 533, 98
- Dawson et al. (2011) Dawson, R., Murray-Clay, R., Fabrycky, D., 2011, ApJ, 743, 17L
- Debes et al. (2008) Debes, J. H., et al., 2008, ApJ, 684, 41L
- Debes et al. (2009) Debes, J. H., et al., 2009, ApJ, 702, 318
- Esposito et al. (2011) Esposito, S., et al., 2011, SPIE, 8149, 1
- Fitzgerald et al. (2007) Fitzgerald, M., et al., 2007, ApJ, 670, 557
- Fitzgerald et al. (2010) Fitzgerald, M., et al., 2010, Proceedings of the conference In the Spirit of Lyot 2010: Direct Detection of Exoplanets and Circumstellar Disks, October 25 - 29, 2010, University of Paris Diderot, Paris, France. Ed. Anthony Boccaletti.
- Golimowski et al. (2006) Golimowski, D., et al., 2006, AJ, 131, 3109
- Heap et al. (2000) Heap, S., et al., 2000, ApJ, 539, 435
- Hines et al. (2007) Hines, D., et al., 2007, ApJ, 671, 165L
- Hong et al. (1985) Hong, S. S., 1985, A&A, 146, 67
- Kalas et al. (2005) Kalas, P., Graham, J., and Clampin, M., 2005, Nature, 435, 1067
- Kalas (2005) Kalas, P., 2005b, ApJ, 635, 169L
- Kalas et al. (2007) Kalas, P., et al. 2007, ApJ, 661, 85L
- Kalas et al. (2008) Kalas, P., et al., 2008, Science, 322, 1345
- Kenyon and Bromley (2008) Kenyon, S. J., Bromley, B., 2008, ApJS, 179, 451
- Kuchner and Holman (2003) Kuchner, M., Holman, M., 2003, ApJ, 588, 1110
- Kuchner and Stark (2010) Kuchner, M., Stark, C., 2010, AJ, 140, 1007
- Lafreniere et al. (2007) Lafreniere, D., et al., 2007, ApJ, 660, 770
- Lagrange et al. (2010) Lagrange, A.-M., et al., 2010, Science, 329, 57
- Liou and Zook (1999) Liou, J. C., Zook, H., 1999, AJ, 118, 580
- Macintosh et al. (2008) MacIntosh, B., et al., 2008, SPIE, 7015, 31
- Martinache and Guyon (2009) Martinache, F., Guyon, O., 2009, SPIE, 7440, 20
- Maness et al. (2008) Maness, H., et al., 2008, ApJ, 686, 25L
- Marois et al. (2006) Marois, C., et al., 2006, ApJ, 641, 556
- Marois et al. (2008) Marois, C., et al., 2008, Science, 322, 1348
- Marois et al. (2010) Marois, C., et al., 2010, Nature, 468, 1080
- Mawet et al. (2009) Mawet, D., et al., 2009, 702, 47L
- Metchev et al. (2009) Metchev, S., Marois, C., Hillenbrand, L., 2009, ApJS, 181, 62
- Moerchen et al. (2007) Moerchen, M., et al., 2007, ApJ, 666, 109L
- Mulders et al. (2012) Mulders, G., et al., 2012, A&A submitted
- Murakami et al. (2007) Murakami, H., et al., 2007, PASJ, 59, 369
- Plavchan et al. (2009) Plavchan, P., et al., 2009, ApJS, 698, 1068
- Press et al. (1992) Press, W., et al., 1992, Numerical Recipes in Fortran: The Art of Scientific Computing, Cambridge: University Press, 1992, 2nd ed.
- Quillen et al. (2006) Quillen, A., 2006, MNRAS, 372, 14L
- Rhee et al. (2007) Rhee, J., et al., 2007, ApJ, 660, 1556
- Rodigas et al. (2011) Rodigas, T. J., et al,. 2011, ApJ, 732, 32L
- Rodigas et al. (2012) Rodigas, T. J., et al., 2012, ApJ in press
- Schneider et al. (2005) Schneider, G., et al., 2005, 629, 117L
- Skemer et al. (2012) Skemer, A., et al., 2012, ApJ submitted
- Smith and Terrile (1984) Smith, B., Terrile, R. J., 1984, Science, 226, 1421
- Stark and Kuchner (2008) Stark, C., Kuchner, M., 2008, ApJ, 686, 637
- Su et al. (2009) Su, K., et al., 2009, ApJ, 705, 314
- Thalmann et al. (2011) Thalmann, C., et al., 2011, ApJ, 743, 6L
- van Leeuwen (2007) van Leeuwen, F, 2007, A&A, 474, 653
- Werner et al. (2004) Werner, M., et al., 2004, ApJS, 154, 1
- Wright et al. (2010) Wright, E. L., et al., 2010, AJ, 140, 1868
- Wyatt et al. (1999) Wyatt, M., et al., 1999, ApJ, 527, 918
- Wyatt et al. (2006) Wyatt, M., et al., 2006, ApJ, 639, 1153
- Wyatt (2008) Wyatt, M., 2008, ARA&A, 46, 339
- Yelda et al. (2010) Yelda, S., et al., 2010, ApJ, 725, 331
| Angular Separation (″) | a,b(NE) | a,b(SW) |
|---|---|---|
| Single Power Law | ||
| = 1–2.5 | 2.13, -6.01 | 1.72, -5.49 |
| Broken Power Law | ||
| = 1.1–1.4 | 2.23,-6.19 | – |
| = 1–1.6 | – | 1.78, -5.71 |
| = 1.4–2.5 | 1.31,-5.13 | – |
| = 1.65–2.5 | – | 1.66,-5.33 |
Note. — Surface brightness profiles for the NE and SW sides determined by a Levenberg-Marquardt least-squares fit to the data. We assume a simple power law functional form of = Xb. Power laws in agreement with the data at the 95% confidence limit include values for that vary by 10% and values for that vary by 0.5 dex.
| HD 32297 Scattered Light Model Parameters | |
|---|---|
| 110 AU | |
| 13 AU | |
| FWHMr | 30 AU |
| 2 AU | |
| FWHMz | 5 AU |
| 110 AU | |
| 0.96 | |
| 0.9 | |
| -0.1 | |
| 0.1 | |
| 3.4 | |
| 2 | |
| Position Angle | 47.5 |
| Filter/Wavelength | Flux (mJy) | Flux (mJy) | Source |
|---|---|---|---|
| /0.4380 | 1836.74 | 28.75 | TYCHO-II(trans) |
| /0.545 | 2012.91 | 24.10 | TYCHO-II(trans) |
| /1.235 | 1341.80 | 34.96 | 2MASS |
| /1.662 | 913.48 | 50.58 | 2MASS |
| 2.159 | 611.41 | 11.95 | 2MASS |
| 3.37 | 280.23 | 8.21 | WISE |
| 4.62 | 151.28 | 3.78 | WISE |
| 8 | 65.18 | 2.75 | IRSep |
| 11.2 | 49.9 | 2.1 | Fitzgerald et al. (2007) |
| 11.66 | 53 | 5.3 | Moerchen et al. (2007) |
| 12.08 | 55.25 | 1.20 | WISE |
| 16 | 71.28 | 2.53 | IRSep |
| 18.3 | 90 | 13.5 | Moerchen et al. (2007) |
| 22.19 | 212.99 | 5.55 | WISE |
| 24 | 225.2 | 4.82 | IRSep |
| 70 | 850 | 60 | IRSep |
| 90 | 823.2 | 116 | AKARI |
| 160 | 460 | IRSep | |
| 1300 | 5.1 | 1.1 | CARMA/Maness et al. (2008) |
Note. — TYCHO-II(trans) refers to TYCHO-II catalog data transformed into the standard Johnson-Cousins photometric system. IRSep refers to the IRS enhanced products dataset as queried from the NASA/IPAC Infrared Science Archive.
| Model ID | RMS | (AU) | () | |||||||
|---|---|---|---|---|---|---|---|---|---|---|
| 1 | 0.23 | 85 | – | – | 0.94 | – | – | 0.095 | – | – |
| 2 | 0.08 | 85 | 85 | – | 0.72 | 0.39 | – | 0.004 | 0.197 | – |
| 3 | 0.16 | 1.21 | 21.66 | – | 0 | 0 | – | 0.39 | 0.41 | – |
| 4 | 0.17 | 55.64 | 527.56 | – | 1 | 1 | – | 0.30 | 0.99 | – |
| 5 | 0.21 | 15.60 | 97.50 | – | 0 | 1 | – | 0.91 | 2.86 | – |
| 6 | 0.15 | 45 | 110 | – | 0.80 | 0.31 | – | 0.39 | 0.025 | |
| 7 | 0.05 | 85 | 85 | 85 | 0.84 | 0.61 | 0.45 | 0.006 | 0.024 | 0.725 |
| 8 | 0.09 | 14 | 45 | 110 | 7.27 | 0.80 | 0.31 | 1.59 | 0.39 | 0.03 |
| 9 | 0.06 | 1.1 | 45 | 110 | 0.37 | 0.77 | 0.43 | 0.70 | 0.37 | 0.20 |
Note. — RMS refers to the fit residuals relative to the flux = , where is the number of flux density measurements (18). refers to the dust ring’s stellocentric distance, is the particle emissivity power law, and is the grain size in microns, where 2 = (see Backman et al., 1992). Values in bold are fixed for a given model run, whereas others are ‘fitted’ values.

.
Appendix A Correcting for Disk Photometric/Astrometric Biases with LOCI
The LOCI-based PSF subtraction approach can bias the photometry and astrometry of point sources like planets and extended structure like disks (Lafreniere et al., 2007; Thalmann et al., 2011). For point source companions, imputing fake companions into registered images at a range of angular separations, processing these images, and then comparing the output to input fluxes and centroid positions of the fake sources corrects for these biases. Correcting biases for disks not viewed perfectly edge-on/pencil-thin is more difficult since we do not know, a priori, the disk’s true FWHM, our ignorance of which also limits our ability to ’debias’ other disk properties whose determination depends on the disk FWHM (i.e. surface brightness). Here we describe our method for mitigating LOCI-based photometric/astrometric biases, which largely follows that of Rodigas et al. (2012).
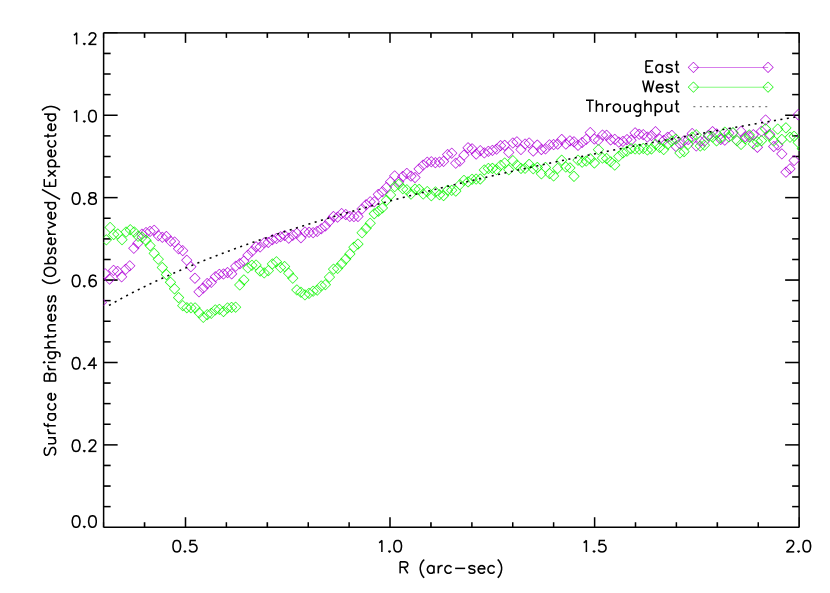
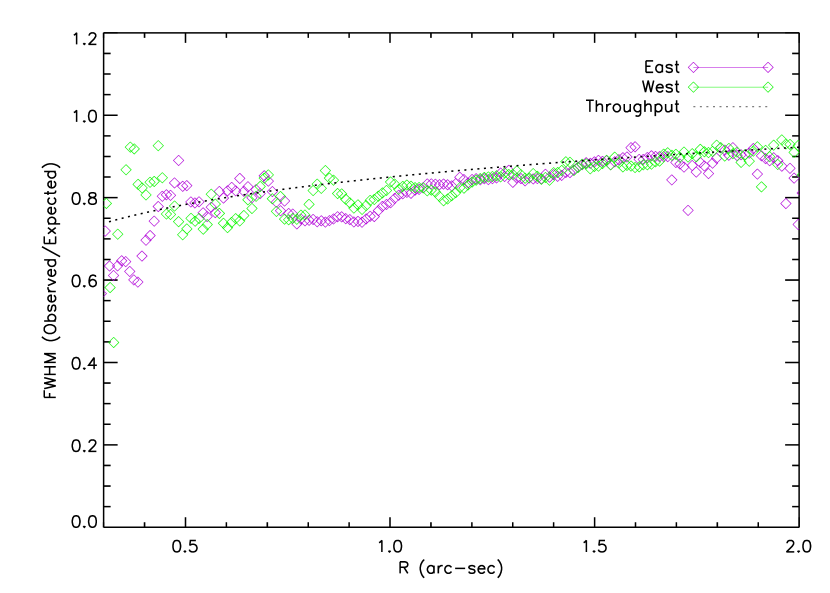
We first construct model disks each with midplane brightnesses (and thus signal-to-noise ratios) about twice that of the processed, real disk image and surface brightness profiles comparable to the real disk profiles beyond = 1″. We consider two FWHM values of 0.2″ and 0.25″ at 1″, or 20–40% larger than the values we get between = 0.3 and 1″ prior to applying the corrections we derive in this section (Figure 11, top panels). For both runs, we imput the fake disk into registered images, rerun our processing pipeline and then compare the output and input surface brightness profiles, disk thicknesses, and disk position angles.
As shown in Figure 11 (middle and bottom panels), our processing minimially biases the thinner model disk (FWHM = 0.2″) exterior to = 1″, reducing its surface brightness and thickness by no more than 20%. Interior to = 1″, the surface brightness and thickness drop to no less than 60–75% of their original values. Biasing for the FWHM = 0.25″ disk (not shown) is only slightly more severe, resulting in an additional 5% (10%) drop at 1″ ( 1″) in SB and FWHM. For both fake disks, LOCI minimally biases the disk position angle measurements (Figure 12).
The “observed” FWHM for the model with the initially thinner disk (FWHM =0.2″) is 10% smaller than the “observed FWHM for the initially thicker disk (FWHM = 0.25″) and more similar to that which we find for the real HD 32297 disk prior to applying any bias corrections. Thus, we derive throughput corrections for the disk surface brightness and FWHM for the thinner disk, fitting a simple, unweighted power law to data between = 0.3″ and = 1.5″.
The deviations in throughput for individual points vs. our throughput function are as large as 10–20%. However, our modeling errors for the disk SB and FWHM are larger in regions where biasing from LOCI is important and at 1.5–2″ where the disk is intrinsically much fainter. Therefore, we leave a more detailed, robust calibration of disk parameters from LOCI-processed images to a future work where a higher SNR disk detection at 1″ will help improve our fitting precision.