2012 \acmMonth06
Social Influence in Social Advertising:
Evidence from Field Experiments
Abstract
Social advertising uses information about consumers’ peers, including peer affiliations with a brand, product, organization, etc., to target ads and contextualize their display. This approach can increase ad efficacy for two main reasons: peers’ affiliations reflect unobserved consumer characteristics, which are correlated along the social network; and the inclusion of social cues (i.e., peers’ association with a brand) alongside ads affect responses via social influence processes. For these reasons, responses may be increased when multiple social signals are presented with ads, and when ads are affiliated with peers who are strong, rather than weak, ties.
We conduct two very large field experiments that identify the effect of social cues on consumer responses to ads, measured in terms of ad clicks and the formation of connections with the advertised entity. In the first experiment, we randomize the number of social cues present in word-of-mouth advertising, and measure how responses increase as a function of the number of cues. The second experiment examines the effect of augmenting traditional ad units with a minimal social cue (i.e., displaying a peer’s affiliation below an ad in light grey text). On average, this cue causes significant increases in ad performance. Using a measurement of tie strength based on the total amount of communication between subjects and their peers, we show that these influence effects are greatest for strong ties. Our work has implications for ad optimization, user interface design, and central questions in social science research.
category:
J.4 Social and Behavioral Sciences Sociologycategory:
J.4 Social and Behavioral Sciences Economicscategory:
H.1.2 Models and Principles User/Machine Systemskeywords:
Online advertising, peer effects, social networks Authors contributed equally to this work.
Correspondence may be sent to E.B. at ebakshy@fb.com or D.E. at deaneckles@fb.com.
1 Introduction
Social media activity now constitutes a substantial fraction of time spent on the Web [Goel et al. (2012)]. Users of social networking technologies create explicit representations of their relationships with other users (their peers) [boyd and Ellison (2007)], and use those connections as channels for information dissemination. They also establish connections with other entities in order to express their identities and subscribe to content [Sun et al. (2009)]. The widespread adoption of such technologies has led to advertising approaches that differ from existing approaches, such as search-based advertising. For example, rather than inferring consumer intent via search terms, social advertising systems can match ads to consumers who have peers that are affiliated with the brand, product, or organization being advertised [Hill et al. (2006), Tucker (2012)].
Social advertising systems can also display social context about peers who are affiliated with the entity being advertised. These social cues create a channel for consumers to influence one another. Like word-of-mouth (WOM) and “viral” marketing approaches, advertisers employ social ads with the goal of spreading attitudes and behaviors through consumers’ social networks. Thus, many of the central research questions in WOM research apply to social advertising, and research on social advertising can contribute to the broader understanding of social influence in the behavioral and economic sciences. In particular, studies of social advertising can be used to learn about how consumer responses depend on (a) the number of social signals that consumers receive from their peers (b) the characteristics of the relationship between the consumer and their peers. The present research addresses both of these topics.
Despite the similarities between WOM marketing and social advertising, there are a number of important qualities that distinguish the two. First, a minimal, “lightweight” consumer behavior (e.g., creating a connection with an entity) is sufficient to make that consumer a source of peer influence. Second, social influence via these systems is passive and automatically targeted (cf. [Aral and Walker (2011)]). That is, once an individual creates a persistent connection with an advertised entity, social influence can occur continually without additional actions, such as sharing messages with others. Finally, social advertising allows stakeholders to play a more active role in creating and funding ad campaigns with specific text, images, or video.
We regard social advertising as any advertising method that uses information about consumers’ social networks to target ads and/or provide personalized social signals. Thus, there are two ways in which the use of social information in advertising can affect consumer responses: social networks encode unobserved consumer characteristics, which allow advertisers to target likely adopters; and the inclusion of social cues creates a new channel for social influence. Recent work on social advertising (e.g., [Tucker (2012)]) has recognized these mechanisms, but has been largely unable to identify the the extent in which social influence actually plays a role. As far as we know, the present research is the first to identify the effect of social signals from peers on consumer responses to advertising. We use field experiments to make this identification possible.
1.1 Overview
We investigate the effects of social cues in online advertising using two very large field experiments that randomize the number of social cues present in ad units on Facebook. Experiment 1 examines the marginal effect of referring to additional peers in word-of-mouth-type ad units. We identify the average dose–response function (more specifically, the cue–response function), for one to three peers, whose shape and slope differs substantially from naïve estimates derived from observational data. We find that, consistent with the expectation that social cues are a channel for positive peer effects, showing more peers affiliated with the advertised entity can increase positive consumer responses.
Having established the presence of substantial social influence effects, we extend this analysis to minimal social cues about a single peer. Experiment 2 manipulates whether ads include a reference to a single peer or a visually commensurate control message. Even this minimal cue — mentioning a single peer — can cause substantial increases in clicks and the creation of connections with the advertised entity. Finally, we examine how consumer responses vary with the strength of the relationship between the consumer and affiliated peer, as measured by past communication behavior. Our results show that those with stronger ties who are affiliated with the advertised entity are more likely to respond to an ad, even if no cue is given. Furthermore, the presence of the cue for strong ties can generate larger influence effects compared to those with weak ties.
Before reporting on these experiments, we describe the causal relationships that we aim to distinguish and estimate, and we review some additional related work on online advertising and social influence.
2 Causal Relationships in Social Advertising
At a basic level, an advertisement is a stimulus designed to encourage an individual to engage with an entity, such as a brand, product, movie, musical artist, organization, etc. The efficacy of an advertisement, typically given in terms of a click-through rates or conversion rates, can depend critically upon the relationship between the entity and the characteristics of the consumer, which may include both stable traits and transient states (e.g., demographic characteristics and recent user activity).
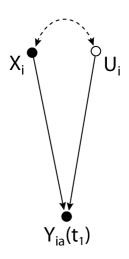
The causal model111 We present causal models in this section by drawing graphs consistent with the causal framework in \citeNpearl_causality:_2009. Our discussion of confounding of homophily and influence follows a more general treatment by \citeNshalizi2011. of this scenario (illustrated in Figure 1a) is relatively simple: a user has some set of known features , which affect the response222 is the response to a specific ad , including the ad creative. This allows, for the sake of simplicity, not including variables related to the ad creative or advertised entity. to the advertisement . Errors in predicting the response can be regarded as resulting from unobserved characteristics of the user.
2.1 Predictive aspects of social information
Many characteristics, attitudes, and behaviors are clustered in social networks [McPherson et al. (2001)]; that is, “birds of a feather flock together”. This clustering has multiple causes, including individuals preferring to associate with similar others (preference homophily), opportunities for forming and maintaining relationships that are biased towards similar others (structural homophily) [Kossinets and Watts (2009), Currarini et al. (2009), Currarini et al. (2010)], external causes whose effects are localized in the social network, and prior peer influence by which peers become more similar over time [Lewis et al. (2011)]. For simplicity, we subsequently use homophily to refer to all observed prior clustering of consumer features.
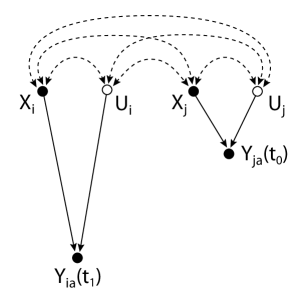
The presence of homophily in social networks suggests that characteristics of an individual can be predicted via characteristics of her peers.333 Note that even if observed characteristics are incomplete or noisy, peer characteristics can still be predictive. For example, \citeNbackstrom_find_2010 improve estimates of the location of individuals by using the location of their Facebook friends. Figure 1b illustrates how a peer’s response to an ad is predictive of a consumer’s response, even if information about one peer’s behavior is not observed by and cannot affect the consumer (i.e., in the absence of peer influence). Here and are observed characteristics of the consumer and her peer, and and are unobserved characteristics. Homophily implies that these variables will be correlated in some way. Therefore, a peer ’s behavior at a previous time is informative about the consumer ’s subsequent behavior . Furthermore, individuals who interact frequently exhibit greater correlation among characteristics compared to those who do not [McPherson et al. (2001)]. This suggests that those who have more opportunity to influence one another may also be expected to respond to an ad in the same way, even in the absence of social influence.
2.2 Peer influence and confounding
Peer behaviors can also influence consumer responses to ads. At least since early psychological experiments on conformity to group behavior [Sherif (1936), Asch (1956)] and observational studies of opinion leadership in mass communication [Katz and Lazarsfeld (1955)], these peer effects have been a central subject for the social and economic sciences.444 Economists sometimes refer to peer effects as “social interactions” [Durlauf and Ioannides (2010), Manski (2000), Moffitt (2001)].
In the presence of peer effects, an individual’s response to an ad will be associated with their peers’ responses not only because of homophily, but also because peer behavior causes individual behavior. In particular, if consumers can observe or infer the responses of their peers, then they are expected to use this information, even automatically and outside of conscious awareness [Tanner et al. (2008)], to determine their response. Ads that include such information about peer behaviors (i.e., as social cues) are expected to affect consumer responses via these social influence processes.
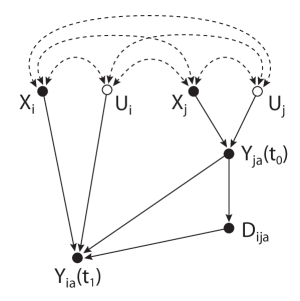
The presence of peer effects, including those via social cues in ad interfaces, is illustrated by Figure 1c. The peer’s response to the ad can affect the consumer’s response to the ad via multiple mechanisms. Of principal interest here is social influence via social cues, , although it is important to note that previous interactions between and , given by , may also cause influence effects in the absence of cues.
This picture highlights the difficulty in determining whether a change in responses to ads is due to the presence of social cues, other forms of social influence stemming from prior interaction, or the correlation in behaviors induced by homophily. For example, even if one were to control for all observed characteristics and , it is expected that there are unobserved characteristics and that make the responses of and dependent.
2.3 Identification via experiments
Randomized experiments are the gold standard for causal inference [Rubin (1974)], and the identification of peer effects is no exception. When they are possible, field experiments combine this internal validity with external validity [Shadish and Cook (2009)]. Conventional experimental methodology for online advertising randomly assigns users to a treatment group which sees an ad and a control or “holdout” group that does not see an ad; the experimenter then compares the outcome variable of interest (such as purchases) for these two groups [Lewis and Reiley (2008)].
In the context of measuring peer effects in social advertising, experimenters can randomly assign user–ad pairs to receive varying numbers of social cues. For example, when a user views an ad which can display a social cue, whether that social cue is actually displayed would be determined by random assignment. In the causal model of Figure 1c, this amounts to random assignment of the values of . Experimenters can then compare response rates of user–ad pairs assigned to different social cue conditions. The remainder of this paper focuses on experimental comparisons of this kind.
3 Related work
Online networks are focused on sharing information, and as such, have been studied extensively in the context of information diffusion. Large-scale observational studies explore a variety of diffusion-like phenomena in contexts including the apparent spread of links on blogs [Adar and Adamic (2005)] and Twitter [Bakshy et al. (2011)], the joining of groups [Backstrom et al. (2006)], product recommendations [Leskovec et al. (2006)], and the adoption of user-contributed content in virtual economies [Bakshy et al. (2009)]. Data from these studies are highly suggestive of social influence: the probability of adopting a behavior increases with the number of adopting peers. However, as noted by \citeNAnagnostopoulos08kdd and \citeNaral2009, such studies can easily overestimate the role of influence in online behavior because of homophily. \citeNshalizi2011 go further to illustrate that statistical methods cannot adequately control for confounding factors in observational studies without the use of very strong assumptions.
Some recent work has used field experiments to examine effects of social signals in online advertising and similar settings. \citeNtucker2012socialads estimates combined effects of social targeting and social cues in ads and highlights the value of distinguishing them. Two other recent experiments are similar to the present work in that they manipulate particular mechanisms of social influence. \citeNaral2011creating randomly assign individuals to versions of an application that included or lacked viral marketing features. Their “passive broadcast” feature has similarities to social advertising in that it is visible to peers and includes a social cue. However, their experiment manipulated whether an individual’s adoption of the application would notify their peers, rather than whether individuals’ with adopter peers were exposed to the broadcasted message. \citeNbakshy2012www randomize exposure to particular links shared by peers on Facebook and found that individuals were more likely to share the same links as their friends, even if they did not see the links on the site. This tendency was stronger for users who had multiple sharing friends, or a single friend who was a strong tie. Since this experiment either completely allowed exposure or prevented it for each individual–link pair, it did not identify the effect of influence via social cues.
4 Setting and Data Analysis Procedures
We conducted two large field experiments on Facebook during a short period in 2011. This section introduces the relevant aspects of Facebook and some general characteristics of the data common to both experiments.
4.1 Subject experience
A primary mode of interaction on Facebook occurs through News Feed, where users share with and consume content from their network of peers. Activity along these channels are called stories, and include short messages, links, photos, and other content. Ties between users are established by one user requesting to become friends on Facebook, and the other user accepting the request. In this paper, we treat a user’s friends as constituting their set of peers.
Users can also establish connections with other entities by liking particular pages, which correspond to businesses, organizations, products, movies, musical artists, celebrities, etc. The liking affiliation is generally visible to the user’s peers when they visit the user’s profile and in peers’ News Feeds. This latter case includes connection stories that indicate a user has liked a particular page. Additionally, content shared by a page appears in News Feed for users who like that page.
Several different types of ad units may be present in the right hand column of the site. Many ad units are associated with particular pages. These units can be targeted toward users with peers who like the page (i.e., social targeting) and display these peers alongside the ad unit (i.e., social cues). For a given user–ad pair, the affiliated peers are all peers who like the page and are eligible to be mentioned (e.g., the peers’ personal settings allow displaying this information to the user).
Experiments 1 and 2 use two different types of ad units (described in Section 5 and Section 6). In both cases, clicking on the ad unit takes the user to the advertised page. Clicking on a link labeled “like” — either in the ad unit itself or on the linked page — creates a new connection between the user and the page. We study effects of social cues on two responses: clicks on the linked content and liking the advertised page.
4.2 Assessing variation in response rates
The observed outcomes — responses to ad impressions — are not independent and identically distributed (IID). Users and ads vary in their response rates, and users only occur in combination with a limited number of ads; that is, the responses arise from a data-generating process with unbalanced crossed random effects of users and ads. Statistical methods that assume IID data neglect this dependence structure and are expected to be anti-conservative (i.e., produce confidence intervals that are too narrow). For example, if one observed 100,000 impressions for 10,000 users and 1,000 ads, methods that treat 100,000 as the relevant will generally substantially overstate confidence about response rates. To address this issue, all statistical inference in this paper employs a bootstrap strategy for data with this crossed structure [Brennan et al. (1987), Owen (2007)]. We now briefly describe our use of this strategy so that readers can appropriately interpret our results and apply the method to similar problems.
In the standard (IID) bootstrap, the analyst constructs bootstrap replicates by sampling observations, with replacement, from a full dataset of size . For each of these replicates, one computes the statistic of interest (e.g., a ratio of proportions). A simple method for computing a 95% confidence interval for that statistic is to use the 2.5 and 97.5 percentiles of the resulting statistics; this is the bootstrap percentile confidence interval.
This standard bootstrap procedure is not appropriate for dependent data, such as in our experiment, where users and ads are dependent. Instead, analysts should resample both users and ads independently [Owen (2007)]. We use a variation of this strategy that is suitable for online and distributed computation [Owen and Eckles (2012)]. Rather than resampling observations, the data is re-weighted according the the following procedure.555 Software implementing the multiway bootstrap in R is available at https://github.com/deaneckles/multiway_bootstrap. The results in this paper were produced by similar software for Apache Hive. For the th replicate, each user is assigned a draw, and each ad is assigned a draw. Each user–ad pair is then assigned the product of the corresponding draws as its weight. This strategy is known to be conservative when estimating the variance of means (i.e., it produces 95% confidence intervals that include the true mean more than 95% the time). Throughout, we report 95% bootstrap percentile confidence intervals using .
5 Experiment 1: Influence of multiple peers
Theory suggests that individuals are more likely to adopt actions previously taken by their peers when multiple social signals are present [Schelling (1973), Granovetter (1978), Centola and Macy (2007)]. These models are central to our understanding of information diffusion processes and form the basis for the formal analysis of viral marketing [Watts and Strogatz (1998), Kempe et al. (2003), Watts and Dodds (2007)]. However, as explained earlier, homophily and other factors obscure the true shape and magnitude of such dose–response functions in real-world data.
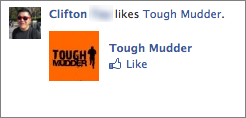


We use sponsored story ad units (Figure 2) to understand the marginal effect of social signals on consumer behavior, above and beyond what one might expect due to homophily and other sources of heterogeneity. Sponsored story ad units resemble organic stories that appear in the News Feed when a peer likes a page. Similar to conventional WOM approaches, the story does not include an advertiser-generated message, and must be associated with at least one peer. The main treatment unit is therefore the number of peers shown. Since the ad units are essentially sponsored versions of organic News Feed stories, they follow the same visual constraints imposed by the News Feed: they must feature at least one affiliated peer, and a small version of the first peer’s profile photo666 Users select their own profile photo for the thumbnail. This is used throughout the site accompanying the user’s stories and comments. is displayed in the leftmost part of the unit. The first peer’s name may be followed by the names of up to two other affiliated peers. A small thumbnail version of the page’s profile image is also displayed.
5.1 Sampling and assignment procedure
The first experiment applies to a simple random sample of all Facebook users. All sponsored stories displayed to users in this sample were subject to the following assignment procedure to determine the number of peers to be mentioned.
User–ad pairs (, ) are randomly assigned to a number of peers to be mentioned in the sponsored story. Since the maximum number of peers shown is limited by the number of affiliated peers (i.e., peers who have liked the advertised page and are eligible to be mentioned), user–ad pairs are assigned with equal probability to all of the possible values of . We limit our analysis to user–ad pairs with one, two, or three available peers (). Experimental assignment is a deterministic function of user–ad pairs, so all impressions for a user–ad pair have the same number and order of peers mentioned in the sponsored story. In total, Experiment 1 includes 23,350,087 users, 148,606 ad IDs, and 101,633,907 distinct user-ad pairs.
5.2 Average cue–response function
We first examine the average cue–response function, which shows how response rates vary as a function of the number of peers shown. This relationship, conditional on the number of affiliated peers, is shown in Figure 3. Panels with and illustrate the causal effect of showing multiple peers on click and like rates. For user–ad pairs with two affiliated peers, displaying a second peer caused a 10.3% ( [8.7%, 11.9%]) relative increase in click rate and a 10.5% ( [8.4%, 12.4%]) relative increase in like rate. When there were three affiliated peers, this increase was slightly weaker: the click rate increased by 8.0% ( [5.7%, 10.3%)] and like rate by 8.9% ( [6.0%, 12.1%]).
The cue–response function can also be used to examine whether influence appears to follow simple contagion, where each additional cue is expected to cause a constant or slightly sub–linear increase, or complex contagion (i.e. [Schelling (1973), Granovetter (1978), Centola and Macy (2007)]), whereby additional social signals result in a super–linear increase in the response. We find that there is no statistically significant difference between the probability increase from to , and to ( for clicks, for likes). This is consistent with simple contagion, although since we only measure average effects, it is difficult to entirely rule out complex contagion.
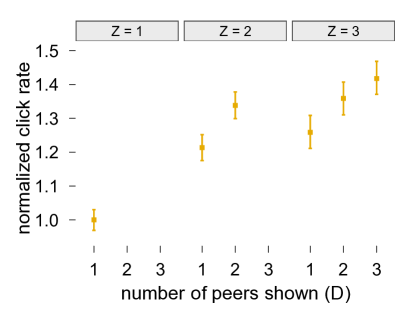
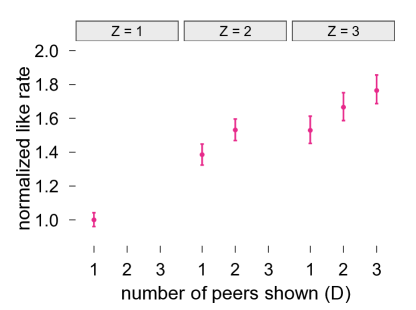
It is also apparent from Figure 3 that response rates increase with the number of affiliated peers, even when users only see a single cue. This trend illustrates how in many observational settings, the relationship between an individual’s behavior with the number of peers who also exhibit that behavior may not reflect increased levels of influence. While homophily is an obvious cause of the increase in response rates, the difference should not be attributed to homophily alone. For example, consider variation in the network-wide popularity of pages: sponsored stories associated with pages with more connected users will be observed more frequently with a larger number of affiliated peers. If these more popular pages have sponsored stories with higher response rates, then this will contribute to the between-panel differences in Figure 3. Likewise, users with more peers will be observed more frequently with a larger number of affiliated peers. These users might be expected to differ in their response rates. Finally, the selection of which stories to display to a user is endogenous: an individual’s characteristics are used to predict click-through rates, which cause the story to be displayed, but these characteristics may also be correlated with the number of affiliated peers. Thus, unlike comparisons given by the average cue–response function (within panel comparisons), variation between users with different numbers of affiliated peers cannot be given a straightforward interpretation.
Two limitations of this experiment concern the nature of the particular ad unit used. First, since this unit consists of reporting the connection of one or more peers with the entity, it was not possible to examine the effect of social cues relative to a baseline without any cues. Second, as the number of peers shown increases, so does the height of the ad unit and number of non-white pixels in the ad unit. While this change is very small relative to the overall size of the unit, this is a potential confound with the effects of increasing the number of peers referred to in the social cue. Both of these limitations motivate the design of Experiment 2, in which we examine how a more minimal social cue affects consumer responses.
6 Experiment 2: Influence of Minimal Social Cues
The next experiment examines the presence of minimal social cues with an ad. In particular, we measure the effect of adding light grey text with the name of a single peer associated with the entity being advertised. Thus, the first goal of this experiment is to identify the effect of having a cue alongside an ad. We test whether the social influence effects in Experiment 1 extend to the presence or absence of any social cues when these cues are visually commensurate with one another and subordinate to an advertiser-created message.
The second experiment also enables us to examine how the effect of social cues in advertising varies with the strength of the relationship between a consumer and affiliated peer. Previous work motivates the hypothesis that both homophily [Hill et al. (2006), Kossinets and Watts (2009)] and social influence [Hovland and Weiss (1951), Rogers and Bhowmik (1970), Goethals and Nelson (1973)] should cause peers with stronger relationships to have responses that are more correlated. We expect response rates to be higher for user–ad pairs where an affiliated peer is a strong tie rather than a weak tie. This effect should exist even in the absence of a social cue, but we also expect that the effect of a social cue will be larger for strong ties than weak ties.


Experiment 2 manipulates social cues alongside a social ad unit, which includes advertiser-specified “creative” consisting of a title, image, and caption (Figure 4). Beneath the custom creative is a link that says “Like” and gives information about people who like this page in small gray text. If a user has any affiliated peers, the name of one of those peers can be displayed. If a user has no affiliated peers, the total number of users who have liked the page is displayed.
6.1 Sampling and assignment procedure
The procedures for Experiment 2 are the same as Experiment 1. The experiment differs in that it involves random assignment to the presence or absence of a social cue (Figure 4), rather the number of peers referred to in an always-present cue. That is, user–ad pairs are randomly assigned to the presence of a social cue mentioning a single peer () or to the absence of a social cue (). In the latter case, the total number of users who like the page is displayed in the same location and typeface as the peer’s name.777 The stimuli can also be regarded as including a social cue, though not a personalized social cue about peers. Compared with non-informative text in this location, we might expect that ad efficacy will be higher with this general prevalence information. In this case, Experiment 2 underestimates the effects of having a minimal social cue. As before, the selection of the treatment and peer is deterministic, so users assigned to the condition will always see the same peer. In total, Experiment 2 includes 5,735,040 users, 1,155,178 ads IDs, and 137,505,771 user-ad pairs.
6.2 Average effect of a social cue
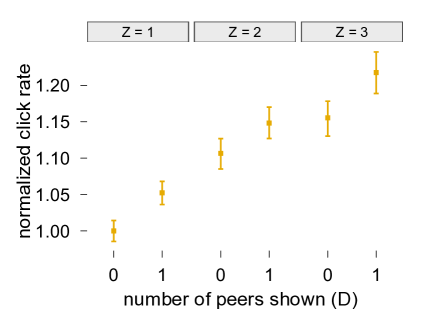
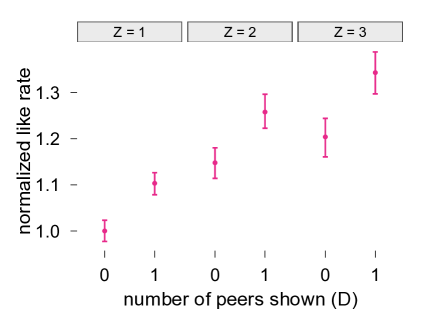
We begin by estimating average effects of the minimal social cue. Figure 6 displays response rates with and without the minimal social cue for different numbers of affiliated peers. Similar to the previous experiment, comparisons across different numbers of affiliated peers (i.e., between panels of Figure 6) show that response rates increase when more peers are available, regardless of how many were shown. As before, it is assumed that this increase results from homophily and heterogeneity in ad-user pairs that are associated with the number of affiliated peers available to a user for a given ad. (see Section 5.2 above).
Average peer effects resulting from the minimal social cue are identified by comparing responses with and without the social cue for each number of affiliated peers. We find that, depending on the number of affiliated peers, the cue increases click rates by 3.8% to 5.4% and like rates by 9.6% to 11.6% (Figure 6). For example, for users with a single affiliated peer, referring to that peer increases the click rate by 5.2% ( [4.0%, 6.5%]) and the like rate by 10.3% ( [8.4%, 12.3%]). This provides evidence that even a minimal social cue can substantially affect a consumer’s response to an ad.
6.3 Tie strength
To what extent do consumer responses to an ad depend on the nature of the relationship between the user and her affiliated peer? The preceding analysis treats relationships among consumers as binary, where a tie is either present or absent. We now examine the strength of a consumer’s relationship with her affiliated peers on a many-valued scale. To do this, we consider cases in which users have exactly one affiliated peer who was either shown or not shown (i.e., those user–ad pairs featured in the first panel of Figure 6).
6.3.1 Measure of tie strength
We use a measure of tie strength based on the frequency in which two users communicate with each other via Facebook. The total number of comments and messages created by a user during this 90 day period is their total communication count . We measure the strength of the directed tie between user and user as . We define tie strength as the fraction of user ’s communications that are directed at user or on posts by user . Similar measures are good predictors of standard measures of interpersonal trust [Burke et al. (2011)] and selection of peers as “top friends” [Kahanda and Neville (2009)]. Recent studies of information consumption [Backstrom et al. (2011)] and diffusion have also used this measure [Bakshy et al. (2012)].
Because the validity of our tie strength measure requires that the user communicates via Facebook during the 90 day period prior to the experiment, we restrict our analysis of tie strength to users who fall in the middle of the distribution of total communication count ; in particular, all users in this section fall within the 25th and 75th percentiles of the count distribution. In addition, we use a percentile-transformed total communication count as a covariate that measures how much user uses Facebook messages and comments to communicate.
6.3.2 Model
In order to pool information across similar values of tie strength and to facilitate statistical inference, we model responses to ads using logistic regression with natural splines. We fit a model in which ad clicks are predicted by the presence of a minimal social cue for user and ad , measured tie strength for user with the affiliated peer , and the user’s percentile-transformed total communication count . This model includes interactions of the minimal social cue with tie strength and with total communication count.
In particular, the model is specified as
| (1) |
where is a natural spline basis expansion for measured tie strength with knots at the second and third quartiles of measured tie strength over all impressions. We fit the same model to the data for the response of liking the page.888 Other related model specifications yield qualitatively similar results. Specifically, models also including a three-way product interaction of , , and resulted in very similar fits. Models with only a linear term for tie strength , rather than a natural spline, have a statistically significant interaction between tie strength and the cue, but suffered from model bias since the true relationship is non-linear on the logistic scale.
6.3.3 Results
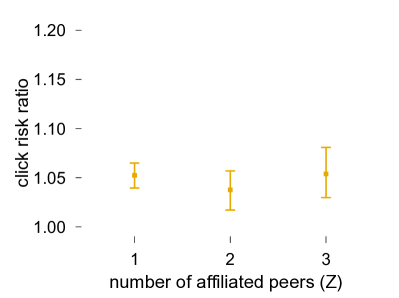
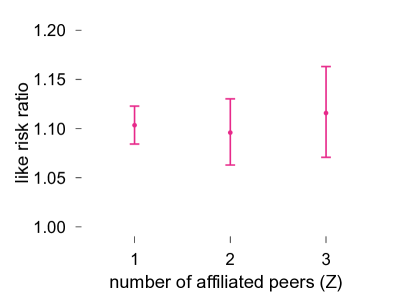
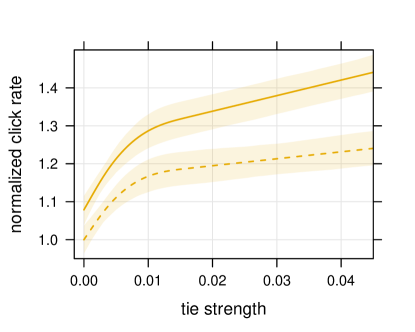
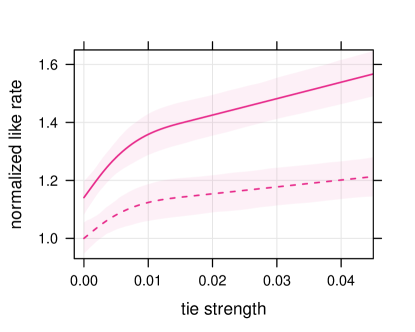
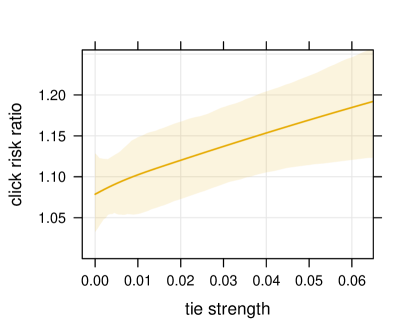
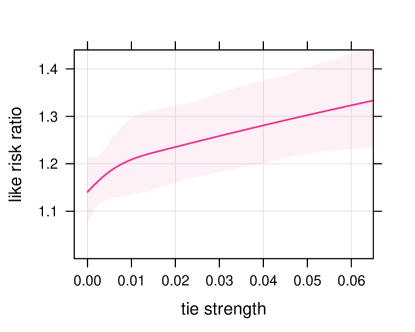
Response rates increase with tie strength both in the presence and absence of social cues. Figure 8 shows predicted response rates for user–ad pairs as a function of tie strength with (solid) and without (dashed) the minimal cue.999 For both responses, we fit the model separately to each of the bootstrap replicates. Confidence intervals are computed as the 2.5 and 97.5 percentiles of the bootstrap distribution of predicted response rates. Since response rates vary with total communication count, we plot the results for users at the median of the total communication count, . The increase of response rates in both conditions is consistent with the expectation that social influence, homophily, and other sources of heterogeneity should all produce increased correlation in responses among strong tie peers compared to weak tie peers.
If influence is greater for strong ties, then we should expect the increase in response rates that results from the display of social cues to be larger for strong ties than weak ties. We find that this is the case, both in terms of risk ratio and risk difference (i.e., average treatment effect on the treated). Figure 8 displays the click and like risk ratios for different values of measured tie strength. These risk ratios increase with tie strength. For example, consider ad–user pairs with and (the 90th percentile). The stronger tie ad–user pairs have a larger click risk ratio (risk ratio difference of 0.083, [0.014, 0.160]) and a larger like risk ratio (risk ratio difference of 0.151, [0.036, 0.280]). That is, the relative increase from the social cue is larger for stronger ties, even though the denominator of this ratio — the response probability without the social cue — is also larger for stronger ties.
7 Conclusion
We summarize the primary contributions of this work as follows. First, we rigorously measure social influence via social cues on an economically relevant form of user behavior. We construct the average cue-response function, which gives the relationship between the number of social signals received by the individual and average rates of response. The shape and slope of the cue–response function differ dramatically from the naïve observational estimates of social influence effects obtained through simple conditioning on the number of peers; this difference illustrates the utility of experimentation in estimating peer effects. Second, we demonstrate the substantial consequences of including minimal social cues in advertising. This highlights that the most subtle of forms of personalized social signals can play an important role in determining consumer responses to advertising, above and beyond correlations due to homophily. Third, we measure the positive relationship between a consumer’s response and the strength of their connection with an affiliated peer. This relationship exists even when social cues are absent from advertisements. Furthermore, cues have a stronger effect for stronger ties. These results suggest that social advertising systems can benefit from incorporating tie strength measures into the selection of ads and social cues. Finally, we hope that the explicit analysis of causal relationships in social advertising will aid researchers and decision-makers to understand recent developments in marketing.
The present work has important limitations that suggest directions for future research. First, tie strength as a theoretical construct has been given multiple definitions and is operationalized in many ways. We used transactional data about communication behavior as a measure of tie strength. Our choice of measure provides a readily interpretable and applicable measure, but limited some analyses to consumers with sufficient levels of communication activity, and future work could attempt to replicate our results for other measurements of tie strength, including trust and intimacy. Second, we could not randomize the tie strength of the peers who were affiliated with and referred to in the social cues. In particular, the population of ad–user pairs is different for strong and weak ties, so the analysis of Experiment 2 did not directly allow for causal inference about the effects of changes to tie strength of peers in social cues. Third, we have only examined two methods for presenting social cues with online advertising. The minimal social cue we examined in Experiment 2 is appealing in that it allows us to attribute its affects to social influence processes, rather than simply increasing the size or general visual characteristics of the ad. However, many other ways of presenting social information to consumers are possible. For example, a more prominent display of peers’ association or activity around an entity, combined with an advertiser-generated creative, may have a stronger response than any one of the two units on their own. In addition, future work may examine the effectiveness of such ad displays, as well the impact of social signals on other outcomes, such as ad recall and attitudes towards brands [Gibs and Bruich (2010)]. Finally, it is important to note that we only estimate average effects over the population of Facebook users that naturally see ads with social context. Individual responses to cues may vary substantially from user to user, and further work is needed to understand how factors such as age, gender, number of friends, or activity on site relate to the effect of social cues.
References
- Adar and Adamic (2005) Adar, E. and Adamic, Lada, A. 2005. Tracking information epidemics in blogspace. In 2005 IEEE/WIC/ACM International Conference on Web Intelligence. Compiegne University of Technology, France.
- Anagnostopoulos et al. (2008) Anagnostopoulos, A., Kumar, R., and Mahdian, M. 2008. Influence and correlation in social networks. In Proceedings of the 14th Internal Conference on Knowledge Discover & Data Mining. ACM Press, New York, NY, USA, 7–15.
- Aral et al. (2009) Aral, S., Muchnik, L., and Sundararajan, A. 2009. Distinguishing influence-based contagion from homophily-driven diffusion in dynamic networks. Proc. Natl. Acad. Sci. 106, 51, 21544–21549.
- Aral and Walker (2011) Aral, S. and Walker, D. 2011. Creating social contagion through viral product design: A randomized trial of peer influence in networks. Management Science 57, 9, 1623–1639.
- Asch (1956) Asch, S. E. 1956. Studies of independence and conformity: I. A minority of one against a unanimous majority. Psychological Monographs: General and Applied 70, 9, 1–70.
- Backstrom et al. (2011) Backstrom, L., Bakshy, E., Kleinberg, J., Lento, T., and Rosenn, I. 2011. Center of attention: How Facebook users allocate attention across friends. In Proc. 5th International Conference on Weblogs and Social Media.
- Backstrom et al. (2006) Backstrom, L., Huttenlocher, D., Kleinberg, J., and Lan, X. 2006. Group formation in large social networks: membership, growth, and evolution. In KDD ’06: Proceedings of the 12th ACM SIGKDD international conference on Knowledge discovery and data mining. ACM, New York, NY, USA, 44–54.
- Backstrom et al. (2010) Backstrom, L., Sun, E., and Marlow, C. 2010. Find me if you can: Improving geographical prediction with social and spatial proximity. In Proceedings of the 19th international conference on World Wide Web. ACM Press, 61–70.
- Bakshy et al. (2011) Bakshy, E., Hofman, J. M., Mason, W. A., and Watts, D. J. 2011. Everyone’s an influencer: Quantifying influence on twitter. In 3rd ACM Conference on Web Search and Data Mining. ACM Press, Hong Kong.
- Bakshy et al. (2009) Bakshy, E., Karrer, B., and Adamic, L. 2009. Social influence and the diffusion of user-created content. In Proceedings of the tenth ACM conference on Electronic commerce. ACM, 325–334.
- Bakshy et al. (2012) Bakshy, E., Rosenn, I., Marlow, C., and Adamic, L. 2012. The role of social networks in information diffusion. In Proceedings of the 21st ACM conference on the World Wide Web. ACM.
- boyd and Ellison (2007) boyd, d. m. and Ellison, N. B. 2007. Social network sites: Definition, history, and scholarship. Journal of Computer-Mediated Communication 13, 1, 210–230.
- Brennan et al. (1987) Brennan, R. L., Harris, D. J., and Hanson, B. A. 1987. The bootstrap and other procedures for examining the variability of estimated variance components. Tech. rep., ACT.
- Burke et al. (2011) Burke, M., Kraut, R., and Marlow, C. 2011. Social capital on Facebook: differentiating uses and users. In Proceedings of the ACM SIGCHI conference on Human factors in computing systems. CHI ’11. ACM, New York, NY, USA, 571–580.
- Centola and Macy (2007) Centola, D. and Macy, M. 2007. Complex contagions and the weakness of long ties. Am. J. Sociol. 113, 3, 702–734.
- Currarini et al. (2009) Currarini, S., Jackson, M. O., and Pin, P. 2009. An economic model of friendship: Homophily, minorities, and segregation. Econometrica 77, 4, 1003–1045.
- Currarini et al. (2010) Currarini, S., Jackson, M. O., and Pin, P. 2010. Identifying the roles of race-based choice and chance in high school friendship network formation. Proceedings of the National Academy of Sciences 107, 11, 4857 –4861.
- Durlauf and Ioannides (2010) Durlauf, S. N. and Ioannides, Y. M. 2010. Social interactions. Annual Review of Economics 2, 1, 451–478.
- Gibs and Bruich (2010) Gibs, J. and Bruich, S. 2010. Understanding the value of a social media impression. Tech. rep., Nielsen White Paper.
- Goel et al. (2012) Goel, S., Hofman, J. M., and Sirer, M. I. 2012. Who does what on the web: Studying web browsing behavior at scale. In Proc. 6th International Conference on Weblogs and Social Media.
- Goethals and Nelson (1973) Goethals, G. R. and Nelson, R. E. 1973. Similarity in the influence process: The belief-value distinction. Journal of Personality and Social Psychology 25, 1, 117–122.
- Granovetter (1978) Granovetter, M. S. 1978. Threshold models of collective behavior. Am. J. Sociol. 83, 6, 1420–1443.
- Hill et al. (2006) Hill, S., Provost, F., and Volinsky, C. 2006. Network-based marketing: Identifying likely adopters via consumer networks. Stat. Sci. 21, 2, 256–276.
- Hovland and Weiss (1951) Hovland, C. I. and Weiss, W. 1951. The influence of source credibility on communication effectiveness. Public Opinion Quarterly 15, 4, 635–650.
- Kahanda and Neville (2009) Kahanda, I. and Neville, J. 2009. Using transactional information to predict link strength in online social networks. In Proceedings of the Third International Conference on Weblogs and Social Media (ICWSM).
- Katz and Lazarsfeld (1955) Katz, E. and Lazarsfeld, P. F. 1955. Personal Influence: The Part Played by People in the Flow of Mass Communications. Free Press, Glencoe, Ill.,.
- Kempe et al. (2003) Kempe, D., Kleinberg, J., and Tardos, E. 2003. Maximizing the spread of influence through a social network. In KDD ’03: Proceedings of the ninth ACM SIGKDD international conference on Knowledge discovery and data mining. ACM, New York, NY, USA, 137–146.
- Kossinets and Watts (2009) Kossinets, G. and Watts, D. J. 2009. Origins of homophily in an evolving social network. American Journal of Sociology 115, 2, 405–450.
- Leskovec et al. (2006) Leskovec, J., Adamic, L. A., and Huberman, B. A. 2006. The dynamics of viral marketing. In EC ’06: Proceedings of the 7th ACM conference on Electronic commerce. ACM, New York, NY, USA, 228–237.
- Lewis et al. (2011) Lewis, K., Gonzalez, M., and Kaufman, J. 2011. Social selection and peer influence in an online social network. Proceedings of the National Academy of Sciences.
- Lewis and Reiley (2008) Lewis, R. A. and Reiley, D. H. 2008. Does Retail Advertising Work? Measuring the Effects of Advertising on Sales Via a Controlled Experiment on Yahoo! SSRN eLibrary.
- Manski (2000) Manski, C. F. 2000. Economic analysis of social interactions. The Journal of Economic Perspectives 14, 3, 115–136.
- McPherson et al. (2001) McPherson, M., Lovin, L. S., and Cook, J. M. 2001. Birds of a feather: Homophily in social networks. Annual Review Sociology 27, 1, 415–444.
- Moffitt (2001) Moffitt, R. A. 2001. Policy interventions, low-level equilibria, and social interactions. In Social Dynamics, S. N. Durlauf and H. P. Young, Eds. MIT Press, 45–82.
- Owen (2007) Owen, A. B. 2007. The pigeonhole bootstrap. Annals of Applied Statistics 1, 2, 386–411.
- Owen and Eckles (2012) Owen, A. B. and Eckles, D. 2012. Bootstrapping data arrays of arbitrary order. To appear in Annals of Applied Statistics. http://arxiv.org/abs/1106.2125.
- Pearl (2009) Pearl, J. 2009. Causality: Models, Reasoning and Inference. Cambridge University Press.
- Rogers and Bhowmik (1970) Rogers, E. M. and Bhowmik, D. K. 1970. Homophily–Heterophily: Relational concepts for communication research. Public Opinion Quarterly 34, 4, 523–538.
- Rubin (1974) Rubin, D. B. 1974. Estimating causal effects of treatments in randomized and nonrandomized studies. Journal of Educational Psychology 66, 5, 688–701.
- Schelling (1973) Schelling, T. C. 1973. Hockey helmets, concealed weapons, daylight saving: A study of binary choices with externalities. J. Conflict Resolution 17, 3, 381–428.
- Shadish and Cook (2009) Shadish, W. R. and Cook, T. D. 2009. The renaissance of field experimentation in evaluating interventions. Annual Review of Psychology 60, 1, 607–629.
- Shalizi and Thomas (2011) Shalizi, C. R. and Thomas, A. C. 2011. Homophily and contagion are generically confounded in observational social network studies. Sociological Methods and Research 27, 211–239.
- Sherif (1936) Sherif, M. 1936. The Psychology of Social Norms. Harper, New York.
- Sun et al. (2009) Sun, E. S., Rosenn, I., Marlow, C. A., and Lento, T. M. 2009. Gesundheit! Modeling contagion through Facebook News Feed. In Proceedings of the 3rd Int’l AAAI Conference on Weblogs and Social Media. AAAI, San Jose, CA.
- Tanner et al. (2008) Tanner, R. J., Ferraro, R., Chartrand, T. L., Bettman, J. R., and Van Baaren, R. 2008. Of chameleons and consumption: The impact of mimicry on choice and preferences. Journal of Consumer Research 34, 6, 754–766.
- Tucker (2012) Tucker, C. 2012. Social advertising. SSRN eLibrary. http://ssrn.com/paper=1975897.
- Watts and Dodds (2007) Watts, D. and Dodds, P. 2007. Influentials, networks, and public opinion formation. J. Consumer Research 34, 4, 441.
- Watts and Strogatz (1998) Watts, D. J. and Strogatz, S. H. 1998. Collective dynamics of ‘small-world’ networks. Nature 393, 6684, 440–442.