Galaxies behind the Galactic plane: First results and perspectives from the VVV Survey
Abstract
Vista Variables in The Via Láctea (VVV) is an ESO variability survey that is performing observations in near infrared bands (ZYJHKs) towards the Galactic bulge and part of the disk with the completeness limits at least 3 mag deeper than 2MASS. In the present work, we searched in the VVV survey data for background galaxies near the Galactic plane using ZYJHKs photometry that covers 1.636 square degrees. We identified 204 new galaxy candidates by analyzing colors, sizes, and visual inspection of multi-band (ZYJHKs) images. The galaxy candidates colors were also compared with the predicted ones by star counts models considering a more realistic extinction model at the same completeness limits observed by VVV. A comparison of the galaxy candidates with the expected one by Milennium simulations is also presented. Our results increase the number density of known galaxies behind the Milky Way by more than one order of magnitude. A catalog with galaxy properties including ellipticity, Petrosian radii and ZYJHKs magnitudes is provided, as well as comparisons of the results with other surveys of galaxies towards Galactic plane.
1 Introduction
Large surveys of Galactic structure offer an unique opportunity to study extra-galactic sources such as background galaxies and quasars. However, studies of such sources and their structures in the Galactic plane are limited due to the high density of foreground sources. Moreover, one of the most severe obstacle at low Galactic latitude is the interstellar extinction that can reach values of up 35 magnitudes in AV (e.g. Neckel & Klare, 1980, Amôres & Lépine 2005, hereafter AL05) that clearly making surveys at optical wavelengths unfeasible for this type of study.
Pioneering works studying the complex structures behind the Milky Way (MW) Galactic plane had been started by KraanKorteweg et al. (1995), Fairall et al. (1998), Woudt et al. (1998) and Tonry et al. (2001). They were motivated by the Great Attractor (GA) model suggested by LyndenBell et al. (1988), a mass concentration in the direction of HydraCentaurus supercluster on l=307∘ and b=9∘. This concentration would be responsible for the observed peculiar motions of elliptical galaxies in the nearby Universe (Dressler et al. 1991).
Even though some of the early predictions from such reconstructions indicated the presence of a GA behind the MW, data from the X-ray cluster survey in the Zone of Avoidance (ZoA, Ebeling et al. 2000), showed that such a mass would be about one order of magnitude smaller (Kocevski & Ebeling, 2005, Kocevski et al., 2007, see also Radburn-Smith et al., 2006).
In addition, the group led by Woudt & Kraan-Korteweg have performed a deep optical galaxy search behind the southern MW towards Hydra/Antlia (Kraan-Korteweg 2000) and the GA region (Woudt & Kraan-Korteweg 2001). These two works presented over 11,000 previously unrecorded galaxies with average observed major axis diameters equal to 0.2 arcmin. Later, they also identified 342 IRAS sources. Woudt et al. (2004) using Meudon-ESO Fibre Object Spectrograph (MEFOS) presented redshifts for 764 sources towards the ZoA. Much progress has been made in the last years in the study of galaxies behind the Galactic plane with radio surveys as well as those in the near-mid and far-infrared and X-rays, among others.
The Two Micron All Sky Survey (2MASS, Skrutskie et al. 1997) covers the whole sky in J, H and K passbands. Jarrett et al. (2000a) presented a basic algorithm to detect, characterize and extract extended (e.g., extragalactic) sources using 2MASS data. Jarrett et al. (2000b) performed an internal completeness and reliability analysis for a sample of 2MASS data, consisting of 7,000 sources in a region of 1,000 square degrees of area, including galaxies and Galactic nebulae from the W51 giant molecular cloud complex. We note that several of these newly discovered galaxies found in photometric surveys are the closest known galaxies outside the MW (eg., Tollerud et al. 2008).
Hurt et al. (2000) using 2MASS data presented a late-type spiral galaxy (Sc-Sd) located at Mpc, () , with an angular extent of 6.3′ in the near infrared. Skrutskie et al. (2006) published ’The 2MASS Extended Source Catalog’ that contains 1,647,599 sources that are extended with respect to the instantaneous PSF, such as galaxies and Galactic nebulae.
As pointed out by Jarrett et al. (2000b) near-infrared surveys have the advantage of being sensitive to most types of galaxies, including gas-poor spheroidals. In this sense, Nagayama et al. (2004) presented a deep NIR survey covering a region of 36 arcmin2 centered on the radio galaxy PKS 1343-601, providing 57 galaxy candidates. Based on DENIS data, Paturel et al. (2005) published a catalogue containing IJK photometry for 753,153 sources, including galaxies and galaxies to be confirmed. Schröeder et al. (2007) investigated a 30 square-degree area around the radio-bright galaxy PKS 1343-601 () using the DENIS survey. They found 83 galaxies and 39 galaxy candidates.
Due to the Galaxy transparency at longer wavelengths it is very useful to observe galaxies using HI (21 cm line). Kraan-Korteweg et al. (2002) identified 66 galaxies using the Parkes 64 m radio telescope. Ryan-Weber et al. (2002) and Koribalski et al. (2004) identified approximately 1,000 objects using HI Parkes All-Sky Survey (HIPASS). And, in a further work, Schröeder et al. (2009), using 64 m Parkes radio telescope, made observations in HI for 314 candidates, detecting 162 of them. Radburn-Smith et al. (2006) using the 2dF on the AAT measured 3053 redshifts in the GA/SSC region and Van Driel et al. (2009) performed HI observations towards 132 sources identifying 16 2MASS galaxies in their sample.
Recently, Jarrett et al. (2007) using the Spitzer Legacy program GLIMPSE identified two galaxies towards a high extinction zone () ) with A mag. They complemented their observations with HI data from ATCA survey. Marleau et al. (2009) using GLIMPSE and MIPSGAL mid-infrared surveys found twenty-five galaxy candidates towards 47 and 55o.
As pointed out by Woudt et al. (2004), deep optical searches, near infrared all-sky surveys (2MASS and DENIS), HI all-sky surveys and X-ray surveys, have also all resulted in the detection of voids, clusters and superclusters at low Galactic latitude (for a review, see Kraan-Korteweg & Lahav 2000 and references therein).
The goal of this work is to identify galaxies behind the Galactic plane in the Vista Variables in the Via Láctea, hereafter VVV111http://www.vvvsurvey.org (Minniti, D., et al. 2010 and Saito, et al. 2012), a deep near IR survey of the MW bulge and part of the disk. Due to the specific area of interest, two main difficulties are: i-) highly crowded fields, ii-) the effect of interstellar extinction.
The interstellar dust absorption (and reddening), does affect the observed color distribution of galaxies, and hence causes some galaxies to drop out in the surveys (a selection bias). Minimizing such biases is necessary for an accurate estimation of galaxy number statistics and also for the accurate determination and distribution of Galactic extinction.
This is the first of a series of papers that unveil galaxies in the Galactic plane using deep VVV near infrared photometry. The results presented here were obtained by visual inspection of the false-color and multi-band images, color-color and color histogram, size distribution analysis for the objects in a region towards 298.3558, -1.6497 (called the VVV d003 region). Following this procedure, we have found around 200 galaxy candidates. We present results for only one tile to establish methods that can be used in future works. Furthermore, this single tile will allow us to identify galaxies that have no counterpart in previous surveys.
This paper is organized as follows. Section 2 presents the main characteristics of the VVV data. Section 3 presents an overview of the properties of the d003 region, such as interstellar extinction and stellar distribution. Our method to identify galaxies is presented in Section 4 along with comparison to data observed by other catalogs towards a region with 25 square degrees centered at d003. A discussion and comparison of the photometry for both stellar and sources that we identified as galaxies as well as a comparison with mock catalogues of galaxies are given in Section 5. Finally, Section 6 presents the conclusions and the final remarks.
2 VVV data
VVV is an ESO public variability survey with the 4-m Vista telescope at Cerro Paranal. It consists of observations in the near infrared bands (Z, Y, J, H, and Ks) towards the Galactic bulge and part of the disk, covering in total an area of 562 square degrees. The VVV is in its third year; we already have full disk and bulge coverage in J, H and Ks and near completion in Y and Z (see Saito et al. 2012 for a detailed description of the survey status). The completeness limit of the observations in the 5 infrared bands is 21.6 mag in Z, 20.9 in Y, 20.6 in J, 19.0 in H and 20.0 mag in Ks.
As pointed by Saito et al. (2012), VIRCAM is equipped with 16 Raytheon VIRGO pixels2 HgCdTe science detectors, with average pixel scale. Each individual detector therefore covers arcsec2 on the sky. The achieved image quality (including seeing) is better than on axis. The image quality distortions are up to about 10% across the wide field of view.
The data were reduced using the Cambridge Astronomy Survey Unit (hereafter CASU) pipeline222http://casu.ast.cam.ac.uk/. The provided data comprises 62 attributes, including positions and magnitudes for each detected source. The positions are converted into J2000 equatorial coordinates (RA,DEC) and the sources in different filters are matched (with radius search equal to 1 arcsec) in a final catalogue. Fluxes are transformed into magnitudes calibrated taking into account the zero points and atmospheric extinction.
Typical values for the astrometric accuracy are mas for a mag source and mas for mag (Saito et al. 2012).
For this study we have selected from VVV database, the equatorial coordinates, aperture magnitudes (within an aperture of 1.0 times the core radius) and errors in all filters, a classification flag, a parameter called ‘statistic‘, which is a measure of the stellarity of an object and the Petrosian radii (Yasuda, et al. 2001) in all filters. The classification flag gives an indication of the most probable classification of a source: -2 if it is compact (probably stellar), -1 if it is stellar, 0 if it is classified as a noise peak, and 1 if it is extended, non-stellar. Details about the data reduction algorithms are presented in Irwin et al. (1994).
3 VVV d003 tile
The d003 tile analyzed in this work was observed in the ZYJHKs bands and is centered at (J2000) RA=12:09:17.18 and DEC=-64:08:46.7. The tile was selected by its relatively low and uniform extinction with complete observations using the 5 filters (ZYJHKs) and multi-epoch Ks band observations.
This field covers 1.636 square degrees ( 1.475 degrees and 1.109 degrees). It contains a huge number of detected objects, including extended, stellar and compact sources: 1,095,483; 1,018,374; 1,233,111; 1,302,302; and 1,160,528 in the ZYJHKs filters, respectively. Figure 1 shows a combined JHKs false-color image of part of this region, depicting some background galaxies. One of the main goals of this work is to characterize these objects.
From the point of view of Galactic structure, the line of sight towards this tile is not far from the tangential direction to Carina spiral arm at to (e.g., Bronfman 1992, Russeil 2003 and references therein).
3.1 The stellar and interstellar extinction distributions
Star counts are very useful to model observed data allowing several studies. These include the distribution of the Galactic objects in color space, the relation between colors and distance that can be used to infer extinction and to correct observed colors for interstellar extinction effects. This is useful in order to obtain an accurate estimate of the number of Galactic sources for a given region and to correlate it with the observed extra-galactic sources.
Star counts in the Galactic plane have been modeled by Amôres & Robin (2012, in preparation) with the Besançon Galaxy Model (BGM, Robin et al. 2003) by fitting Galactic parameters such as spiral arms, disc scale-length, the presence of the disk warp and flare, to stellar counts obtained by the 2MASS survey in the Galactic plane, covering an area equal to 300 square degrees and allowing to derive new parameters and description for the spiral arms, warp and flare distribution in the MW.
In the present work, we have used the version of the BGM with the Marshall et al. (2006) extinction model to simulate star counts towards d003. Our simulation strategy consisted in separating the tile into small regions of around by square degrees. This tiling is adequate due to the irregular distribution of the extinction and stellar content. Before simulating star counts, we computed the completeness limits for each filter J, H and Ks as well as their photometric error, modelled by using an exponential law (Bertin & Arnouts, 1996). The results obtained from star counts simulations will be presented in Section 4. Because BGM does not include the Z and Y filters, we used for them the TRI-LEGAL (Girardi et al. 2005) model.
We have also analyzed the distribution of interstellar extinction in the field of the d003 tile based on the maps333Just for the record, note that the resolution of Froebrich et al. (2005) and Dobashi et al. (2005) maps are 2 and 4 arcmin, respectively. For both maps we have used the four neighbourhood extinction values to calculate the extinction provided directly in AV units. provided by Froebrich et al. (2005), Dobashi et al. (2005) and the AL05 models. The median values for AV within the tile using them are 2.27 0.23, 2.66 0.71, 3.00 0.79, respectively.
For a more detailed discussion about the interstellar extinction towards d003 tile, see Table 4 of Saito et al. (2012). Also, previous works searching for galaxies in the Galactic plane found AV ranging from 3.0 mag to 15.0 mag, as discussed by Kraan-Korteweg et al. (2000), Woudt & Kraan-Korteweg (2001), Nagayama et al. (2004), and Jarrett (2007). Our values for the tile d003 ( 3 mags) are at lower end of this range. For a short and recent review on interstellar extinction, see Robin (2009) and references therein.
4 VVV d003 tile: Visually Identifying Galaxies
The main goal of this paper is to carry out the first detection, in the literature, of new galaxies in the VVV survey. We started with the d003 tile as a first step to establish the basic procedure to search for these objects. This section presents a brief description of the data obtained by other surveys. The expected number of galaxies predicted by Millennium simulation is presented in Section 5.1.
4.1 Previous Works
It is worth verifying whether there are galaxies in the d003 region already identified by other surveys. We first concentrated on the catalog published by Skrutskie et al. (2006) based on 2MASS data that found no galaxies in the d003 tile area. Indeed, only 342 sources were classified as galaxies by 2MASS in the complete VVV region, corresponding to only 0.65 galaxiessquare degrees.
Table 1 shows the sources observed by 2MASS with visual verification of source (vc) equal to -2, -1, 1 and 2, which corresponds to unknown, no verification, galaxy, nonextended (e.g., star, double, triple, artifact), respectively for three different regions, i.e, VVV bulge and disk and an area equal to 40o square degrees centered in d003 tile center. Although there are 65 objects (Table 1) identified as galaxy by 2MASS in this area, no object classified as galaxy in d003 tile is found. Even if we relax the vc flag constraint to get all non-stellar sources in our analysis, we note that no extended 2MASS sources were detected in the d003 tile.
We have also checked that no galaxies were found towards the d003 tile in another studies of galaxies behind the Galactic plane provided by Paturel et al. (2005), Koribalski et al. (2004), Woudt et al. (2001). Figure 2 shows DIRBE/COBE (Freudenreich 1998) emission map at 2.2 m. As can be seen by comparing the number of galaxies, we may expect that an analysis of all regions observed by the VVV survey will largely increase the number of galaxies detected behind the Galactic plane. We therefore conclude that, up to our knowledge, no galaxies in the d003 tile were previously identified in that region.
4.2 Analysis of the VVV d003 tile
The Galactic plane is very rich in sources with many different objects. They can be classified as point sources, mostly Galactic stars, and extended images, including blended stars, background galaxies, star formation regions, planetary nebulae, supernova remnants, molecular clouds, etc. Because of this great variety of objects, a logical and cautious first approach is also to confirm the identification of sources obtained by VVV pipeline (galaxies for the purposes of this investigation) by visual inspection. Based on this information, we can later launch a full automatic exploration of galaxies within the entire 562 square degrees area covered by the VVV Survey.
As discussed earlier, the identification of galaxies near the Galactic plane suffers from two major difficulties: high Galactic extinction and dense stellar fields. Also, extended features in the interstellar medium are an additional source of confusion.
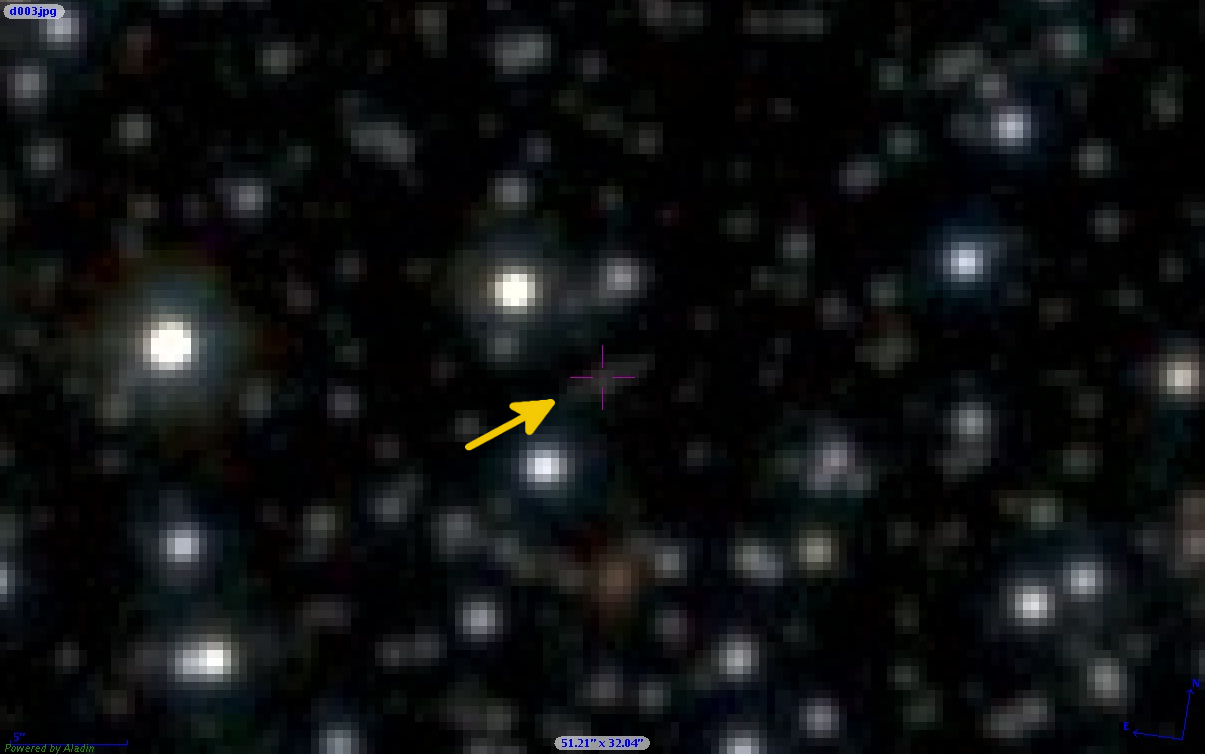
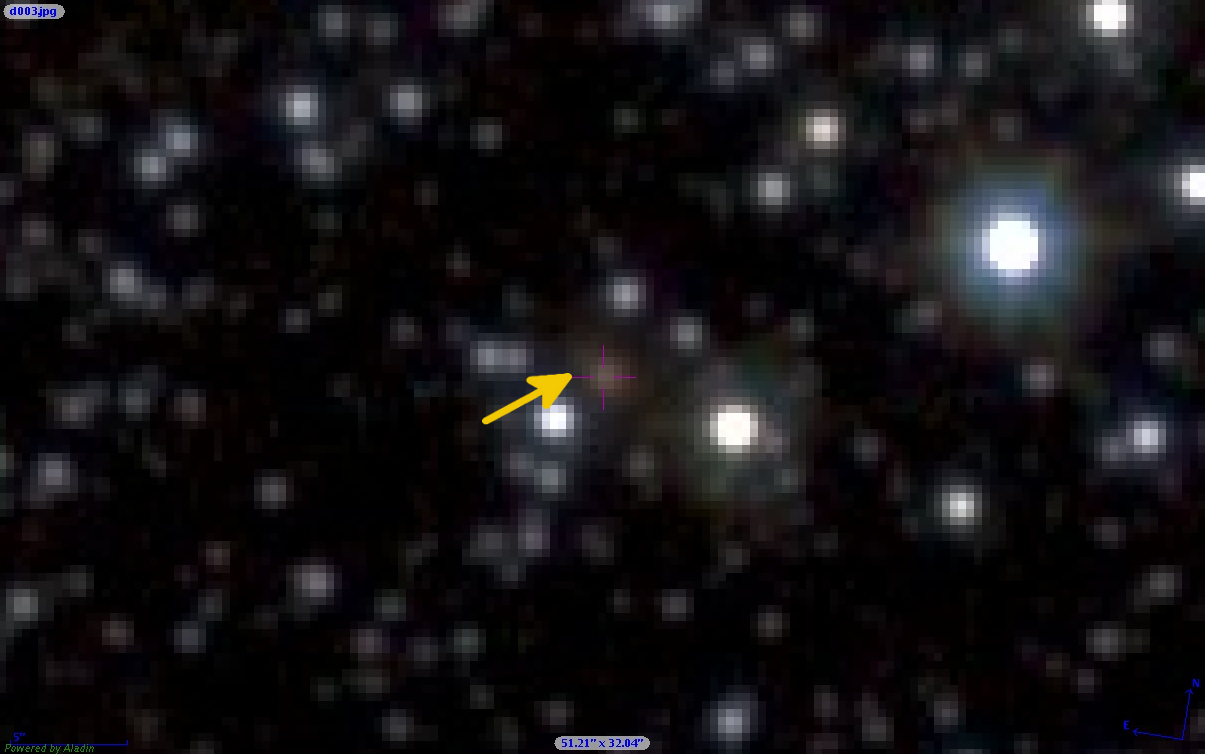
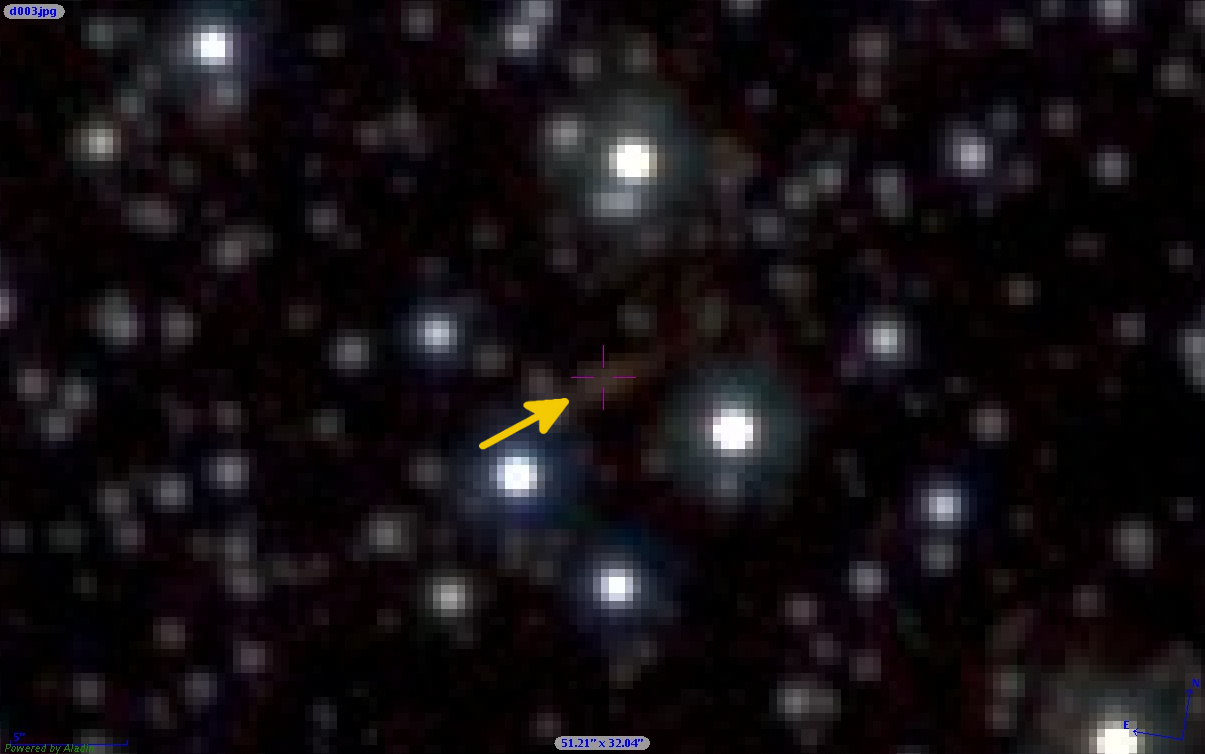
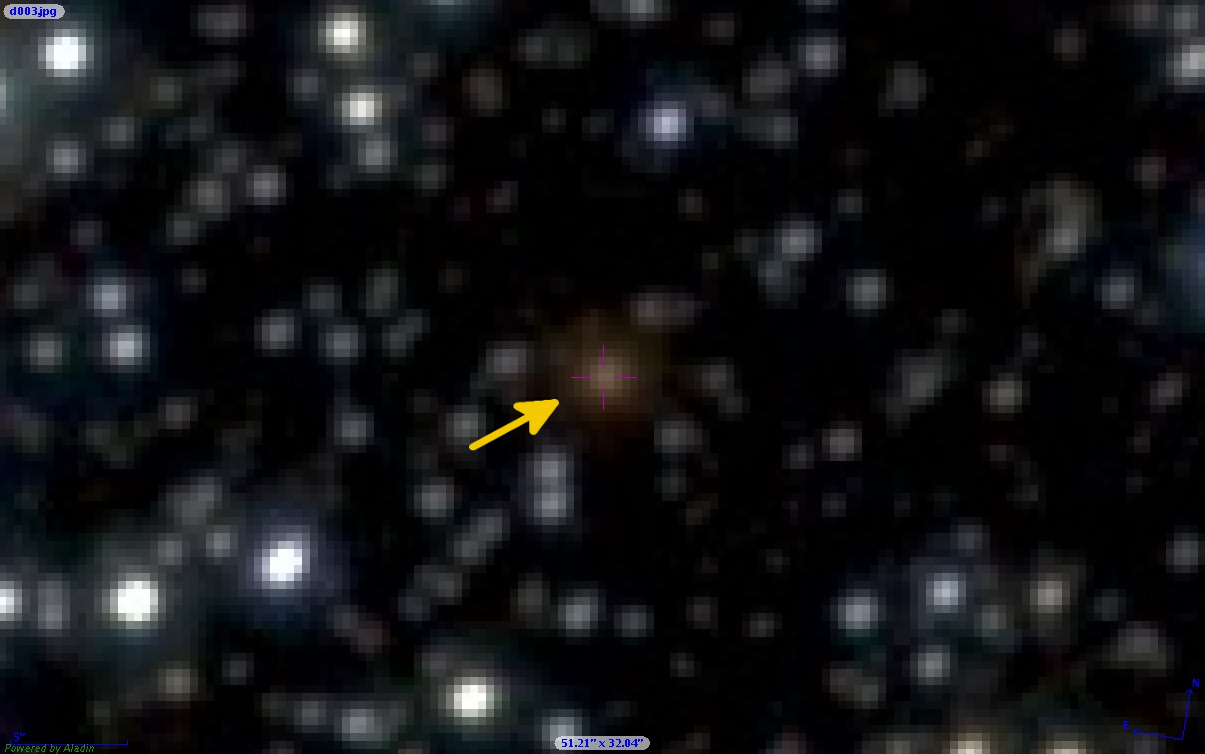
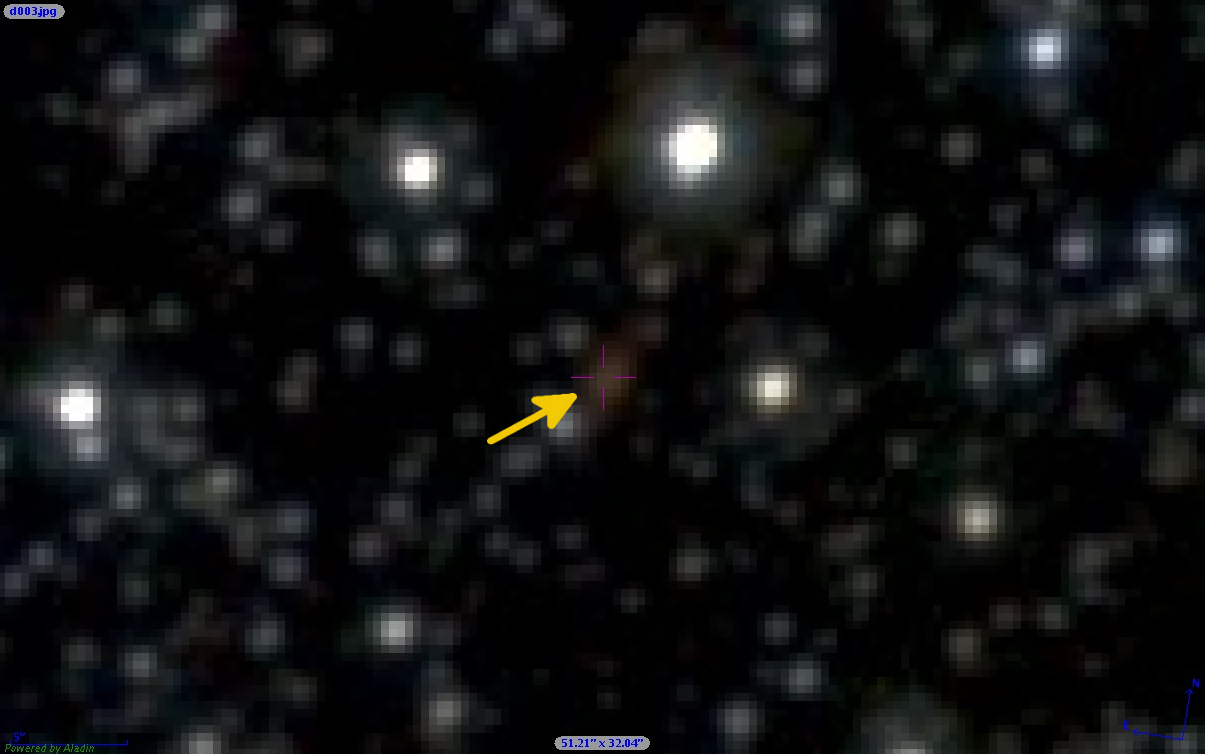
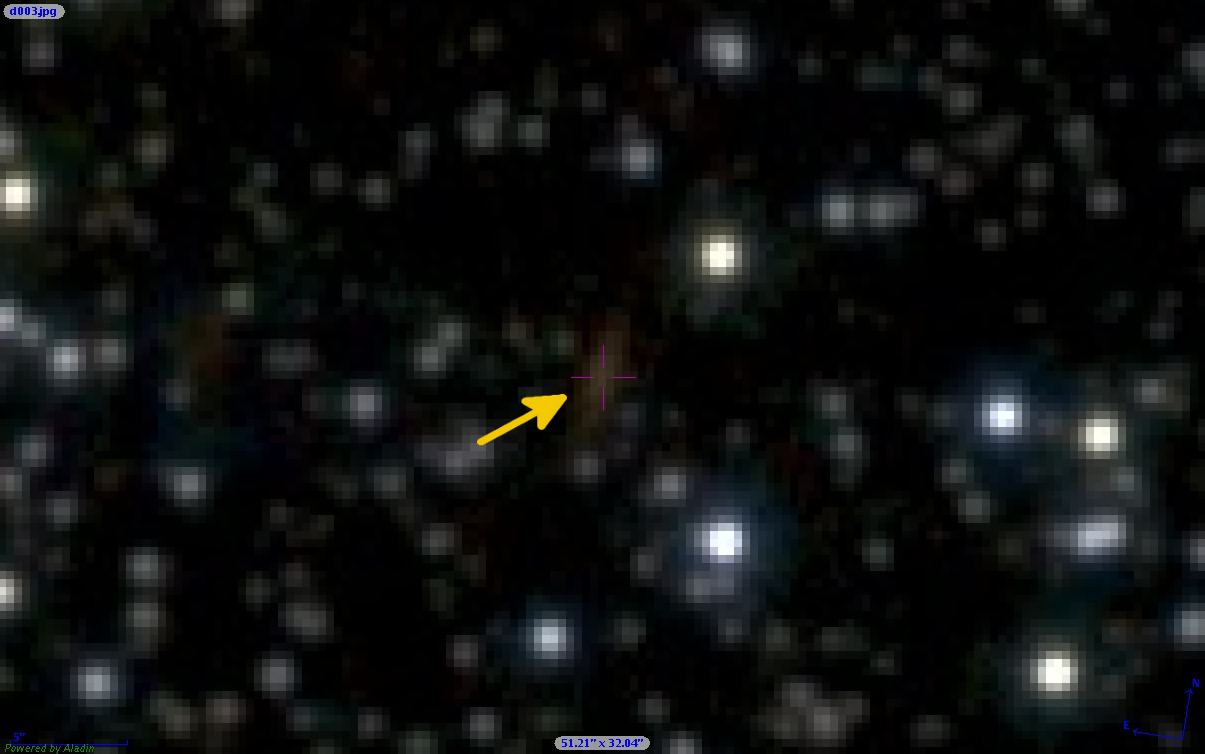
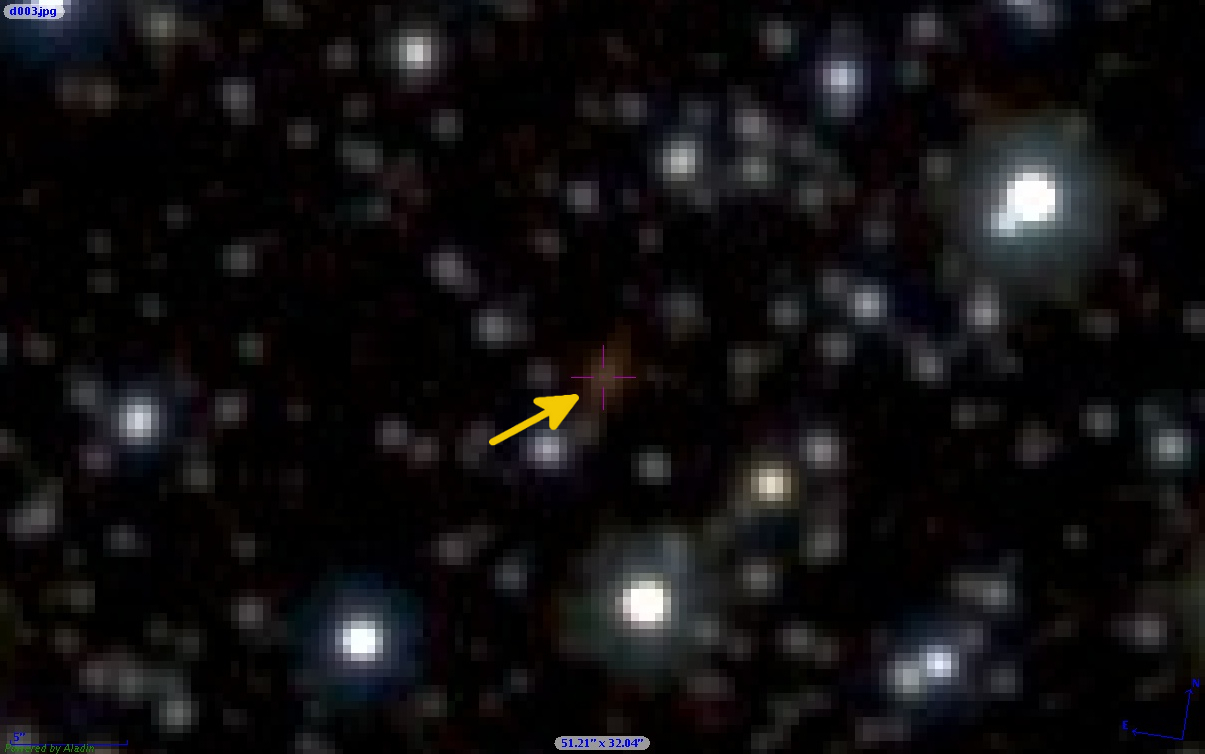
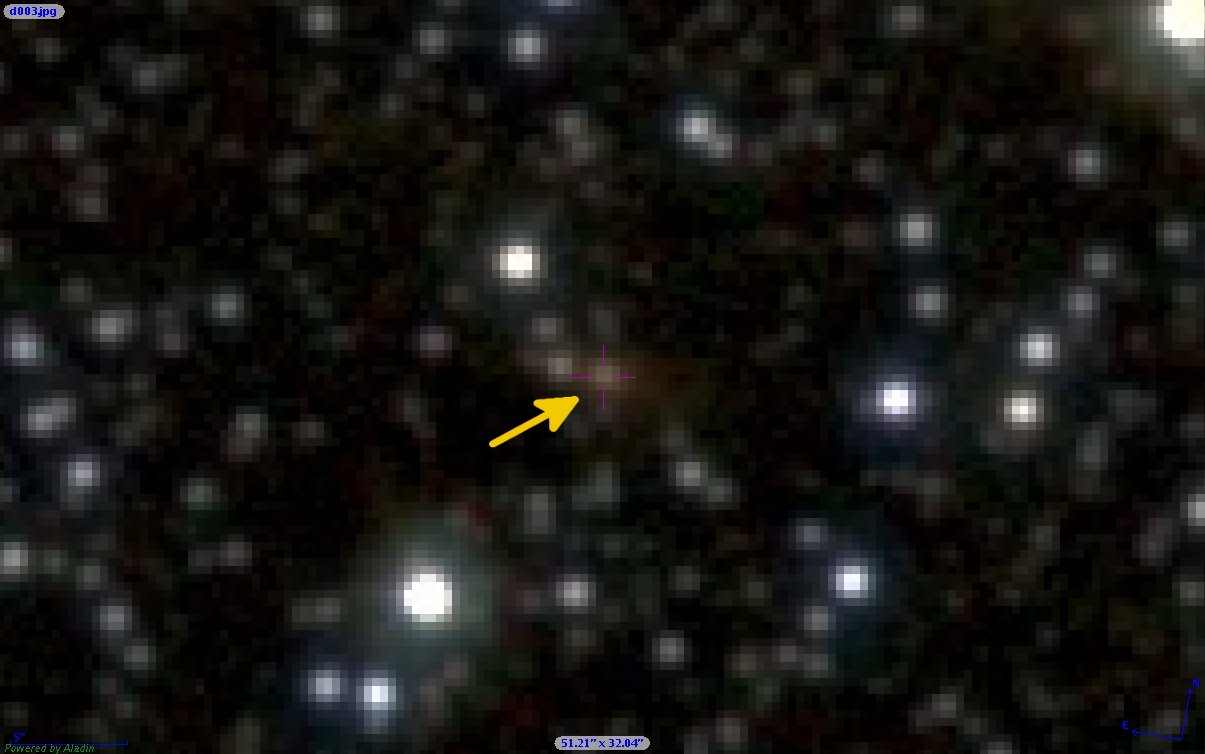
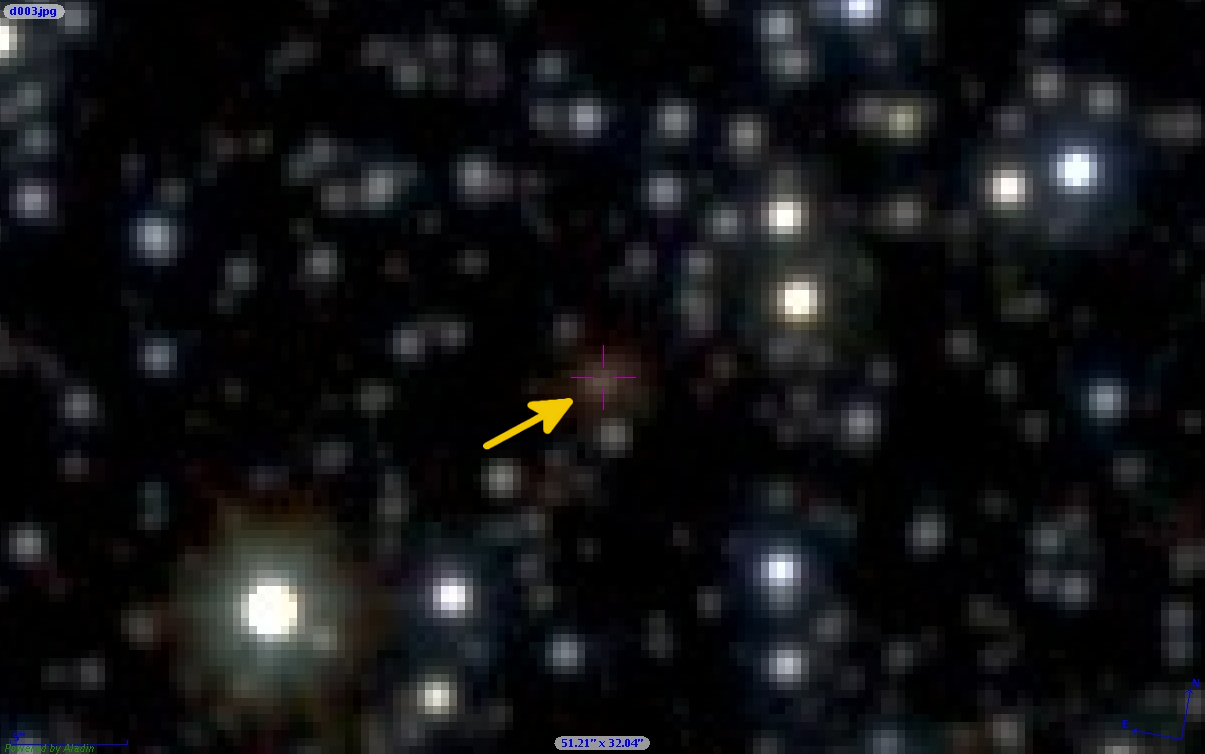
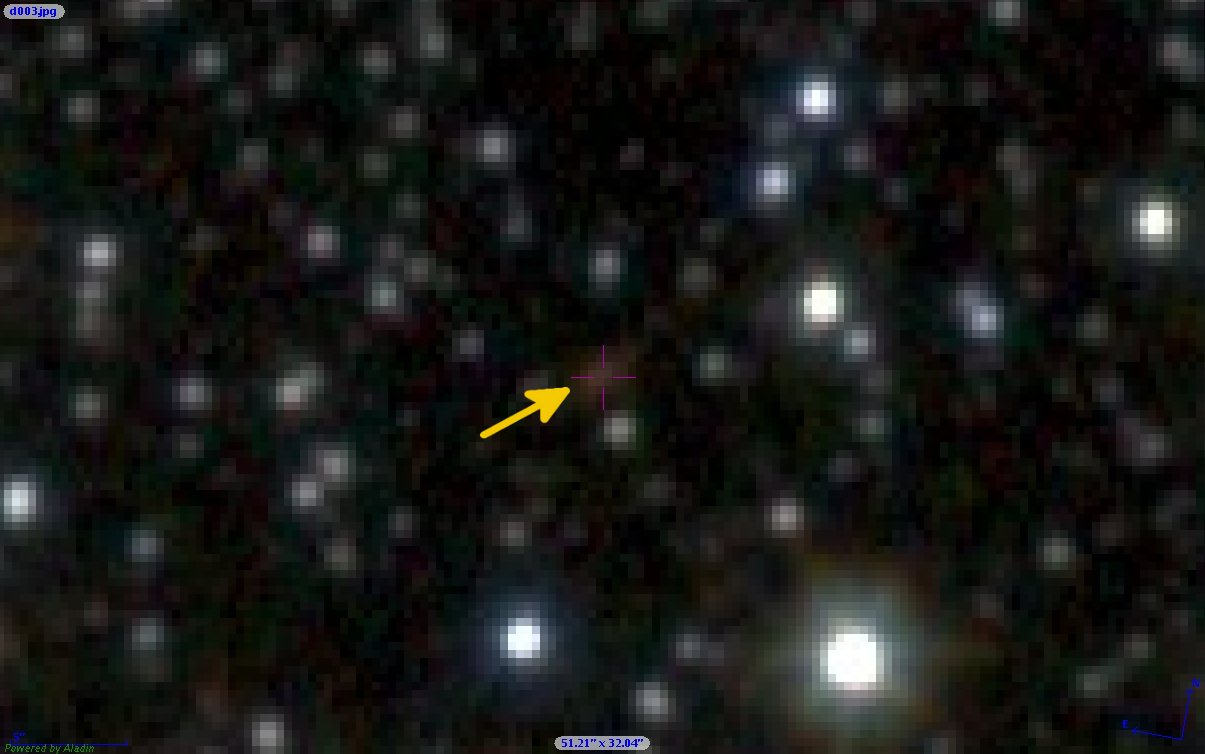
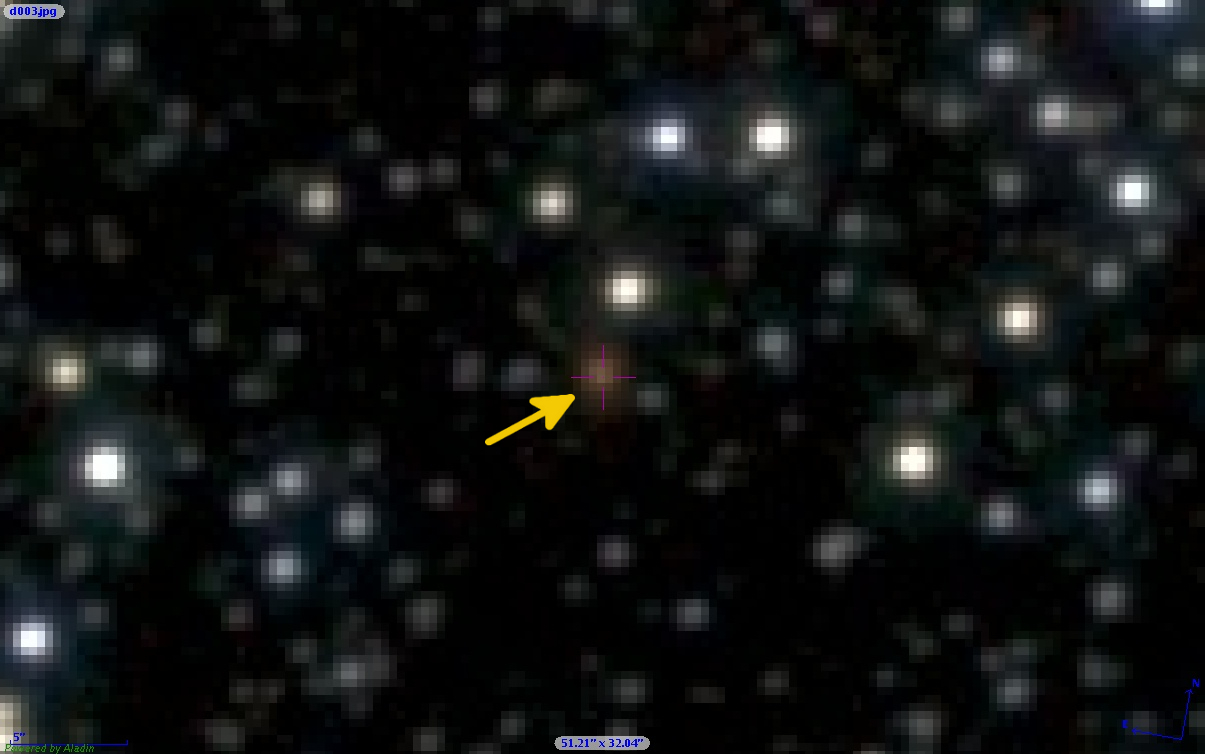
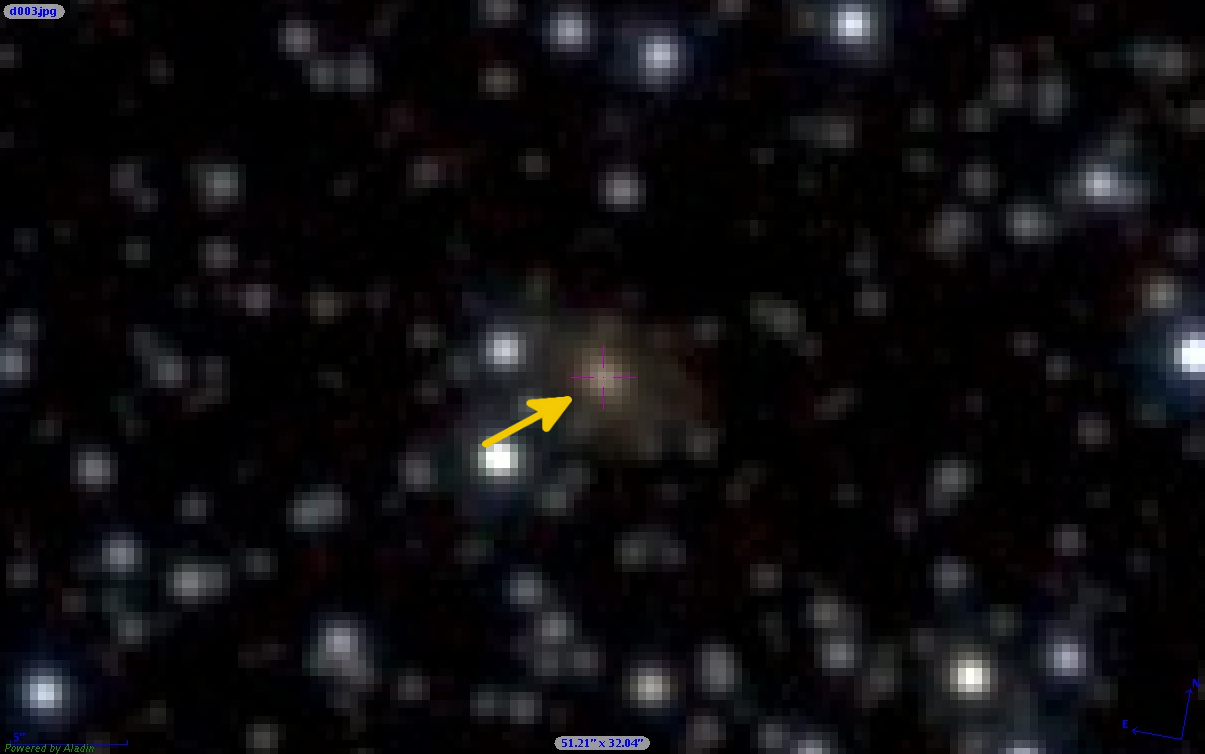
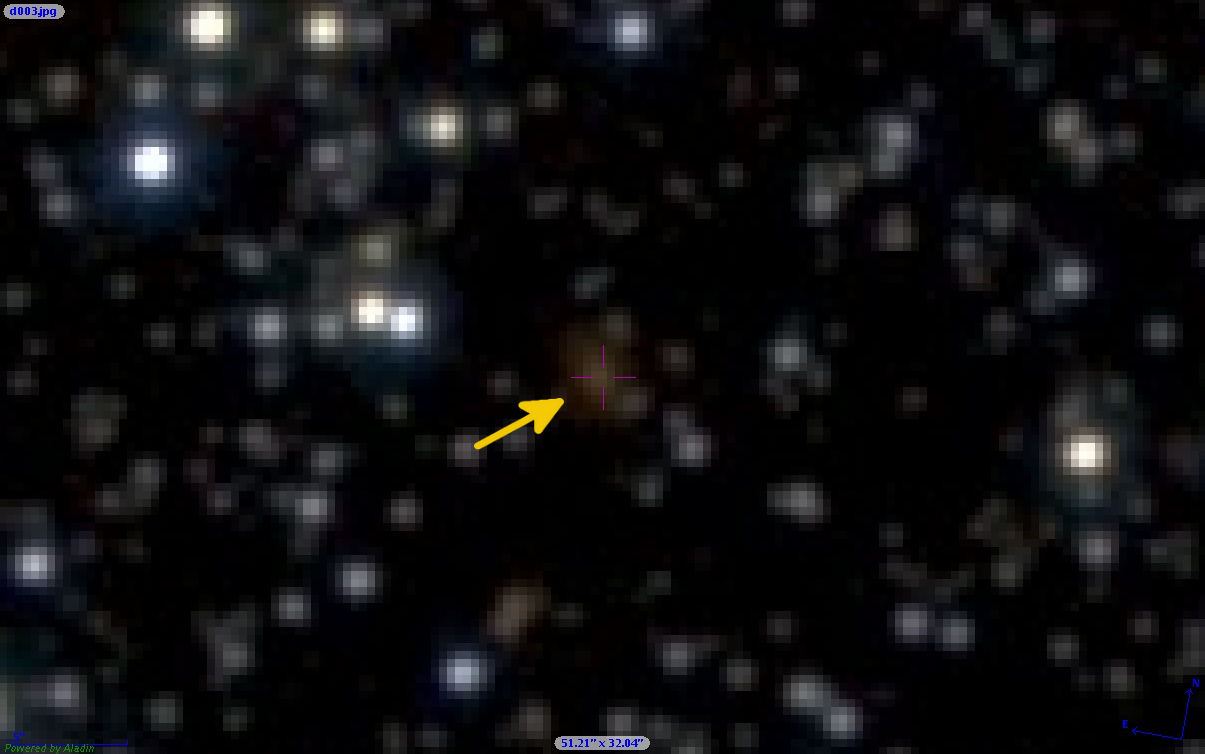
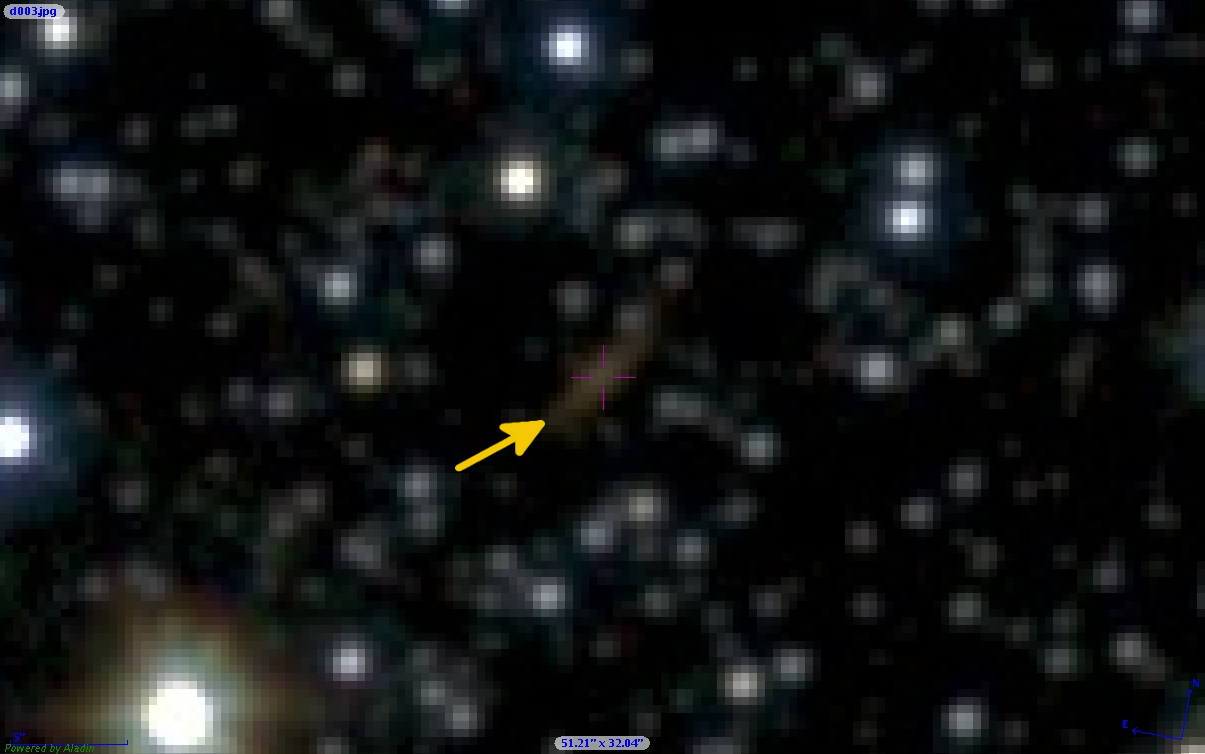
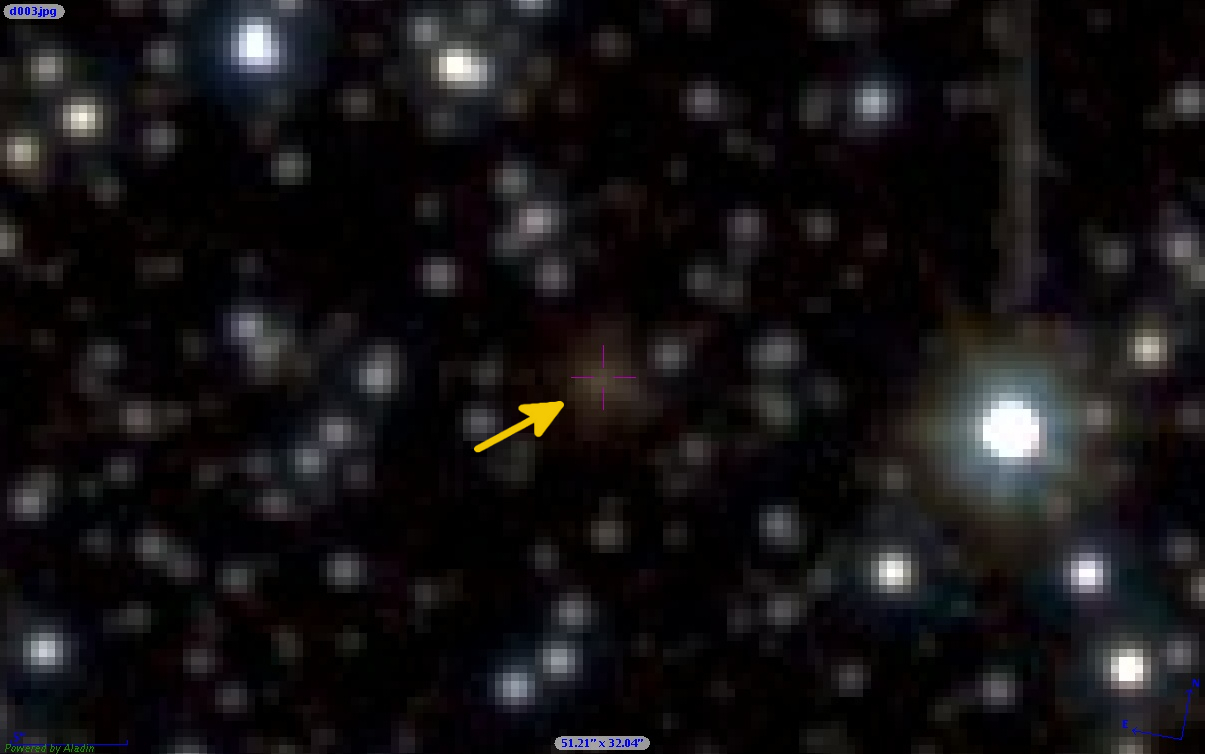
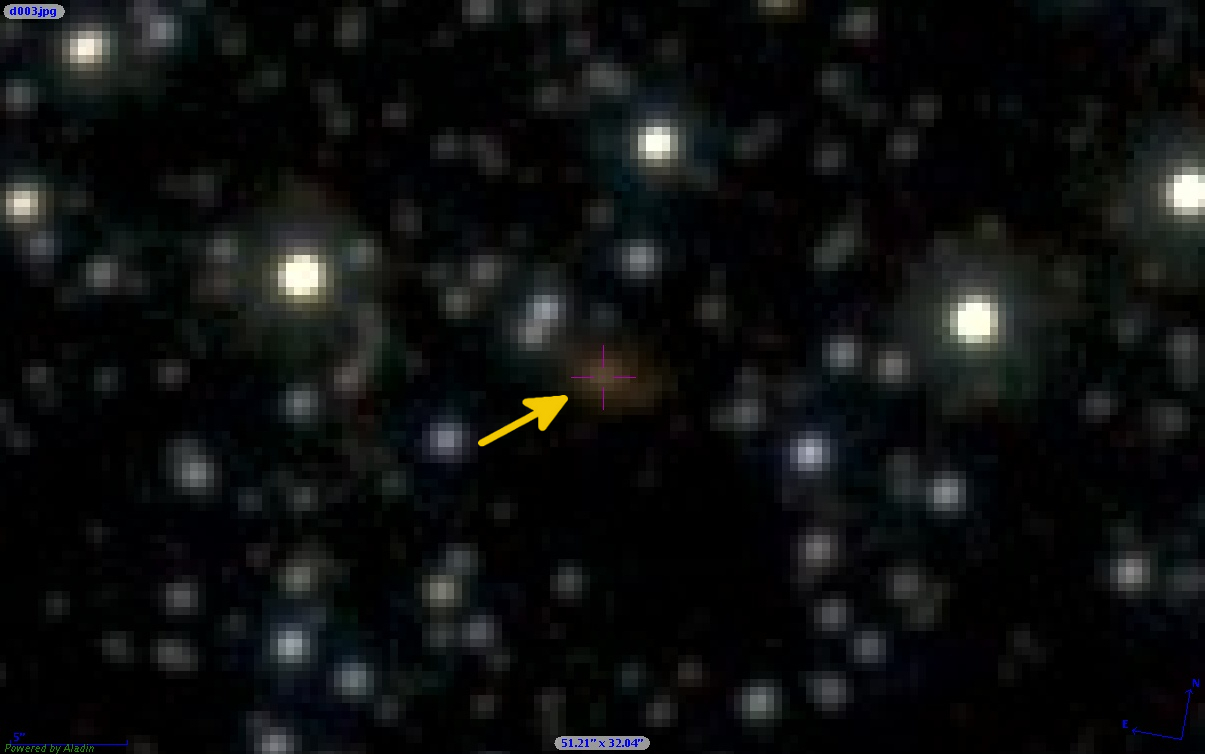
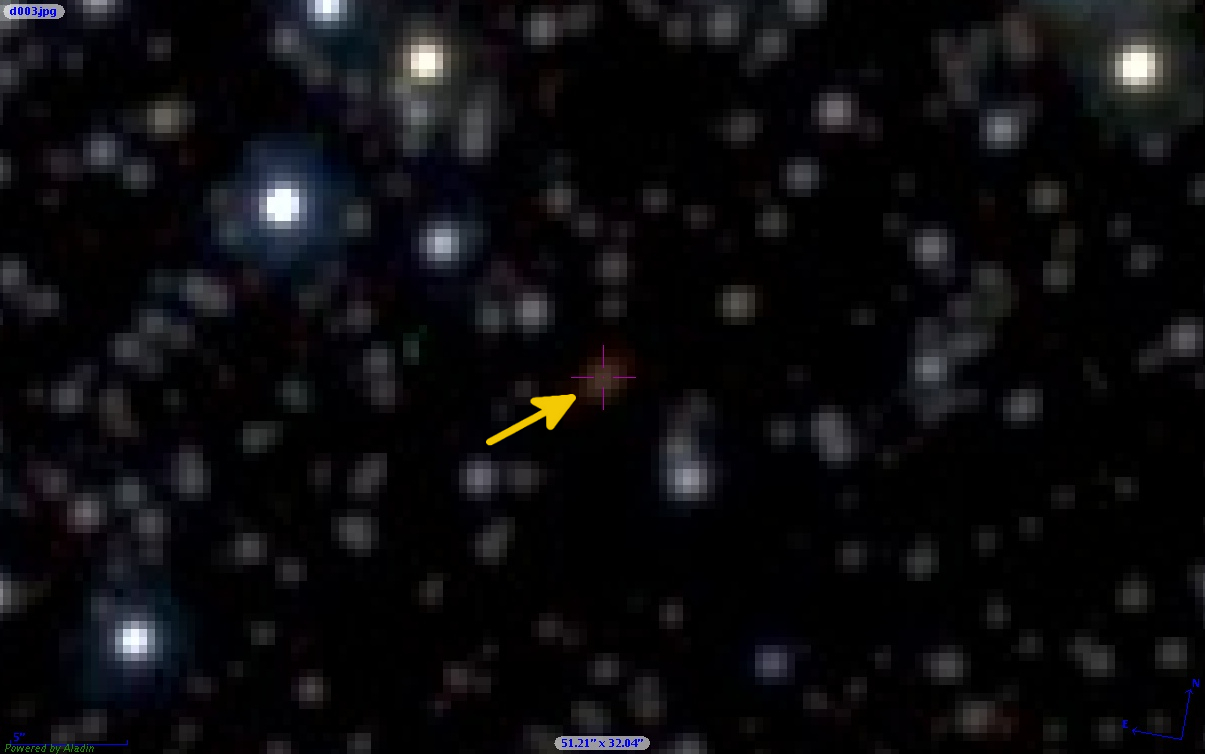
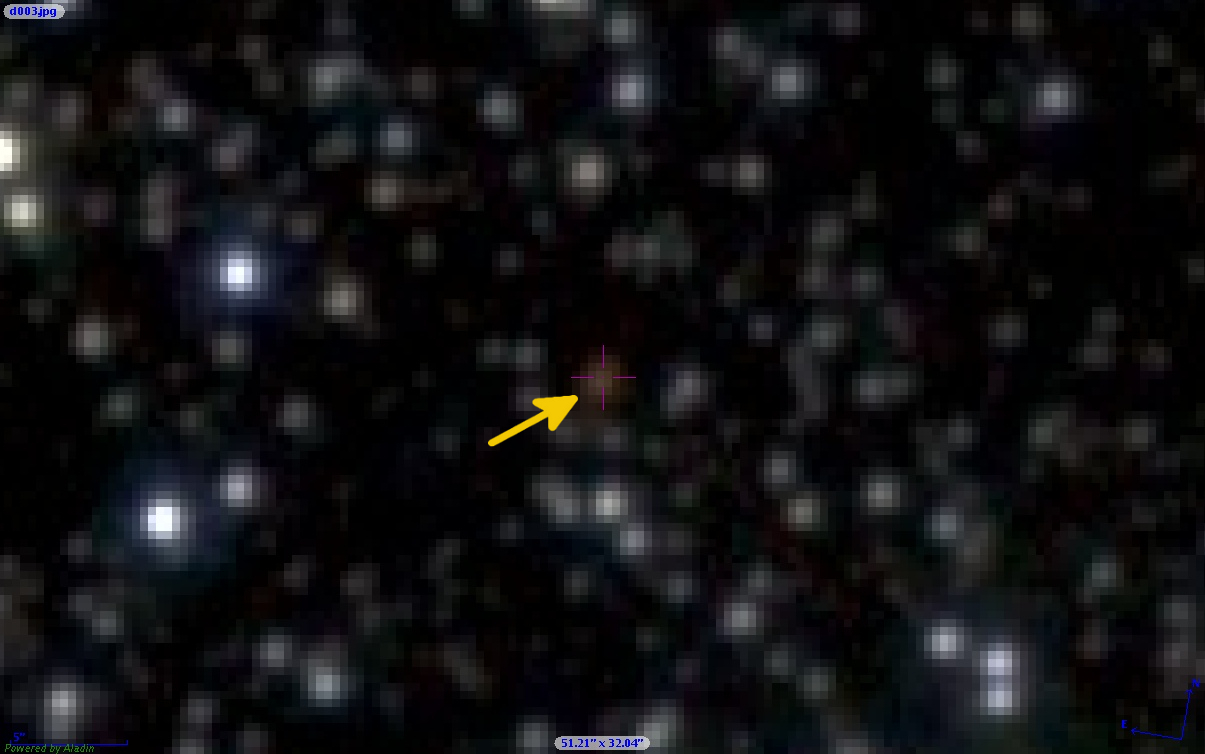
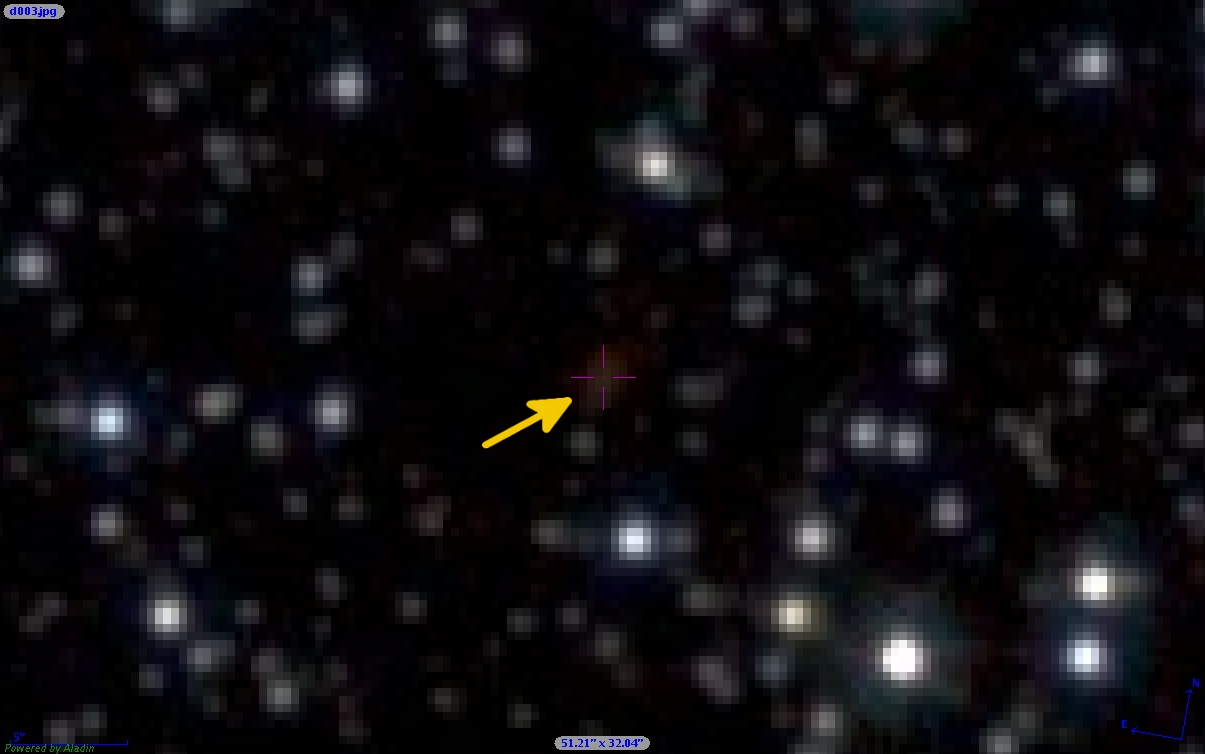
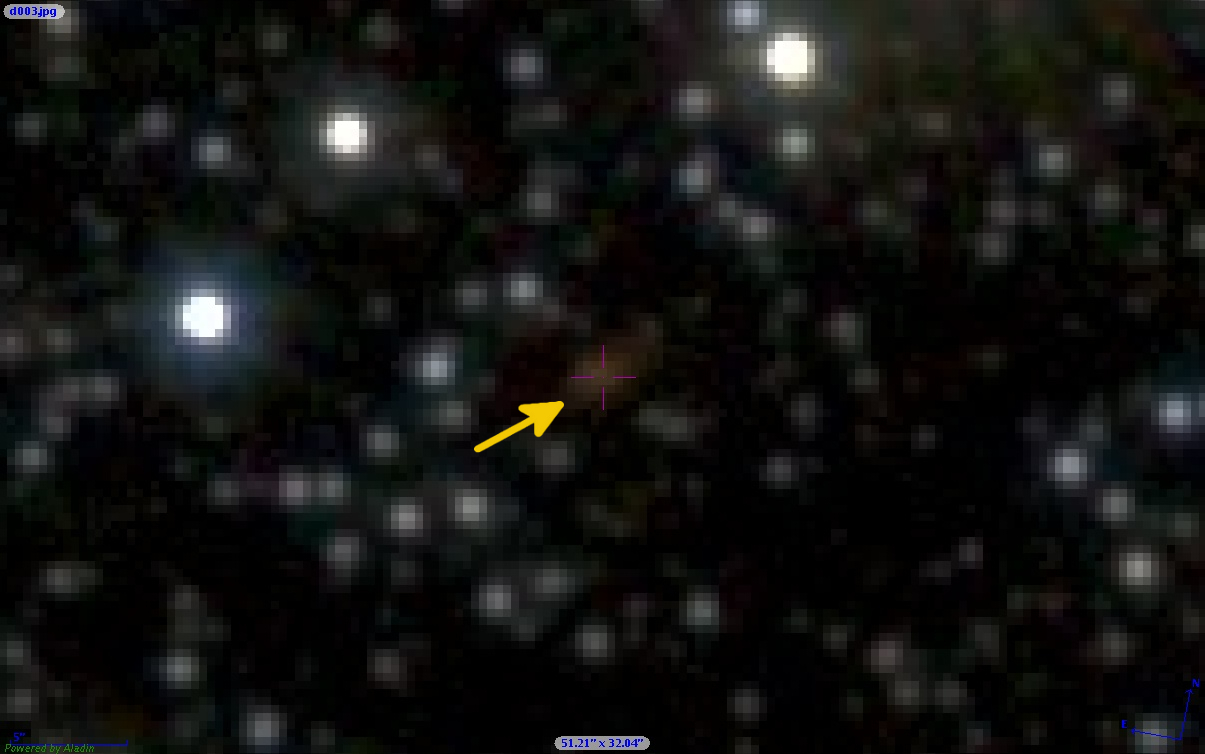
Initially we have analyzed by visual inspection a false-color image (in J, H, Ks) of the d003 tile using Aladin (Bonnarel et al. 2000) in order to identify extended sources that we consider to have galaxy features. A total of 473 sources were found in this way and we can see some examples in Figure 1. Figure 3 also shows twenty objects classified by us as galaxy candidates located at the center of figures for several directions within d003 tile with their number in our catalog.
By using the coordinates of the objects, we have performed a cross-id search of 5 arcsec in the CASU database. As a next step, we made a superposition of these sources in the false-color image in order to assure that the sources found in this search correspond to those obtained through visual inspection and if the source has galaxy features. The resulting number of sources obtained with this analysis is 300.
A more robust method for identifying galaxies in large surveys is an analysis of properties that can be performed automatically. These include colors, sizes, and ellipticity. In the next section we present an analysis of these objects using these properties.
5 Identification of d003 galaxies
Color-color diagrams are useful tool for discriminate galaxies from stars in an objective way, since they occupy well defined regions in the diagrams. However, due to the high crowding in the Galactic plane region, most of the extended sources could be, in fact, double or multiple stars.
Covey et al. (2007) traced the location of the main-sequence stars in the ugrizJH color-color space with a sample containing 600,000 point sources observed by 2MASS and SDSS (Abazajian et al. 2009), providing fits of stellar color locus as a function of color. Hewett et al. (2006) also presented synthetic color-color diagrams for stars and galaxies in a study of UKIRT infrared photometric system.
We have analyzed the colors of 300 galaxy candidates in the ZYJHKs color-space by means of three color-color diagrams (Figure 4) as well as J-Ks and H-Ks color histograms. We have flagged objects as belonging to the stellar locus for both objects located in the high star density region444we have defined as high star density region the space in the color-color diagrams in which the colors are red and yellow in the diagrams of Figure 4. of each color-color diagram and have colors J-K or H-K. Next, multi-band visual classification was performed independently by six co-authors classifying the objects as likely galaxy, possible galaxy (see classification below), or to be discarded, e.g. seems to be a star, appearing star-like in all bands: Z, Y, J, H and Ks.
We have classified the galaxy candidates in two different categories. Type I sources (possible galaxies) have galaxy features and are photometrically consistent with those expected for galaxies. Type II (likely-galaxies) sources do not have clear Galactic features, but are photometrically consistent with galaxies and do not appear to have PSF-like shapes. For Type II, additional verification is necessary.
Final classification is based on the objects ’color distribution and the co-authors’ visual inspection of the multi-band images. For the objects outside the high star density regions in the color-color diagrams, at least three co-authors must give the same visual classification for an object to be classified as Type I or II. For the objects at high stellar density, we had more caution, requiring five authors to agree on the classification.
Figure 4 shows color-color density maps with the colors obtained from BGM and TRI-LEGAL star counts models (both introduced in the Section 4) over the entire d003 tile. The colors for galaxy candidates are the observed ones in the VVV and for star counts simulations take into account a more realistic extinction model. We show objects classified as Type I (possible) as black crosses and Type II (likely-galaxies) as red diamonds, revealing a separation between stars and galaxies. In particular, Figure 4a (J-H vs H-Ks color-color diagram) shows significant separation between the objects classified as both Type I and mostly of Type II and the region of high stellar density.
There are some objects classified by us as galaxy-like that are located in moderate density stellar regions, mostly for the diagrams that involved Y and Z filters, which can also be attributed to high interstellar extinction. However, most of these objects show clear galaxy features, and their NIR colors are outside the highest stellar density regions. Thus, we kept those objects in our list with flag equal to ’2’ in Table 2.
As pointed out by Jarrett et al. (2000a), two effects conspire to make galaxies appear ”red” in the m window: their light is dominated by older and redder stellar populations (e.g., K and M giants), and their redshifts tend to transfer additional stellar light into the 2 m window (for z 0.5), boosting the K-band flux relative to the J-band flux (K-correction). They also noticed that J-K color is a reasonable limit to separate stars from galaxies. Another useful piece of information from the color-color diagrams is that galaxies have H-K colors larger than 0.3, redder than most of the stars.
The location of most of galaxy candidates in our color-color diagrams (Figure 4) are also consistent with the synthetic ones presented by Hewett et al. (2006) (see their Figure 3).
One of the main differences between our diagrams and those presented by Hewett et al. (2006) is that the diagram represented in Figure 4c is that ours shows a narrower range of colors for the galaxies. This can be interpreted as an effect of interstellar extinction (they considered A) and mainly of redshift since the galaxies in Hewet et al. span from 0 to 3.6.
In total, there are 72 objects classified as source Type I and 142 as source Type II. Figure 5 shows images of a sample of objects classified as source Type I in the Ks filter. Figure 6 shows multi-band images for five possible galaxies. In total there that are 44 objects detected in all of the five filters and 119 objects with common data in J, H and Ks. Figure 7 shows a histogram with counts of galaxy candidates. It can be seen that completeness limit without extinction correction for this tile is around K 16.5 mag.
Our final catalog of galaxy candidates contains magnitudes and errors in five filters, the Petrosian radius, ellipticity and PA for each object as well as our classification as presented in Table 2 (that shows only part of the catalog). The full version is available on-line. The ranking in this table is from 1 to 300 since it follows the object number as selected by-eye inspection and with match in VVV database (Section 4.2).
Figure 8 shows the spatial distribution of the objects assigned as source Type I (crosses) and source Type II (diamonds) for two ranges of magnitudes K and K mag, denoted with smaller and large symbols, respectively. The density counts represent the star counts observed by VVV, corrected by the effects of interstellar extinction using BGM. It can be seen that in the region that corresponds to high stellar density the detected galaxies counts decrease.
Another powerful tool to identify extended objects is through a size versus magnitude diagram (Jarrett et al. 2000a). This procedure allows us to discriminate between stars (point sources) and extended sources in an objective way, since they occupy well defined regions in this diagram. However, due to the high crowdness in the region, most of the extended sources are, in fact, double or multiple stars. Figure 9 shows three types of sources in different colors: stars (point sources), Type I (crosses) and II (red). In the present work only stellar located within 5 arcsec of each galaxy candidate have been considered. For both Type I and II, a Petrosian radius of 4.0 arcsec separates most of stars from galaxy candidates.
5.1 Mock catalogues
We constructed two mock VVV galaxy catalogues extracted from the Bower et al. (2007) semi-analytic galaxies that populate the Millennium simulation (Springel et al., 2005). The Galactic absorption from Marshall et al. (2006) is only included in one of them. In order to construct the catalogues we place an observer in the Millennium simulation box and include all galaxies with an apparent, observer-frame K without and with extinction, respectively covering the disc and bulge sections of the VVV survey. The final number of galaxies in the catalogues is 61,332 and 34,854 without and with extinction, respectively.
Figure 10 shows the histogram of number of galaxies per VVV disc tile of square degrees from the mocks (solid lines for the catalogue with no Galactic extinction, dotted when the extinction is taken into account and the average extinction for d003). The solid line shows the range of number of galaxies expected in tiles due to fluctuations of the clustering of the background galaxies, whereas the dotted line shows the combined effect of background clustering and foreground extinction. On average, the lowest numbers of galaxies in the catalogue with extinction correspond to the highest extinctions (and vice-versa), however this is only a statistical relation. As can be seen in the previous section that the number of galaxy candidates in disc tile d003 is typical for the number of galaxies in the mocks for an average Galactic extinction in the MW disc.
We can provide a coarse estimate of the total number of galaxies to be found in the VVV Survey by inspecting the interstellar models proposed by AL05. We count the number of VVV fields that have similar or less total extinction than field d003, which is 40 in the disk and 140 in the bulge. Assuming the background galaxy distribution throughout the disk and bulge is similar to that of field d003, a wrong assumption since we are not taking into account the crowdness distribution, but good as a first approximation, we multiply the number of galaxies in field d003 by 60. The result allows us to predict that there would be of order of 15,000 galaxies in the VVV Survey database.
6 Conclusions
Using ZYJHKs imaging, we identify 204 new galaxy candidates in a region of the VVV covering 1.636 square degrees. This region is near the Galactic plane, at (,b) = (298.3558,-1.6497). We have identified 72 objects as source Type I and 142 as source Type II out of 204 sources.
We identify galaxy candidates both by visual inspection and by excluding stars based on the colors, magnitudes, and sizes of our objects. We compare our MW galaxy catalogue with those obtained by other authors, over similar volume, and find that none555We also have verified (February, 9 th) at NED/IPAC database and no object classified as galaxy was found towards d003 tile. of our proposed galaxies have ever been detected in any other survey mostly because they are too faint due to the effects of Galactic extinction and crowdness.
The large obscuration in the Galactic plane is an obstacle for detection of galaxies and large scale structures that exist in the directions of the Galactic plane. Although with VVV we increase the known number density of known galaxies in the d003 tile, we will be able to increase our sensitivity ever further as we start combining multi-epoch data as these become available.
The VVV survey brings considerable progress to the observation of fainter sources behind the Galactic plane due to its resolution and completeness limits. However, this is still a large number compared with the expectations for the whole VVV Survey because d003 is a relatively ”clear” field. We have estimated that our survey will detect about a billion point sources, and about 15,000 galaxies. The difficulty of this task is illustrated by the small fraction of galaxy candidates found amongst so many stars of our galaxy: only one out of about 5,000 objects is a galaxy, a small fraction indeed (0.020%).
In a forthcoming paper (Amôres et al., in preparation) it will be presented an automatic method to separate galaxies from stars in the Galactic plane and the detected galaxies by VVV survey for both Galactic bulge and disk. With our method we should be able to minimize the J- threshold problem that causes bluer galaxies to drop out in surveys.
The observation of background galaxies and the related improvement of photometric redshifts can also help to solve the open questions left behind by matter density estimations performed using galaxy peculiar velocities (e.g. POTENT) and X-ray surveys (CIZA) which point out to the existence of relatively massive structures behind the Milky Way. Thus, a map of projected number density of objects will be a valuable addition to our understanding of nearby large-scale structure to probe the existence of nearby Great Attractor-like background objects. However, a crucial step is to use d003 candidates as spectroscopic targets to really confirm the nature of these candidates. This will give us a statistical estimates of the galaxy detection that is possible by using only VVV data photometry.
References
- Abazajian et al. (2009) Abazajian, Kevork N. and SDSS collaboration, 2009, ApJS, 182, 543
- Amôres et al. (2005) Amôres, E. B., Lépine, J. R. D., 2005, AJ, 130, 679 (AL05)
- Amôres et al. (2012) Amôres, E. B., Robin, A. C., 2012, in preparation, to be submitted to A&A
- Bonnarel et al. (2000) Bonnarel, F., Fernique, P., Bienaymé, O., Egret, D., Genova, F., Louys, M., Ochsenbein, F., Wenger, M., Bartlett, J. G., 2000, A&AS, 143, 33
- Bower et al. (2007) Bower, R. G.; Benson, A. J., Malbon, R.; Helly, J. C., Frenk, C. S., Baugh, C. M., Cole, S., Lacey, C. G., 2007, MNRAS, 370, 645
- Bertin et al. (1996) Bertin, E., Arnouts, S., 1996, A&AS, 117, 393
- Bronfman et al. (1992) Bronfman, L., 1992, ASSL, 180, 131
- Covey et al. (2007) Covey, K. R., et al., 2007, AJ, 134, 2398
- Dobashi et al. (2005) Dobashi, K., Uehara, H., Kandori, R., Sakurai, T., Kaiden, M., Umemoto, T., Sato, F., 2005, PASJ, 57,S1-S368
- Dressler et al. (1991) Dressler, A., 1991, Nature, 350, 391
- Ebeling et al. (2000) Ebeling H., Mullis C.R, Tully R.B., 2000, ASP Conference Series, 218, 79
- Fairall et al. (1998) Fairall, A. P., Woudt, P. A., Kraan-Korteweg, R. C., 1998, A&A Supl. Series, 127, 463
- Freudenreich et al. (1998) Freudenreich, H. T., 1998, ApJ, 492, 495
- Froebrich et al. (2005) Froebrich, D., Ray, T. P., Murphy, G. C., Scholz, A., 2005, A&A, 432, L67
- Girardi et al. (2005) Girardi, L., Groenewegen, M. A. T., Hatziminaoglou, E., da Costa, L., 2005, A&A, 436, 895
- Irwin et al. (1994) Irwin et al. 1994 SPIE 5493 411
- Jarrett et al. (2000a) Jarrett, T. H., Chester, T., Cutri, R., Schneider, S., Skrutskie, M., Huchra, J. P., AJ, 2000, AJ, 119, 2498 (Jarrett et al. 2000a)
- Jarrett et al. (2000) Jarrett, T.-H., Chester, T., Cutri, R., Schneider, S., Rosenberg, J., Huchra, J. P., Mader, J., 2000, AJ, 120, 298 (Jarrett et al. 2000b)
- Jarrett et al. (2007) Jarrett, T. H., Koribalski, B. S., Kraan-Korteweg, R. C., Woudt, P. A., Whitney, B. A., Meade, M. R., Babler, B., Churchwell, E., Benjamin, R. A., Indebetouw, R., 2007, AJ, 133, 979
- Hewett et al. (2006) Hewett, P. C., Warren, S. J., Leggett, S. K., Hodgkin, S. T., 2006, MNRAS, 367, 454
- Hurt et al. (2000) Hurt, R., Jarrett, T., Kirkpatrick, J., Cutri, R., Schneider, S., Skrutskie, M., van Driel, W., 2000, AJ, 120, 1876
- Kraan-Korteweg et al. (1995) Kraan-Korteweg, R. C., Fairall, A. P., Balkowski, C., 1995, A&A, 297, 617
- Kraan-Korteweg et al. (2000) Kraan-Korteweg, R. C., Lahav, O., 2000, A&ARv, 10, 211
- Kraan-Korteweg et al. (2002) Kraan-Korteweg, R. C., Henning, P. A., Schröeder, A. C., 2002, A&A, 391, 887
- Kocevski et al. (2005) Kocevski D., Ebeling H., 2005, ApJ, 645, 1043
- Kocevski et al. (2007) Kocevski D., Ebeling H., Mullis C., Tully R.B., 2007, ApJ, 662,224
- Koribalski et al. (2004) Koribalski, B., S., et al., 2004, AJ, 128, 16
- Lynden-Bell et al. (1988) Lynden-Bell, D., Faber, S. M., Burstein, D., Davies, R., L., Dressler, A., Terlevich, R. J., Wegner, G., 1988, ApJ, 326
- Marshall et al. (2006) Marshall, D. J., Robin, A. C., Reylé, C., Schultheis, M., Picaud, S., 2006, A&A, 453, 635
- Marleau et al. (2008) Marleau, F. R., Noriega-Crespo, A., Paladini, R., Clancy, D., Carey, S., Shenoy, S., Kraemer, K. E., Kuchar, T., Mizuno, D. R., Price, S., 2008, AJ, 136, 662
- Minniti et al. (2010) Minniti, D., et al., 2010, New Astronomy, 15, 433
- Nagayama et al. (2004) Nagayama, T., Woudt, P. A., Nagashima, C., Nakajima, Y., Kato, D., Kurita, M., Nagata, T., Nakaya, H., Tamura, M., Sugitani, K., Wakamatsu, K., Sato, S., 2004, MNRAS, 354, 980
- Neckel et al. (1980) Neckel, Th., Klare, G., 1980, A&A Supl. Series, 42, 251
- Paturel et al. (2005) Paturel, G., Vauglin, I., Petit, C., Borsenberger, J., Epchtein, N., Fouqué, P., Mamon, G., 2005, A&A, 430, 751
- Radburn-Smith et al. (2006) Radburn-Smith, D. J., Lucey, J. R., Woudt, P. A., Kraan-Korteweg, R. C., Watson, F. G., 2006, MNRAS, 369, 1131
- Robin et al. (2003) Robin, A. C., Reylé, C., Derriére, S., Picaud, S., 2003, A&A, 409,523
- Robin et al. (2009) Robin, A., A&A, 2009, 500, 165
- Russeil et al. (2003) Russeil, D., 2003, A&A, 397, 133
- Ryan-Weber et al. (2002) Ryan-Weber, E., et al., 2002, AJ, 124, 1954
- Saito et al. (2012) Saito, R. K., Hempel, M., Minniti, D., Lucas, P. W., Rejkuba, M. and VVV collaboration, 2012, A&A, 537
- Schlegel et al. (1998) Schlegel, David J.; Finkbeiner, Douglas P.; Davis, Marc,1998, ApJ, 500, 525 (SFD)
- Skrutskie et al. (2006) Skrutskie, M. F. et al., 2006, AJ, 131,1163
- Skrutskie et al. (1997) Skrutskie, M. F. et al., 1997, In The Impact of Large Scale Near-IR Sky Surveys, eds. F. Garzon et al., p. 25. Dordrecht: Kluwer Academic Publishing Company, 1997
- Schröeder et al. (2007) Schröeder, A. C., Mamon, G. A., Kraan-Korteweg, R. C., Woudt, P. A., 2007, A&A, 466, 481
- Schröeder et al. (2009) Schröeder, A. C., Kraan-Korteweg, R. C., Henning, P.A., 2009, A&A, 505, 1049
- Springel et al. (2005) Springel et al. 2005, Nature, 435, 629
- Tollerud et al. (2008) Tollerud, E., J., 2008, AJ, 688, 277
- Tonry et al. (2001) Tonry, J. L., et al., 2001, ApJ, 546, 681
- van Driel et al. (2009) van Driel, W., Schneider, S. E., Kraan-Korteweg, R. C., Monnier Ragaigne, D., 2009, 505, 29
- Woudt et al. (1998) Woudt, P. A., Kraan-Korteweg, R. C., Fairall, A. P., 1998, A&A, 352, 39
- Woudt et al. (2001) Woudt, P. A., Kraan-Korteweg, R. C., 2001, A&A, 380, 441
- Woudt et al. (2004) Woudt, P. A., Kraan-Korteweg, R. C., Cayatte, V., Balkowski, C., Felenbok, P, 2004, A&A, 416, 9
- Yasuda et al. (2001) Yasuda, N., et al., 2001, AJ, 112, 1104


| 022 | 034 | 065 | 088 |
 |
 |
 |
 |
| 089 | 135 | 148 | 171 |
 |
 |
 |
 |
| 175 | 191 | 196 | 201 |
 |
 |
 |
 |
| 205 | 208 | 213 | 226 |
 |
 |
 |
 |
| 229 | 244 | 249 | 257 |
 |
 |
 |
 |


| 5 | 6 | 10 | 17 |
 |
 |
 |
 |
| 24 | 25 | 33 | 41 |
 |
 |
 |
 |
| 42 | 44 | 46 | 48 |
 |
 |
 |
 |
| 49 | 57 | 58 | 60 |
 |
 |
 |
 |
| 65 | 69 | 70 | 72 |
 |
 |
 |
 |
| 74 | 76 | 77 | 79 |
 |
 |
 |
 |
| 84 | 86 | 91 | 92 |
 |
 |
 |
 |
| 93 | 94 | 107 | 108 |
 |
 |
 |
 |
| 115 | 128 | 133 | 135 |
 |
 |
 |
 |
| 146 | 147 | 150 | 151 |
 |
 |
 |
 |
| 161 | 162 | 165 | 167 |
 |
 |
 |
 |
| 168 | 173 | 177 | 178 |
 |
 |
 |
 |
| 182 | 187 | 189 | 191 |
 |
 |
 |
 |
| 196 | 197 | 199 | 201 |
 |
 |
 |
 |
| 202 | 208 | 211 | 216 |
 |
 |
 |
 |
| 217 | 218 | 220 | 226 |
 |
 |
 |
 |
| 227 | 228 | 239 | 240 |
 |
 |
 |
 |
| 245 | 259 | 260 | 262 |
 |
 |
 |
 |
| Z | Y | J | H | Ks |
 |
 |
 |
 |
 |
| 128 | ||||
 |
 |
 |
 |
 |
| 182 | ||||
 |
 |
 |
 |
 |
| 191 | ||||
 |
 |
 |
 |
 |
| 201 | ||||
 |
 |
 |
 |
 |
| 218 |


| region | ||||
|---|---|---|---|---|
| VVV disk | 22 | 0 | 155 | 0 |
| VVV bulge | 46 | 11 | 187 | 6 |
| 14 | 4 | 65 | 1 |
| no | Gal. Longitude | Gal. Latitude | Z | Y | J | H | Ks | ellipticity | PA | class | |
|---|---|---|---|---|---|---|---|---|---|---|---|
| 1 | 299.054643 | -1.216376 | —— —— | —— —— | —— —— | 16.689 0.033 | 16.354 0.049 | 8.87 | 0.183 | 117.5 | 2 |
| 2 | 299.052010 | -1.248499 | 19.330 0.074 | 18.715 0.071 | 17.898 0.054 | 17.211 0.054 | 16.872 0.079 | 5.20 | 0.414 | 41.6 | 2 |
| 3 | 299.047234 | -1.294900 | 19.524 0.089 | 18.891 0.083 | 17.989 0.059 | 17.053 0.046 | 16.377 0.051 | 5.54 | 0.303 | 86.9 | 2 |
| 4 | 299.046990 | -1.579076 | 19.535 0.088 | 18.944 0.086 | 18.003 0.059 | 17.114 0.048 | 16.293 0.046 | 7.22 | 0.671 | 109.6 | 2 |
| 5 | 299.047811 | -1.580668 | —— —— | —— —— | 18.400 0.084 | 17.134 0.049 | 16.145 0.040 | 4.88 | 0.261 | 107.9 | 1 |
| 6 | 299.050006 | -1.582006 | —— —— | —— —— | 18.467 0.090 | 17.220 0.053 | 16.126 0.039 | 7.03 | 0.550 | 169.3 | 1 |
| 9 | 298.984289 | -1.470670 | 20.405 0.193 | —— —— | 18.104 0.064 | 16.937 0.042 | 15.938 0.033 | 4.98 | 0.163 | 16.7 | 2 |
| 10 | 298.984422 | -1.468328 | 20.056 0.141 | 19.331 0.122 | 18.539 0.095 | 17.817 0.093 | 17.394 0.125 | 5.98 | 0.483 | 67.1 | 1 |
| 12 | 299.037877 | -1.584041 | 19.946 0.128 | 18.906 0.083 | 17.529 0.039 | 16.302 0.023 | 15.396 0.020 | 6.63 | 0.108 | 23.7 | 2 |
| 13 | 298.991020 | -1.573740 | —— —— | —— —— | —— —— | 18.508 0.174 | 17.625 0.154 | 5.46 | 0.433 | 16.1 | 2 |
| 14 | 299.000353 | -1.675140 | 19.438 0.080 | 18.538 0.060 | 17.480 0.037 | 16.316 0.024 | 15.460 0.022 | 8.39 | 0.233 | 82.9 | 2 |
| 15 | 298.985578 | -1.679874 | —— —— | —— —— | 18.521 0.094 | 17.228 0.054 | 16.258 0.044 | 7.13 | 0.107 | 79.1 | 2 |
| 16 | 298.999713 | -1.680083 | 18.501 0.035 | 18.102 0.040 | 17.416 0.035 | 16.611 0.031 | 16.161 0.041 | 8.05 | 0.163 | 74.4 | 2 |
| 17 | 298.978338 | -1.698410 | —— —— | —— —— | 18.025 0.060 | 16.874 0.039 | ———— | 4.95 | 0.151 | 999.9 | 1 |
| 19 | 299.031350 | -1.782191 | —— —— | 19.297 0.118 | 18.184 0.069 | 17.065 0.047 | 16.016 0.036 | 7.83 | 0.374 | 28.6 | 2 |
| 20 | 299.029333 | -1.757842 | —— —— | —— —— | 18.383 0.082 | 17.259 0.056 | 16.358 0.048 | 6.84 | 0.277 | 99.6 | 2 |
| 21 | 299.027119 | -1.810838 | 18.314 0.030 | 17.743 0.029 | 16.896 0.022 | 15.994 0.018 | 15.342 0.019 | 7.07 | 0.246 | 167.1 | 2 |
| 22 | 298.979133 | -1.827110 | —— —— | —— —— | 17.224 0.029 | 16.256 0.022 | 15.547 0.023 | 5.52 | 0.121 | 123.8 | 2 |
| 23 | 299.004038 | -1.842581 | 19.639 0.096 | 18.743 0.071 | 17.564 0.040 | 16.471 0.027 | 15.657 0.026 | 8.08 | 0.240 | 142.2 | 2 |
| 24 | 299.021832 | -1.912362 | —— —— | 19.799 0.187 | 18.538 0.095 | 17.359 0.061 | 16.406 0.051 | 7.47 | 0.066 | 65.2 | 1 |
| 25 | 299.015743 | -1.914765 | —— —— | —— —— | 19.035 0.150 | 17.821 0.093 | 16.796 0.073 | 5.28 | 0.236 | 31.6 | 1 |
| 26 | 298.991532 | -1.914227 | 19.160 0.063 | 18.543 0.060 | 17.577 0.040 | 17.130 0.049 | 15.704 0.027 | 9.17 | 0.392 | 103.3 | 2 |
| 28 | 298.952531 | -1.297467 | —— —— | —— —— | —— —— | 18.445 0.166 | 17.431 0.133 | 6.00 | 0.545 | 105.6 | 2 |
| 31 | 298.924510 | -1.395874 | —— —— | —— —— | 19.665 0.267 | 18.506 0.175 | 17.576 0.150 | 4.61 | 0.284 | 68.4 | 2 |
| 33 | 298.922812 | -1.503068 | 19.927 0.125 | 19.060 0.095 | 18.333 0.079 | 17.272 0.056 | 16.360 0.049 | 6.97 | 0.137 | 95.3 | 1 |
| 34 | 298.876502 | -1.512565 | —— —— | —— —— | 17.991 0.058 | 16.693 0.033 | 15.694 0.027 | 6.37 | 0.064 | 31.8 | 2 |
| 11footnotetext: The full version will be available on-line. |