Search for solar axions produced by Compton process and bremsstrahlung using axioelectric effect
Abstract
The axio-electric effect in silicon atoms is sought for solar axions appearing owing to bremsstrahlung and the Compton process. Axions are detected using a Si(Li) detector placed in a low-background setup. As a result, a model-independent constraint on the axion-electron coupling constant has been obtained, which leads to the bounds 7.9 eV and 1.4 keV for the mass of the axion in the DFSZ and KSVZ models, respectively (90% C.L.).
I INTRODUCTION
The axion is a neutral pseudoscalar particle introduced in the theory in order to explain the absence of the violation in strong interactions Peccei:1977 - Wilczek:1978 . The effective axion-photon (), axion-lepton (), and axion-hadron () coupling constants, as well as the mass of the axion , are inversely proportional to the energy at which (1) symmetry introduced in Peccei:1977 is broken. The initial model of the standard PQWW -axion, where is fixed at the electroweak scale, was reliably excluded by reactor and accelerator experiments Nakamura:2010 .
New models of an invisible axion with an arbitrary scale of symmetry breaking stimulated continuation of the experimental search for a pseudo-scalar particle with a mass in a wide range from to eV. The models of the KSVZ axion (hadron axion) Kim:1979 ; Shifman:1980 and the DFSZ axion (GUT axion) Zhitninskii:1980 ; Dine:1981 are the two main models of the invisible axion. The mass of the axion in both models is expressed in terms of the properties of the meson as
| (1) |
where and are the mass and decay constant of the meson, respectively, and and are the quark mass ratios.
The most stringent bounds on the interaction of the axion with matter were obtained from astrophysical and cosmological data. Astrophysical constraints based on the interaction of axions with photons and electrons lead to the bound eV if the standard relation between , , and is usedNakamura:2010 ; Raffelt:2006 . The SN1987A data provide upper and lower bounds for the axion-nucleon coupling constantRaffelt:1999 . These bounds allow the axion mass range eV (the so-called hadron axion window). At the same time, the latest cosmological data imply that eV Raffelt:2001 .
Experimental bounds on the mass of the axion follow from constraints on the , , and coupling constants, which significantly depend on the theoretical model used. In particular, the hadron axion does not interact with leptons and usual quarks at the tree level. This leads to the strong suppression of the interaction of the axion with leptons, which is due only to radiative corrections. In some models, the axion-photon coupling constant is strongly different from the initial values for the models of the DFSZ and KVSZ axions Kaplan:1980 .
This work is devoted to the search for axions appearing in the Sun owing to the axion-electron interaction, namely, bremsstrahlung from electrons in the field of a nucleus, , and the Compton process, Kato:1975 -Kekez:2009 . The reaction cross sections and, therefore, axion fluxes are proportional to .
To detect axions, we used the axio-electric absorption of an axion by atoms, which is an analog of the photoelectric effect. Since the reaction cross sections are proportional to , the expected count rate of axions depends only on the axion-electron coupling constant and is proportional to . The dimensionless constant is generally related to the electron mass and as = , where is the model -dependent parameter of about 1. In the DFSZ axion model, is related to the electron mass as
| (2) |
where is an arbitrary angle. In the KSVZ axion model, is much smaller (by a factor of about ), because it is determined only by radiative corrections Srednicki:1985 :
| (3) |
where is the number of generations, E/N is the model dependent ratio of the order of unity and GeV is the QCD cutoff scale.
II SPECTRA OF SOLAR AXIONS AND THE CROSS SECTION FOR THE AXIO-ELECTRIC EFFECT
The spectrum of Compton axions () appearing in the reaction was calculated by integrating the Compton conversion cross section obtained in Pospelov:2008 ; Gondolo:2009 over the Planck energy distribution of thermal photons taking into account the radial distribution of the temperature and electron density in the standard solar model BSB05 Bahcall:2005 for the high-metallicity case Asplund:2006 . The calculation results for various masses of the axions are shown in Fig.1.

The spectrum of bremsstrahlung axions () was calculated by the same method. The cross section for the reaction was obtained in Zhitnitsky:1979 . The Maxwell-Boltzmann distribution was used to describe the energy spectrum of electrons. Bremsstrahlung was considered in the field of H, , , , , and nuclei. The spectrum of bremsstrahlung axions is softer (Fig.1).
The calculation procedures were described in detail in Derbin:2011 , where simple parameterizations describing the spectra with an accuracy of 1% in the range of (1–10) keV were presented. The spectra of axions shown in Fig. 1 were calculated for . The average energies of axions are 1.6 keV and 5.1 keV for bremsstrahlung and Compton axions, respectively, for the case . The maximum intensity is reached at energies of 0.6 keV and 3.8 keV, respectively. The axion flux almost vanishes at energies above 20 keV.
An axion interacting with an electron should undergo axio-electric absorption, which is an analog of the photoelectric effect. Silicon atoms entering into the composition of a Si(Li) detector were used in our experiment as targets for the axio-electric effect. The cross section for the axio-electric effect for nonrelativistic axions is proportional to the cross section for the photoelectric effect for photons with the energy equal to the mass of the axion Pospelov:2008 :
| (4) |
where is the velocity of the axion. For relativistic axions in the case and , the cross section differs from Eq. (4) by a factor of about and by a change of to Pospelov:2008 ; Derevianko:2010 . The cross section for the photoelectric effect (E) for various energies of photons was calculated using the XCOM database Berger:1 . Since the efficiency of the detection of an appearing electron and accompanying X rays by a Si(Li) detector is the expected spectrum of the detected energy is given by the expression
| (5) |
To compare with the experimentally measured spectrum, Eq. (5) should be additionally averaged using the response function of the Si(Li) detector, which is well described by a Gaussian for photons and electrons in the energy range of (0–20) keV. The cross section for the axio-electric effect calculated for is shown in Fig.2 along with the expected spectrum from axions with and without the inclusion of the energy resolution of the Si(Li) detector (). The spectrum has a characteristic feature at an energy of 1.84 keV, which corresponds to the binding energy of electrons in the K shell. The peak shape of the feature significantly increases the sensitivity of the experiment compared to the case of a smooth curve.

The number of detected electrons and X-ray photons following the absorption of an axion depends on the number of silicon atoms in the detector, the time of measurements, and the efficiency of the detector. The probability of observing a signal is determined by the background of the experimental setup.
III EXPERIMENTAL SETUP
In the experiment, we used a Si(Li) detector with a sensitive-region diameter of 17 mm and a thickness of 2.5 mm. The detector was placed in a vacuum cryostat with the input beryllium window 20 m thick. The window was used for energy calibration and determination of the detection efficiency of gamma-ray photons in order to find the sensitive volume of the detector.
The detector was surrounded by 12.5 cm of copper and 2.5 cm of lead, which reduced the background of the detector at an energy of 14 keV by a factor of 110 as compared to the unshielded detector. In order to suppress the background from cosmic rays and fast neutrons, we used five scintillation detectors, which closed the detector almost completely except for the bottom side, where a Dewar vessel with liquid nitrogen was placed.
The spectrometric channel was organized as follows. A field-effect transistor was mounted on a Teflon plate near the Si(Li) detector and was cooled to a temperature close to liquid nitrogen. A preamplifier except for the first cascade was placed outside the passive shielding in order to reduce the background. A signal after the preamplifier was guided to two amplifiers with different amplification coefficients, which made it possible to measure the spectrum of signals in the low energy (0.5–60) keV and harder (10–500) keV regions. The measurement of two regions allowed the reliable control of the background in the natural radioactivity region. Each spectroscopic channel was equipped with its own analog-to-digital converter. Thus, four 4096-channel spectra were simultaneously accumulated in computer memory (two energy ranges in coincidence and anticoincidence with an active shielding signal).

The sensitive volume of the detector was determined using lines of standard and sources. The determined number of silicon atoms in a sensitive volume of was . The error is mainly due to the inaccuracy of the position of the source with respect to the detector.
IV RESULTS
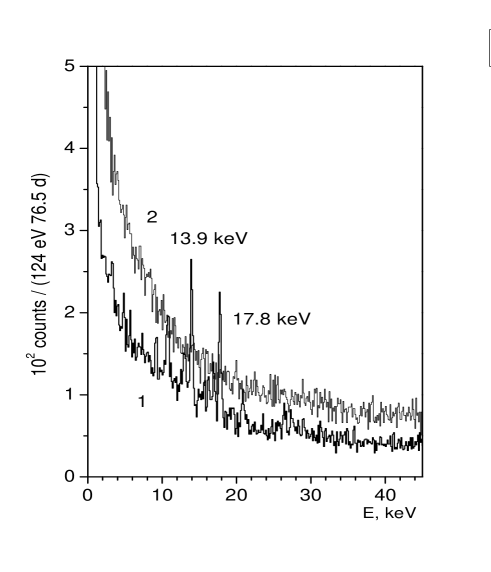
Measurements continued for 76.5 days of pure time in the form of two-hour runs in order to control the stability of the operation of the spectrometric channels of the Si(Li) detector and active shielding scintillation detectors. Figure 3 shows the total energy spectrum of signals in the range of (0.8–45) keV. The spectrum of events detected in anticoincidence with active shielding signals clearly exhibits the 13.9 and 17.8 keV Np X-ray lines attributed to decays of . The spectrum of events detected in coincidence with active shielding signals has no statistically significant peaks.
The spectrum measured in the range of (0.8–9) keV is shown in Fig.4 along with the expected spectrum in the case of the detection of theaxioelectric effect for and (line 4 in Fig.2). It can be seen that the shown characteristic feature is not observed in the measured spectrum. The maximum likelihood method is used to determine the intensity of the response function.


The experimental spectrum was represented in the form of the sum of an exponential describing the smooth background and the response function for axions :
| (6) |
Here, is the number of silicon atoms in the sensitive volume of the detector and is the live time of measurement.
The energy scale and energy resolution were determined from peaks manifested in the measurements and were fixed. The constant and the parameters , , and that describe the continuous background were free parameters. The fit in the range of (1.2–8.0) keV for is shown in Fig.4. The minimum value corresponds to the value = . To determine the upper bound for , we used the standard method: the value was determined by fixed values, whereas the other parameters were free. The resulting probability function was normalized to unity for values . The upper bound for is
| (7) |
at 90% C.L. Limit (7) is a model independent bound for the coupling constant of the axion or any other pseudoscalar relativistic particle with the electron.
If the mass of the axion is several keV, the expected spectrum in the detector changes significantly and depends on the particular value. To determine values, we used the procedure similar to that described above. The spectra of solar axions were calculated for different values of from 1 to 10 keV with a step of 1 keV. The cross section of the axioelectric absorption was calculated by the formula
| (8) |
At 1 and 0, this formula coincides with the cross sections for relativistic and nonrelativistic axions obtained in [27] (Eq. (4)) and provides an extrapolation approximately linear in , which ensures a sufficient accuracy for the case under consideration.
An example of the response function of the detector for detecting axions is shown in Fig.5. The spectrum fitting range was expanded to 16 keV. To describe the experimental spectrum in a wide range, function (6) was supplemented by a linear term for describing the continuous background and six Gaussians for describing the peaks of the characteristic Np X rays manifested in the measurements Derbin:2009 ; Derbin:2009A . The fit for = 5 keV is shown in Fig.5.
The maximum deviation of from zero for all values is 2.5. The upper bounds obtained for at various values are shown in Fig.6 (line 1) in comparison with the other experimental results.
For large masses of the axion keV, the most stringent bounds were obtained from reactor Altmann:1995 ; Chang:2007 and accelerator Konaka:1986 ; Bjorken:1988 experiments, as well as for high energy solar axions Bellini:2008 ; Derbin:2010 ; Bellini:2012 . For small values () keV, the most stringent bounds were obtained from astrophysical data, namely, from the cooling rate of red giants Raffelt:2008 and under the assumption that the axion luminosity of the Sun does not exceed 10% of the observed neutrino luminosity Gondolo:2009 . The search for axions with masses in the intermediate region keV was specially performed in view of the possibility of attributing the DAMA experiment result to the axio-electric effect with silicon and germanium detectors designed for seeking dark matter Aalseth:2008 ; Ahmed:2009 . Solar axions having a continuous energy spectrum should lead to the resonant excitation of low-lying nuclear levels Derbin:2011 .
The upper limit (7) obtained for lead to bounds for the mass of the axion that depend on a particular model. In the model of the DFSZ axion, the relation between and for has the form , where is expressed in eV units. The limit (7) leads to the bound eV (at 90% C.L.). The upper bound for the excluded values units is 15 keV (Fig.6). In the model of the KSVZ axion, and are related through Eq. (3). For the ratio , which is characteristic of most variants of the DFSZ axion, and , the region of excluded values is (1.4–12) keV (Fig.6).
V CONCLUSION
The axio-electric absorption of solar axions, which produced by the Compton process and the bremsstrahlung, by silicon atoms has been sought. To detect the axio-electric effect, a Si(Li) detector placed in a low-background setup was used. As a result, new limits have been obtained for the axion-electron coupling constant and mass of the axion. For axions with a mass smaller than 1 keV, the resulting limit is at 90% C.L..
References
- (1) R. D. Peccei and H. R. Quinn, Phys. Rev. Lett. 38, 1440 (1977).
- (2) S. Weinberg, Phys. Rev. Lett. 40, 223 (1978).
- (3) F. Wilczek, Phys. Rev. Lett. 40, 279 (1978).
- (4) K. Nakamura et al. (Particle Data Group), J. Phys. G37, 075021 (2010).
- (5) J. E. Kim, Phys. Rev. Lett. 43, 103 (1979).
- (6) M. A. Shifman, A. I. Vainstein, and V. I. Zakharov, Nucl. Phys. B 166, 493 (1980).
- (7) A. R. Zhitninskii, Sov. J. Nucl. Phys. 31, 260 (1980).
- (8) M. Dine, F. Fischler, and M. Srednicki, Phys. Lett. B 104, 199 (1981).
- (9) G. G. Raffelt, arXiv:hep-ph/0611350.
- (10) G. G. Raffelt, Ann. Rev. Nucl. Phys. Sci. 49, 163 (1999).
- (11) G. Raffelt, S. Hannestad, A. Mirizzi, and Y. Y. Y. Wong, arXiv:0808.0814.
- (12) D. B. Kaplan, Nucl. Phys. B 260, 215 (1980).
- (13) K. Kato and H. Sato, Prog. Theor. Phys. 54, 1564(1975)
- (14) M. I. Vysotsskii, Ya. B. Zeldovich, M. Yu. Khlopov, and V. M. Chechetkin, JETP Lett. 27, 502 (1978).
- (15) D. A. Dicus, E. W. Colb, V. L. Teplitz, and R. V. Wagover, Phys. Rev. D 18, 1829 (1978); Phys. Rev. D 22, 39 (1980).
- (16) M. Fukugita, S. Watamura, and M. Yoshimura, Phys. Rev. Lett. 48, 1522 (1982).
- (17) L. M. Krauss, J. E. Moody, and F. Wilczek, Phys. Lett.B 144, 391 (1984).
- (18) G. G. Raffelt, Phys. Rev. D 33, 897 (1986).
- (19) M. Srednicki, Nucl. Phys. B 260, 689 (1985).
- (20) D. Kekez, A. Ljubicic, Z. Krecak, and M. Krcmar, Phys. Lett. B 671, 345 (2009).
- (21) M. Pospelov, A. Ritz, and M. B. Voloshin, Phys. Rev. D 78, 115012 (2008).
- (22) P. Gondolo and G. G. Raffelt, Phys. Rev. D 79, 107301(2009).
- (23) J. N. Bahcall, A. M. Serenelli, and S. Basu, Astrophys. J. 621, L85 (2005).
- (24) M. Asplund, N. Grevesse, and J. Sauval, Nucl. Phys. A 777, 1 (2006).
- (25) A. R. Zhitnitsky and Yu. I. Skovpen, Sov. J. Nucl. Phys. 29, 513 (1979).
- (26) A. V. Derbin, A. S. Kayunov, V. N. Muratova, D.A. Semenov, E.V. Unzhakov, Phys. Rev. D 83, 023505 (2011).
- (27) A. Derevianko, V. A. Dzuba, V. V. Flambaum, and M. Pospelov, Phys. Rev. D 82,065006 (2010).
- (28) M. J. Berger, J. H. Hubbel, S. M. Seltzer, et al., XCOM: Photon Cross Sections Database. http:www.nist.gov/pml/data/xcom/index.cfm
- (29) A. V. Derbin, S. V. Bakhlanov, A. I. Egorov, I.A. Mitropol sky, V.N. Muratova, D.A. Semenov, E.V. Unzhakov, et al., Phys.Lett. B 678, 181 (2009).
- (30) A.V. Derbin, A.I. Egorov, I.A. Mitropol sky, V.N. Muratova, D.A. Semenov, E.V. Unzhakov, Eur. Phys. J. C62, 755 (2009).
- (31) M.Altmann, Y. Declais, F. v. Feilitzsch, et al., Z. Phys.C 68, 221 (1995).
- (32) H. M. Chang et al. (Texono Collab.), Phys. Rev. D75,052004 (2007).
- (33) G. Bellini et al. (Borexino Collab.), Eur. Phys. J. C 54, 61 (2008).
- (34) A. V. Derbin, A. S. Kayunov, and V.N. Muratova, Bull. Russ. Acad. Sci.: Phys. 74, 805 (2010);
- (35) G. Bellini et al. (Borexino Collab.), Phys. Rev. D 85, 092003 (2012).
- (36) A. Konaka, K. Imai, H. Kobayashi, et al., Phys. Rev.Lett. 57, 659(1986).
- (37) J. D. Bjorken, S. Ecklund, W. R. Nelson, et al., Phys.Rev. D 38, 3375 (1988).
- (38) S. Asai, S. Orito, K. Yoshimura,and T. Haga, Phys. Rev.Lett. 66, 2440 (1991).
- (39) C. E. Aalseth et al. (CoGeNT Collab.), Phys. Rev. Lett.101, 251301 (2008).
- (40) Z. Ahmed et al. (CDMS Collab.), Phys. Rev. Lett. 103, 141802 (2009).
- (41) G. G. Raffelt, Lect. Notes Phys. 741, 51 (2008).