Antiferrodistortive phase transition in EuTiO3
Abstract
X-ray diffraction, dynamical mechanical analysis and infrared reflectivity studies revealed an antiferrodistortive phase transition in EuTiO3 ceramics. Near 300 K the perovskite structure changes from cubic to tetragonal due to antiphase tilting of oxygen octahedra along the c axis ( in Glazer notation). The phase transition is analogous to SrTiO3. However, some ceramics as well as single crystals of EuTiO3 show different infrared reflectivity spectra bringing evidence of a different crystal structure. In such samples electron diffraction revealed an incommensurate tetragonal structure with modulation wavevector q 0.38 a∗. Extra phonons in samples with modulated structure are activated in the IR spectra due to folding of the Brillouin zone. We propose that defects like Eu3+ and oxygen vacancies strongly influence the temperature of the phase transition to antiferrodistortive phase as well as the tendency to incommensurate modulation in EuTiO3.
pacs:
75.80.+q; 78.30.-j; 63.20.-eI Introduction
EuTiO3 is a frequently investigated material in the last decade thanks to Katsufuji and Takagi,katsufuji01 who discovered a strong magnetodielectric effect in antiferromagnetic (AFM) G-type phaseguire66 of this material below TN = 5.3 K. 7% change of permittivity with magnetic field was found at 2 K. Linear magnetoelectric coupling is forbidden in EuTiO3 due to centrosymmetric structure of this material. Quadratic coupling was not detected, but a strong third-order (bielectrobimagnetic ) magnetoelectric coupling was observed in Ref.shvartsman10 . Dielectric permittivity ’ exhibits a typical incipient ferroelectric behavior: ’ increases on cooling and saturates below 50 K.katsufuji01 This temperature behavior was explained by an optical phonon softening on cooling and by saturation of its frequency at low temperatures.kamba07 ; goian09 Both temperature dependences of ’ and soft phonon frequency follow the Barrett formula,kamba07 ; goian09 which takes into account quantum fluctuations at low temperatures. ’ drops down below TN by several percents due to a strong spin-phonon coupling.katsufuji01 In AFM phase the temperature and magnetic field dependence of ’ is caused by the response of the lowest-frequency phonon to the magnetic order and/or magnetic field.kamba12
Fennie and Rabefennie06 suggested to use the spin-phonon coupling and a biaxial strain in the thin EuTiO3 films for induction of ferroelectric and ferromagnetic order, although the bulk EuTiO3 is quantum paraelectric and antiferromagnetic. Recently, Lee et al.lee10 actually confirmed the theoretical prediction and revealed ferroelectric and ferromagnetic order in the tensile strained EuTiO3 thin films deposited on DyScO3 substrates. The possibility of inducing the ferroelectric and ferromagnetic order in strained thin films of materials, which are paraelectric and AFM in the bulk form, opens a new route for preparation of novel multiferroics with a strong magnetoelectric coupling and with high critical ordering temperatures. Very promising candidates are SrMnO3,lee10b EuObousquet10 and Ca3Mn2O7.benedek11
Until recently it was assumed that bulk EuTiO3 has perovskite structure with cubic space groupbrous53 and that the structure is stable down to liquid He temperatures. However, Rushchanskii et al.rushchanskii10 ; rushchanskii12 theoretically investigated the structural and lattice dynamical properties of EuTiO3 using first principles and revealed unstable phonons at the R () and M () points of the Brillouin zone (BZ) in the cubic structure. Calculated eigenvectors indicated that the instabilities are non-polar and arise from the tilting and rotation of the oxygen octahedra. The eigenvectors for the M-point instable phonon show in-phase rotations of the oxygen octahedra around one or more pseudocubic axes, whereas at the R point the octahedra rotate with an alternating out-of-phase sense.rushchanskii12 Total energy of the possible distorted phases were calculated and three possible stable structures with , and space group were suggested. The most stable structure should be ( tilts in Glazer notation), second stable structure could be () and the third one the structure (). However, the energy differences between all the structures are very small (within 2 meV per formula units), which were within the range of numerical errors. Therefore all the above mentioned structures could be realistic and the structural verification is needed. Very recent specific heat anomaly measurements revealed an anomaly near 280 K, but the symmetry of the low-temperature structure was not determined.Bussmann-Holder11 Allieta et al.allieta12 found the structural phase transition at 235 K and determined the low-temperature structure as tetragonal . In this paper we will show that critical temperature (Tc) of the antiferrodistortive phase transition strongly depends on a quality of the EuTiO3 samples. X-ray diffraction (XRD) and dynamical mechanical analysis of the best EuTiO3 ceramics reveals Tc=308 K, but XRD of single crystal does not resolve the tetragonal symmetry down to 100 K. On other hand the electron diffraction reveals tetragonal structure and moreover an incommensurate modulation in single crystal already at room temperature. The reasons for such peculiar effects will be discussed in details.
II Experimental
We have investigated single crystals and two kinds of ceramics obtained by different methods. At the beginning the EuTiO3 powder was prepared from Eu2O3 and Ti2O3 powders. The initial powder was pelletized and sintered at 1400 oC for 2 hours in a pure hydrogen atmosphere. Relative density of such prepared A ceramics was 89% of the theoretical one. Details of the A ceramic preparation are described elsewhere.kachlik12 Ceramics B were prepared from exactly the same EuTiO3 powder as the ceramics A, but the powder was loaded into Au capsules and sintered in a belt-type high-temperature high-pressure furnace at 900 ∘C under a pressure of 6 GPa for 30 min. Density of the ceramics B was more than 95%.
Single crystals were prepared in two steps. Firstly, a mixture of stoichiometric amounts of Eu2O3 (99.9 % purity; Metall Rare Earth Limited) and TiO2 (99 - 100.5 %; Sigma-Aldrich) was ball-milled and sintered for 10 hours at 1273 K under reducing atmosphere (flowing mixture of 5 % H2 in Ar2, 100 ml/min). The resulting phase was cubic-perovskite with a = 3.905 Å. Secondly, the milled powder was pressed into rods with 7 mm diameter and annealed for further 10 hours under the same atmosphere. The crystals were grown under flowing mixture of 5 % H2 in Ar (150 ml/min) by using a floating-zone furnace equipped with four halogen lamps (maximum power of 1500 W) and ellipsoidal mirrors. The obtained black crystals after polishing were porosity free with mirror quality surface. However, the crystals were not perfect, they exhibited mosaicity in the mm range size. One crystal was grinded for powder X-ray and electron diffraction studies after dielectric, magnetic and infrared (IR) measurements. For IR studies the crystal with the size of 3x3x0.15 mm3 was generally oriented with [001] axis tilted approximately 30∘ from the sample normal plane. Therefore the IR spectra were taken without a polarizer (polarized IR spectra did not show any anisotropy).
The X-ray diffraction studies of ceramics were performed using a Bruker D8 Discover equipped with rotating Cu anode ((Cu)=1.540598 Å; (Cu)=1.544426 Å) working with 12 kW power. Parabolic Göbel mirror was located on the side of the incident beam. Analyzer slits and alternatively also analyzer crystal (200 - LiF) were on the side of the diffracted beam. The temperature was controlled by cooling stage Anton Paar DCS 350. The temperature was changed from 173 K to 373 K. The X-ray / diffractograms were measured in the broad range of 2 angles from 25 till 135 ∘ at 193, 293 and 333 K. These whole scans were used for space group determination and for Rietveld refinement with program Topas.topas Although the analyzer crystal reduces the intensity, it significantly improves the resolution. Thus, it was used for detailed study of the 310 and 420 diffraction peaks (using cubic indexes) that were measured almost each 10 K between 173 and 373 K. Below 300 K, the Rietveld refinements of these two diffraction peaks were performed in space group, because the Rwp factor was noticeably lower than in space group. The fixed microstructure parameters provide precise values of lattice parameters that were used for calculation of the oxygen octahedra tilting angle :mitchell02
| (1) |
X-ray diffraction studies of EuTiO3 single crystal were performed with four-circle kappa diffractometer Gemini of Oxford Diffraction (now Agilent Technologies), equipped with CCD detector Atlas. Because of large absorption of the sample we used MoK radiation with doublet, =0.7107 Å, monochromatized with a graphite monochromator and collimated with a fibre-optics Mo-Enhance collimator of Oxford Diffraction. The temperature was controlled with an open-flow cooler Cryojet HT of Oxford Instruments, which uses nitrogen gas as a cooling/heating medium. The measurements were performed at 300 and 100 K.
Electron diffraction patterns were collected at room temperature using transmission electron microscope Philips CM120 equipped with CCD camera Olympus Veleta with 14 bit dynamical range. Crystals of around 500 nm size were investigated. A tilt series of diffraction patterns was recorded ranging from -50∘ to +50∘ in steps of 0.5∘. This technique is known as electron diffraction tomography.gorelik11 Its main advantages are that it is very fast, does not require the cumbersome procedure of orienting the crystal along some special zone axis, and grant access to a full 3D intensity distribution in reciprocal space. Oriented reciprocal-space sections were then reconstructed from the raw data by the computer program PETS. palatinus
The Young’s modulus and thermal expansion were measured using the instrument for Dynamical Mechanical Analysis (DMA 7 - Perkin Elmer). The parallel-plate-method, described in details elsewhere,kityk96 was used. The sample dimensions of the parallelepiped were 2.961x0.922x0.745 mm3. A static force of 750 mN was modulated by a dynamic force of 700 mN with a frequency of 1 Hz. Nitrogen was used as purge gas.
Low-frequency (1 kHz - 1 MHz) dielectric measurements were performed between 2 and 300 K using NOVOCONTROL Alpha-A High Performance Frequency Analyzer. Magnetic susceptibility data were obtained using a Quantum Design PPMS9.
The IR reflectivity spectra were taken using a Bruker IFS 113v FTIR spectrometer at temperatures from 10 to 300 K with the resolution of 2. An Optistat CF cryostat (Oxford Instruments) was used for cooling the samples. The investigated spectral range (up to 650) was limited by the transparency region of the polyethylene windows of the cryostat. A helium-cooled Si bolometer operating at 1.6 K was used as a detector. Room-temperature reflectivity was measured up to 3000 using pyroelectric deuterated triglicine sulfate detector.
IR reflectivity spectra were carefully fitted assuming the dielectric function in the factorized form of generalized damped harmonic oscillatorsgervais83
| (2) |
where and denote the transverse and longitudinal frequency of the j-th polar phonon, respectively, and TOj and LOj denote their corresponding damping constants. ∗() is related to the reflectivity R() of the bulk substrate by
| (3) |
The high-frequency permittivity = 5.88 resulting from the electronic absorption processes was obtained from the room-temperature frequency-independent reflectivity tails above the phonon frequencies and was assumed to be temperature independent.
III Results
III.1 Structural and elastic properties of the A ceramics
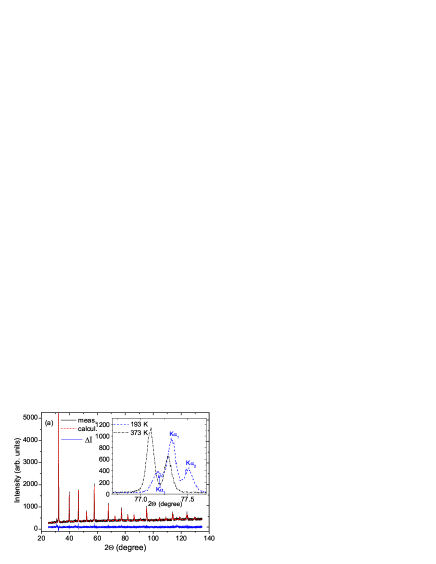
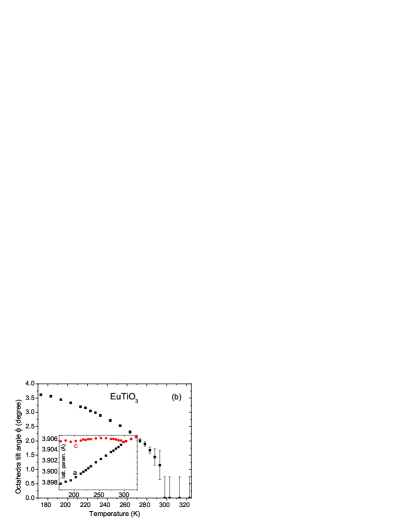
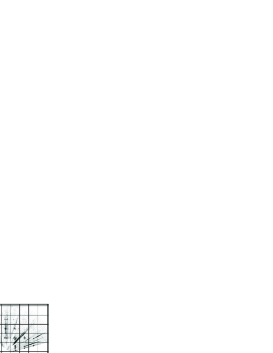
Above room temperature the X-ray diffraction (see Fig. 1a) confirms cubic structure, which is in complete agreement with Ref. brous53 . Below 300 K the structure was refined in space group, because Rwp factor was noticeably reduced in this structure. For example at 273 K Rwp was 9.12 and 12.90 in tetragonal and cubic structure, respectively. Tetragonal structure is obtained by an anti-phase tilting of oxygen octahedra along the c axis ( in Glazerglazer74 notation). The structure models in and space groups were rejected, because of discernible discrepancies in the Rietveld refinements. Due to the tetragonal distortion the lattice parameter splits (see inset of Fig. 1b). The low-temperature value of the splitting is comparable to the theoretical value in Ref. rushchanskii12 . Allieta et al. observed the phase transition only at 235 K, but they obtained comparable lattice parameter splitting 130 K below Tc as we, just their lattice parameters were systematically 0.003 smaller than ours. The temperature dependence of the part of the diffraction pattern close to the 310 reflection is shown in the inset of Fig. 1a. It is a doublet at high temperatures due to the K lines of Cu, which splits on cooling due to the antiferrodistortive transition. It allowed us to determine the temperature dependence of the tilting angle from the c axis (Fig. 1b). One can see that the antiferrodistortive phase transition arises between 295 and 320 K and the tilt angle reaches a value of 3.6∘ at 173 K. The precision of lattice parameters determination was around 0.0001 Å. For very close and lattice parameters it leads to relatively big errors in the determination of , see equation (1). For these reasons the error bars near and above 300 K in Fig. 1b are large. At low temperatures the accuracy of the tilt angle determination is much higher and the error bars are smaller than the dots.
We checked the structure also by electron diffraction on small single-crystalline grains obtained by grinding of A ceramics. The electron diffraction pattern taken at 295 K contains weak spots at the position h+,k+,l+ (see Fig. 2). It confirms tetragonal distortion in ceramics A at room temperature.

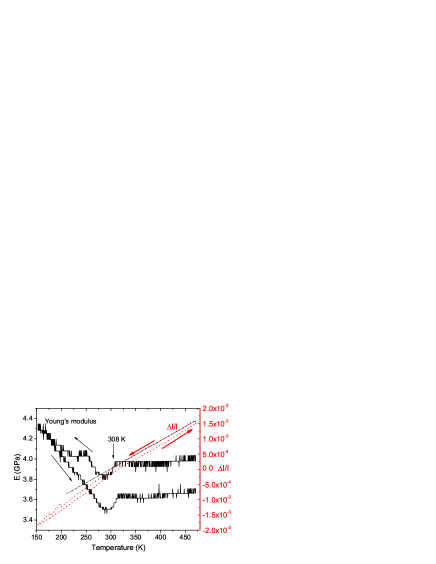
The existence of a structural phase transition was confirmed also by other methods. In Fig. 3 we show the temperature dependencies of the thermal expansion and Young’s modulus. The curves were systematically measured first on cooling and then on heating. As Fig. 3 shows the thermal expansion depends linearly on temperature above and below 308 K, indicating that the phase transition at 308 K is of second order. Similar as e.g. for SrTiO3 kityk00 or KMnF3 schranz09 the thermal expansion in EuTiO3 is caused by the coupling term which is quadratic in the order parameter and linear in the strain in a Landau Free energy expansion, implying for the spontaneous strain to be proportional to the square of the order parameter , i.e. for a second order phase transition. This is also consistent with the observed anomaly in the Young s modulus, which displays a negative dip at followed by a linear increase with decreasing temperature. To describe the elastic anomaly in EuTiO3 we can similarly to SrTiO3 kityk00 employ the leading coupling terms , which leads to
| (4) |
in perfect agreement with observed behavior (Fig. 3).
Similar DMA experiments were performed on several EuTiO3 ceramics as well as on ceramics with some pyrochlore or amorphous impurities (all samples prepared by the A method). The phase transition was always observed, but its temperature was reduced in dependence of the impurity concentration. Maximal shift down of the critical temperature was 60 K in samples with 2% of pyrochlore impurities. Such a low phase transition temperature has been very recently reported by Allieta et al.allieta12 . In the high resolution synchrotron X-ray powder diffraction they found a signature of the phase transition in EuTiO3 at 235 K. Influence of defects on structural properties of EuTiO3 will be discussed in details in the next paragraph.
III.2 X-ray diffraction studies of the B ceramics
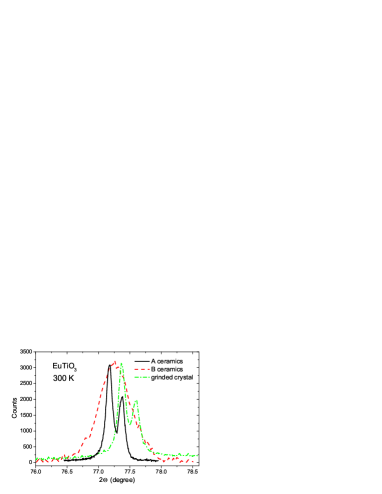
The B ceramics was sintered at 900 ∘C (and at pressure 6 GPa) while the A ceramics was sintered at 1400 ∘C (and at ambient pressure). For that reason smaller crystallite size and larger microstrain (i.e. fluctuation of lattice parameters) is expected in the B ceramics. In Fig.4 is compared 310 diffraction peak of A and B ceramics together with grinded single crystal. One can see that the diffraction of the B ceramics is very broad and therefore does not allow to resolve the K and K splitting. From the width of the diffraction we determined the crystallite size 40 nm and microstrain 0.2%, while in the A ceramics we obtained the crystallite size 90 nm and microstrain 0.03%. Due to large width of diffraction peaks no structural phase transition could be resolved in the B ceramics down to 100 K. However, we will show below, that IR spectra give evidence about lower than cubic structure in the B ceramics at all temperatures below 300 K.
III.3 X-ray and electron diffraction studies of EuTiO3 single crystal
Two small single crystals broken from one larger piece were used for the X-ray diffraction studies. Right-angle triangle with sides 0.2 mm and thickness 0.08 mm showed two grains, while the triangular-shaped sample with sides 0.7 mm and thickness 0.2 mm contained 9 single-crystal grains. Within its accuracy and sensitivity, the laboratory single-crystal X-ray diffraction experiment did not reveal any tetragonal distortion or presence of additional spots, as observed in the A ceramics. The cell parameters determined at 100 K were a=3.89114(11) Å, b=3.89144(11) Å, c=3.89117(10)Å, =89.984(2)∘, =90.017(2)∘, =89.984(2)∘ The structure was therefore refined in a cubic space group, yielding R value 0.85% for 74 observed symmetry independent reflection, with goodness of fit 1.07. Important for successful structure refinement was correction for exceptionally strong extinction. Many spots, which could be explained by a doubling of the unit cell in the antiferrodistortive phase, were observed, but finally explained by /2 diffraction. After decreasing the voltage on the Mo X-ray tube below the /2 generation limit, i.e. below 34 kV, no such satellite appeared although the loss of intensity due to the decrease of the voltage was fully compensated by increasing mA rate and the exposition time.
The second larger crystal was grinded two hours after the X-ray measurements at 100 K and a selected grain of the powder was used for electron diffraction at room temperature. The diffraction pattern (see Fig. 5) reveals weak reflections at positions h+,k+,l+, which are evidence for tetragonally distorted phase like in the ceramics A. Moreover, the satellites around these positions are clearly seen in Fig. 5. The satellites show that the structure is incommensurately modulated with modulation wavevector qm = (0.38 0.02) a∗.
We repeated the electron diffraction measurements on the same sample two weeks later. No reflections at positions h+,k+,l+ and as well as no incommensurate satellites were observed. The crystal lattice looked cubic. Very recent synchrotron study of Kim et al.kim12 revealed creation of incommensurate structure in EuTiO3 crystal at 285 K and the tetragonal distortion appeared only below 160 K. The incommensurate phase transition is of the first order, therefore it can exhibit some temperature hysteresis. Our first electron diffraction pattern was taken only two hours after cooling to 100 K, therefore we observed the tetragonal distortion and incommensurate modulation at room temperature. After some time the crystal structure transforms to cubic one at 300 K. We observed temperature hysteresis in tilt angle of oxygen octahedra as well as in Tc with value of 30-50 K also in the A ceramics.
Our modulation wavevector qm = 0.38 a∗ is smaller than the value 0.43 a∗ reported by Kim et al.kim12 , but Kim et al. have also shown that the incommensurate satellites are strongly time dependent (their position and intensity strongly relaxed within measured 17 hours). The time and possible temperature dependence of the modulation wavevector is probably responsible for the discrepancy between ours and Kim’s value of qm.
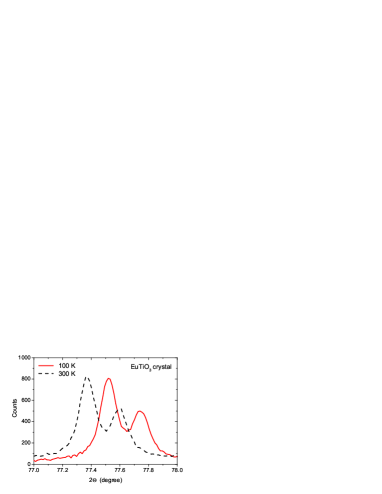
Nevertheless, the discrepancy between data obtained using XRD of macroscopic crystal and electron diffraction of the same grinded crystal are remarkable and one could speculate about lower sensitivity of the former method. Therefore we have decided to use the same grinded crystal for powder X-ray diffraction measurements. The results were rather surprising (see Figs. 4 and 6): a) The room-temperature lattice constant of the crystal (a=3.8966(5) Å) is lower than in the A ceramics (a=3.9058(5) Å). b) Diffraction peaks (like 310 in Fig. 6) do not broaden or split on cooling down to 100 K. It means the lattice of the crystal looks cubic down to 100 K. Note the electron diffraction revealed the incommensurate satellites and tetragonal distortion in grinded single crystal already at room temperature (after cooling to 100 K). Electrons interact much stronger with the crystal than X-rays, and the weak intensities can be also enhanced by the dynamical diffraction effects. This could explain the discrepancy between both kinds of experiments. Here should be again stressed that the recent X-ray synchrotron investigation of EuTiO3 single crystal, which has the same origin as ours, revealed the tetragonal distortion below 160 K and incommensurate modulation below 285 K.kim12
One can also ask the question, whether the discrepancies between XRD and electron diffraction of the crystals cannot be caused by stresses created after grinding of the crystals. It is unlikely that such manipulation would alter the crystal structure. Also, if the material was affected by the crushing, the diffraction pattern would probably show streaking and loss of crystallinity. Moreover, the structure would be most probably different from one grain to another, but we observed the same electron diffraction patterns in three examined crystals. We proved that the material relaxed to its cubic form without satellites in two weeks after the first experiment, indicating strongly a temperature hysteresis.
We tried to see the phase transitions in specific heat of the samples. Unfortunately, we did not detect any anomaly. Our differential scanning calorimeter Perkin Elmer Pyris Diamond has probably lower sensitivity than the instrument used in Ref. Bussmann-Holder11
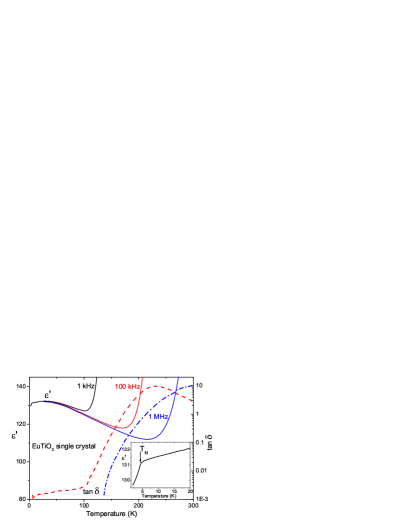
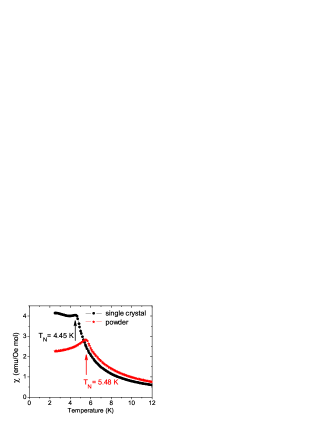
Not only structural but also dielectric and magnetic properties differentiate in various samples. A ceramics has at low temperatures permittivity about 400 (like single crystal in Ref. katsufuji01 ), B ceramics about 200 and the single crystal less than 140 (see Fig. 7). The resistivity was highest in the single crystal, which allowed to measure intrinsic dielectric permittivity at 1 MHz up to 200 K (Fig. 7), while in the A ceramics permittivity was affected by Maxwell-Wagner polarization already above 80 K.kamba07 We measured as well magnetic susceptibility and found TN = 4.45 K in single crystal, and TN=5.48 K in the EuTiO3 ceramics and powder, from which the crystal was grown (see Fig. 8). The latter value corresponds to the value reported in the literature. katsufuji01 ; guire66 ; kamba07 The reason for lower TN in single crystal is discussed below.
Our A ceramics exhibits the antiferrodistortive phase transition to tetragonal structure at 300 K, Köhler et al. reported Tc = 282 K,Bussmann-Holder11 ; kohler12 , Allieta et al. found Tc =235 K,allieta12 and Kim et al. at 160 K. All the discrepancies in critical temperatures (as well as in above mentioned dielectric and magnetic properties) observed in different samples can be explained only by a different concentration of defects (mainly oxygen vacancies and Eu3+). It is known that the oxygen vacancies enhance the lattice constant in isostructural SrTiO3. gong91 On other hand, ionic radius of Eu3+ is smaller than ionic radius of Eu2+,jia91 so the Eu3+ defects can reduce the lattice constant in Eu2+TiO3. One can expect that both kinds of defects are mutually connected. Oxygen vacancies can strongly influence the lattice instability to tetragonal phase, where the oxygen octahedral exhibit antiphase tilting. Note as well that Allieta et al.allieta12 observed local fluctuations of the tilt angle, which can be explained by fluctuation of oxygen vacancy concentration. On other hand the Eu3+ can also reduce the Néel temperature in EuTiO3. It can explain aforementioned 1 K lower TN in single crystal than in the ceramics. For that reason it seems that the EuTiO3 crystal contains more Eu3+ defects than the A and B ceramics. Exact determination of concentration of Eu3+ and oxygen vacancies using Mössbauer spectroscopy and positron annihilation spectroscopy, respectively, is beyond the scope of this paper, but these experiments are already in progress in our lab.
III.4 Factor-group analysis
As it was already mentioned above, Rushchanskii et al.rushchanskii12 predicted three possible space groups, in which EuTiO3 could crystallize at low temperatures. Structural analysis can yield sometimes ambiguous results and IR spectra can help in specification of the crystal structure. Before presenting the IR spectra, we perform the factor group analysis of the optical phonons (i.e. without acoustic modes) in all suggested crystal structures of EuTiO3. In cubic structure the analysis gives the following symmetries of phonons in the -point of BZ:
| (5) |
in bracket means activity in the IR spectra, (-) marks the silent mode. The factor-group analysis in antiferrodistortive tetragonal phase gives the following:
| (6) | |||||
Here etc. mean the components of Raman tensor, where the modes are Raman active. It follows from the analysis that eight polar phonons are expected in IR spectra of tetragonal EuTiO3. Their theoretical frequencies and oscillator strengths are listed in Table 1. In the orthorhombic phase the factor group analysis yields
while in rhombohedral phase the optical phonons have the following symmetry in the center of BZ:
It means that 13 and 8 IR active phonons are expected in the orthorhombic and rhombohedral phase of EuTiO3, respectively. Let us compare the experimentally observed phonons in various EuTiO3 ceramics and single crystals with the predicted selection rules mentioned above.
III.5 IR studies
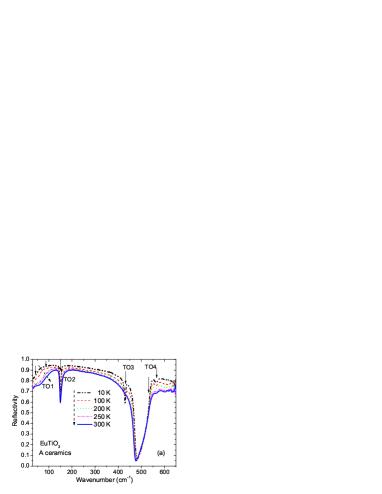
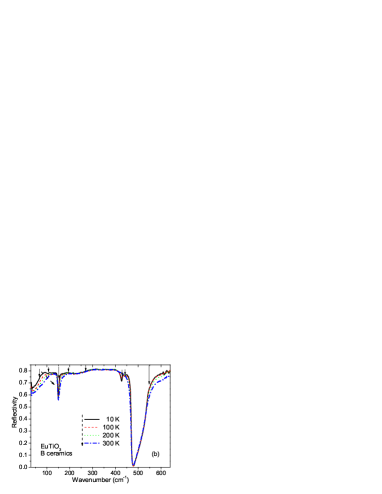
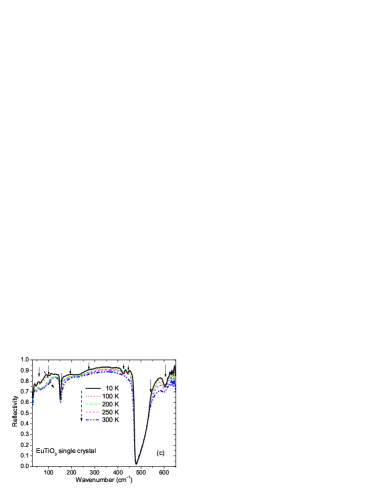
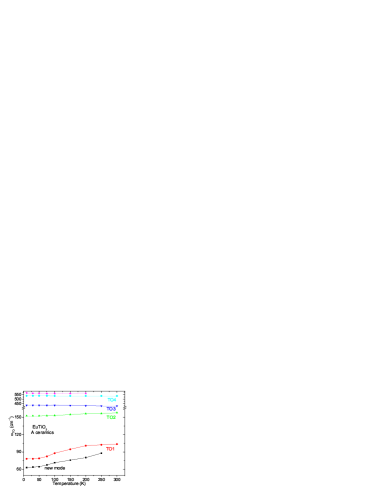
Fig. 9 compares the IR reflectivity spectra of the A and B EuTiO3 ceramics with the spectra of a single crystal. Note the similarity between the B ceramics and the single crystal, while the A ceramics has different spectra. Shape of IR spectra of the A ceramics is similar to the previously published spectra.kamba07 ; goian09 At room temperature three reflection bands marked as TO1, TO2 and TO4 correspond to 3 symmetry modes of the cubic structure (see Eq. 5). However, at low temperatures TO1 and TO4 modes split and moreover additional new mode activates in the spectra near 430 (see Figs. 9 and 10). Hints of these new modes we observed already in Ref. kamba07 , but that time we interpreted them as impurity modes from the pyrochlore Eu2Ti2O7 second phase. However, our new spectra obtained from phase pure EuTiO3 A ceramics show the new modes with even higher intensities. Moreover, as we know that the structure of the A ceramics is tetragonal below 300 K, the IR selection rules must be changed (see Eq. 6). All TO modes should be split and, moreover, two new Eu symmetry modes should be activated. The new sharp mode seen near 430 comes from a silent TO3 mode (originally of symmetry in the cubic phase) and it has the symmetry in tetragonal phase (see Eq. 6). Another polar mode should be activated around 250,rushchanskii12 , but its theoretical strength is one order of magnitude lower than that of the other modes (see Table 1). For this reason the mode is not resolved in our spectra.
Phonon eigenfrequencies and mode plasma frequencies of the observed polar phonons in all investigated samples are listed in Table 1. These experimental parameters are compared with theoretical values obtained from first principlesrushchanskii12 in tetragonal, orthorhombic and cubic structure. If we neglect a small theoretical splitting of TO2 mode, which lies below our spectroscopic resolution, very good agreement of the experimental phonon parameters in the A ceramics and theoretical parameters in the tetragonal structure was obtained.
TO1 phonon splitting was resolved at 250 K i.e. 50 K below TC (see Fig. 10), because the order parameter slowly increases on cooling below TC. The order parameter exhibits the same temperature dependence as the tilt angle in Fig. 1b. The new mode has a lower frequency than the original one and softens down to 60 (see Fig. 10). This new mode was not mentioned in previous publications,kamba07 ; goian09 because just a small hint was seen in the IR reflectivity band near 90 (Fig. 9a). However, if the TO1 mode is fitted with one oscillator only, its damping increases on cooling,goian09 which is not physically meaningful. In our two-component fit of the TO1 band, both phonon dampings decrease on cooling, which is reasonable.
TO3 mode is seen like a reflectivity minimum near 430 (see Fig. 9a) mainly at low temperature, but the reflectivity fits needs this mode at all temperatures up to room temperature. Only the damping of this mode is significantly enhanced at high temperatures, therefore no clear minimum (just sagging) is seen in reflectivity near 430 close to room temperature. It supports our results in paragraph A that the A ceramics crystallizes in tetragonal structure already at 300 K.
The B ceramics and single crystal exhibit a very similar IR reflectivity spectra, but different than the A ceramics (see Fig. 9). All together 9 modes were observed in the single crystal spectra. In comparison to the A ceramics, two additional phonon bands are seen in single crystal between 200 and 270 (manifested by bending of reflectivity around 230). Moreover, a doublet (instead of a singlet in the A ceramics) arises below 450 at low temperatures. Their frequencies correspond well to IR active phonons obtained theoretically in the orthorhombic structure rushchanskii12 (see also Table 1). Kim et al.kim12 claim, based on their X-ray synchrotron data, that the structure locally fluctuates between antiferrodistortive and antiferroelectric structure, so one can expect lower than tetragonal symmetry. Our X-ray and electron diffractions do not support the orthorhombic structure, but one should admit, that our electron diffraction measurement was not performed below room temperature. Nevertheless, the additional polar phonons seen in the B ceramics and single crystal can be activated due to incommensurately modulated structure. In such structure the translation symmetry is broken and the phonon density of states is activated in the IR spectra. In first approximation newly activated modes are mainly the phonons with the modulation wavevector qm.petzelt81 One can see that the finger-print of the modulated structure is the activation of two phonons between 200 and 270, which is clearly seen in single crystal and the B ceramics. Also the splitting of TO3 modes is resolved in both samples at low temperatures. TO1 and TO4 modes are split in all samples already due to tetragonal distortion. We note that IR spectroscopy is very sensitive on small local breaking of symmetry, which is sometimes hardly resolved in X-ray and electron diffraction experiments.
| Mode | A ceramics | structure | B ceramics | structure | Single crystal | structure | |||||||
|---|---|---|---|---|---|---|---|---|---|---|---|---|---|
| assignment | experiment | theory | experiment | theory | experiment | theory | |||||||
| TO1 | 63 | 1162 | 107 | 1323 | 82 | 1290 | 98 | 1318 | 81 | 742 | 67 | 1289 | |
| TO1 | 78 | 871 | 128 | 1607 | 107 | 713 | 110 | 1233 | 92 | 1211 | |||
| 131 | 1596 | ||||||||||||
| TO2 | 153 | 329 | 154 | 898 | 154 | 473 | 154 | 822 | 156 | 470 | 155 | 925 | |
| TO2 | 156 | 314 | 155 | 201 | |||||||||
| 159 | 945 | ||||||||||||
| 220 | 82 | 237 | 134 | 200 | 123 | ||||||||
| 251 | 40 | 277 | 240 | 283 | 122 | 249 | 374 | ||||||
| TO3 | 433 | 130 | 416 | 224 | 432 | 61 | |||||||
| TO3 | 431 | 348 | 419 | 250 | 442 | 99 | 418 | 230 | 443 | 42 | |||
| 516 | 730 | ||||||||||||
| TO4 | 537 | 591 | 523 | 732 | 546 | 672 | 523 | 736 | 541 | 617 | 537 | 824 | |
| TO4 | 570 | 228 | 531 | 718 | 600 | 63 | 537 | 725 | 596 | 103 | |||
Rushchanskii et al.rushchanskii12 performed the theoretical analysis of all possible structures in EuTiO3 and came to the conclusion that this material has three different possible ground states with very similar energies. Our structural and infrared investigations confirmed a tetragonal structure in the A ceramics prepared by the conventional method. Single crystals exhibit tetragonal distortion and moreover an incommensurate modulation. Small crystallites and large internal microstrain in the B ceramics prepared using high-pressure high-temperature sintering did not allow to resolve the tetragonal or incommensurate structure, but according to IR spectra, the structure is the same as in the single crystals. Different structural, infrared, dielectric and magnetic properties of ceramics and single crystals as well as spread of published phase transition temperatures to tetragonal phase give evidence for a high sensitivity of physical and structural properties of EuTiO3 on concentration of defects in the samples.
IV Conclusion
Until recently it was assumed that EuTiO3 crystallizes in a stable cubic structure. Our XRD, electron diffraction as well as Young’s modulus and thermal dilatation studies of conventionally prepared EuTiO3 ceramics (marked as A ceramics) reveal the antiferrodistortive phase transition to tetragonal phase already near 300 K. It is formed by an antiphase tilting of oxygen octahedra along the c axis ( in Glazer notation). This type of the phase transition, which is the same as in SrTiO3, was very recently confirmed also by other authors, but at different temperatures from 160 to 282 K.allieta12 ; kim12 ; kohler12 Careful XRD measurements of single crystal as well as grinded crystal did not reveal the tetragonal distortion down to 100 K. On other hand, electron diffraction of the same grinded crystal, performed at room temperature just after cooling down to 100 K, revealed not only tetragonal but also incommensurate structure, which disappeared after several days. This fact was explained by incommensurate phase transition at 285 K observed very recently by Kim et al.kim12 , because this first order phase transition can exhibit a temperature hysteresis. We propose to explain the observed discrepancies in structural, infrared, dielectric and magnetic behavior of ceramics and single crystals as well as various reported critical temperatures by various concentration of Eu3+ defects and oxygen vacancies. Their determination using positron annihilation and Mössbauer spectroscopy are currently in progress.
Acknowledgements.
This work was supported by the Czech Science Foundation (Project No. P204/12/1163), MŠMT (COST MP0904 projects LD12026 and LD11035), Project Praemium Academiae of ASCR and the Austrian Science Found (FWF Project No. P23982-N20).References
- (1) T. Katsufuji and H. Takagi, Phys. Rev. B 64, 054415 (2001).
- (2) T.R. McGuire, M.W. Shafer, R.J. Joenk, H.A. Alperin, and S.J. Pickart, J. Appl. Phys. 37, 981 (1966).
- (3) V.V. Shvartsman, P. Borisov, W. Kleemann, S. Kamba, T. Katsufuji, Phys. Rev. B 81, 064426 (2010).
- (4) S. Kamba, D. Nuzhnyy, P. Vaněk, M. Savinov, K. Knížek, Z. Shen, E. Šantavá, K. Maca, M. Sadowski and J. Petzelt, Eur. Phys. Lett. 80, 27002 (2007).
- (5) V. Goian, S. Kamba, J. Hlinka, P. Vaněk, A.A. Belik, T. Kolodizhnyi, and J. Petzelt, J. Eur. Phys. B., 71, 429 (2009).
- (6) S. Kamba, V. Goian, M. Orlita, D. Nuzhnyy, J.H. Lee, D.G. Schlom, K.Z. Rushchanskii, M. Ležaić, T. Birol, C.J. Fennie, P. Gemeiner, B. Dkhil, V. Bovtun, M. Kempa, J. Hlinka, and J. Petzelt, Phys. Rev. B 85, 094435 (2012).
- (7) C.J. Fennie and K. M. Rabe, Phys. Rev. Lett. 97, 267602 (2006).
- (8) J.H. Lee, L. Fang, E. Vlahos, X. Ke, Y.W. Jung, L. Fitting Kourkoutis, J.W. Kim, P.J. Ryan, T. Heeg, M. Roeckerath, V. Goian, M. Bernhagen, R. Uecker, P.C. Hammel, K.M. Rabe, S. Kamba, J. Schubert, J.W. Freeland, D.A. Muller, C.J. Fennie, P.E. Schiffer, V. Gopalan, E. Johnston-Halperin, and D.G. Schlom, Nature, 466, 954 (2010); ibid 476, 114 (2011).
- (9) J.H. Lee and K.M. Rabe Phys. Rev. Lett. 104, 207204 (2010.)
- (10) E. Bousquet, N.A. Spaldin, P. Ghosez, Phys. Rev. Lett. 104, 037601 (2010).
- (11) N.A. Benedek and C.J. Fennie, Phys. Rev. Lett. 106, 107204 (2011).
- (12) J. Brous, I. Fankuchen, E. Banks, Acta Crystallographica 6, 67 (1953)
- (13) K.Z. Rushchanskii, S. Kamba, V. Goian, P. Vaněk, M. Savinov, J. Prokleška, D. Nuzhnyy, K. Knížek, F. Laufek, S. Eckel, S.K. Lamoreaux, A.O. Sushkov, M. Ležaić, Nature Materials, 9, 649 (2010).
- (14) K.Z. Rushchanskii, N.A. Spaldin and M. Ležaić, Phys. Rev. B. 85, 104109 (2012).
- (15) A. Bussmann-Holder, J. Köhler, R.K. Kremer, and J.M. Law, Phys. Rev. B 83, 212102 (2011).
- (16) M. Allieta, M. Scavini, L.J. Spalek, V. Scagnoli, H.C. Walker, C. Panagopoulos, S.S. Saxena, T. Katsufuji, and C. Mazzoli, Phys. Rev. B 85, 184107.
- (17) M. Kachlík, K. Maca, V. Goian, and S. Kamba, Matt. Lett. 74, 16 (2012).
- (18) http://www.bruker-axs.de/topas.html
- (19) R.H. Mitchell: Perovskites - Modern and Ancient, Almaz Press Inc., 2002 Ontario Canada, p.23.
- (20) T.E. Gorelik, A.A. Steward, U. Kolb, J. Microscopy, 244, 325 (2011).
- (21) L. Palatinus, PETS - program for analysis of electron diffraction data, Institute of Physics of the AS CR, 2011.
- (22) A.V. Kityk, V.P. Soprunyuk, A. Fuith, W. Schranz, and H. Warhanek, Phys. Rev. B 53, 6337 (1996).
- (23) F. Gervais, in Infrared and Millimeter Waves, vol. 8, ed. K. J. Button (New York: Academic Press 1983) chapter 7, p. 279.
- (24) M. Glazer, Acta Cryst. B28, 3384 (1974).
- (25) A.V. Kityk, W. Schranz, P. Sondergeld, D. Havlik, E.K.H. Salje and J.F. Scott, Phys. Rev. B 61, 946 (2000).
- (26) W. Schranz, P. Sondergeld, A.V. Kityk and E.K.H. Salje, Phys. Rev. B 80, 094110 (2009).
- (27) J.-W. Kim, P. Thomson, S. Brown, P.S. Normile, J.A. Schlueter, A. Shkabko, A. Weidenkaff, and P.J. Ryan, arXiv:1206.5417v1.
- (28) J. Köhler, R. Dinnebier, A. Bussmann-Holder, arXiv:1205.5374v1.
- (29) W. Gong, H. Yun, Y.B. Ning, J.E. Greedan, W.R. Datars and C.V. Stager, J. Sol. St. Chem. 90, 320 (1991).
- (30) Y.G. Jia, J. Sol. St. Chem. 95, 184 (1991).
- (31) J. Petzelt, Phase Transition 2, 155 (1981).