On the origin of a highly-dispersed coherent radio burst
Abstract
We discuss the possible source of a highly-dispersed radio transient discovered in the Parkes Multi-beam Pulsar Survey (PMPS). The pulse has a dispersion meausure of , a peak flux density of mJy for the observed pulse width of ms, and a flat spectrum across a -MHz band centred on MHz. The flat spectrum suggests that the pulse did not originate from a pulsar, but is consistent with radio-emitting magnetar spectra. The non-detection of subsequent bursts constrains any possible pulsar period to s, and the pulse energy distribution to being much flatter than typical giant pulse emitting pulsars. The burst is also consistent with the radio signal theorised from an annihilating mini black hole. Extrapolating the PMPS detection rate, provides a limit of on the density of these objects. We investigate the consistency of these two scenarios, plus several other possible solutions, as potential explanations to the origin of the pulse, as well as for another transient with similar properties: the Lorimer Burst.
keywords:
pulsars: general – Galaxy: stellar content – surveys – black hole physics – cosmological parameters1 Introduction
There are many known and proposed sources of transient radio wave emission in the Universe — from well-known terrestrial, solar system and Galactic sources to a menagerie of hypothesised sources covering a broad range in terms of potential detectability and plausability. Many of the known sources recur, e.g. solar radio bursts occur every day (Nita et al., 2002) and the pulses from some radio pulsars repeat so reliably that they can be used as ‘cosmic clocks’ to detect the stochastic gravitational wave background (Hobbs et al., 2010). Some bursts however are less regular in their recurrance, and indeed several radio transients have never been observed to repeat. This latter group are of particular interest, especially as a number of the postulated sources are one-time-only events which would never repeat, and as the numbers detected should rise dramatically with the onset of the ‘all-sky transient monitoring’ capabilities of LOFAR (Stappers et al., 2011), the VLA (Perley et al., 2011), MeerKAT (Booth et al., 2009), ASKAP (Johnston et al., 2008) and ultimately the SKA (Colegate & Clarke, 2011).
The numerous radio pulsar surveys constitute a rich, and perhaps the best available, data archive for exploring the parameter space of potential radio transients — especially at millisecond to second scales. Many have never been searched for transient bursts. In one such search of the Parkes Multi-beam Pulsar Survey (PMPS, Manchester et al. (2001)), a highly-dispersed single burst of radio emission was discovered (Keane et al., 2010, 2011). This burst, which was detected, in a beam with arcmin half-power radius, in the direction of RA 18:52:05, DEC 08:29:35, i.e. l , b , is the subject of this paper. In § 2 we describe the properties of the pulse. In § 3 we consider possible solutions as to its origin. Throughout, we present the corresponding discussion for the ‘Lorimer Burst’ (LB from herein) reported by Lorimer et al. (2007). In § 4 we present our conclusions and a discussion on these matters.
2 The Pulse
The pulse in question was received in the PMPS on June 21st 2001 (MJD 52081) in observation PM0141_017A1, i.e. in beam A (the 10th beam, in the outer hexagonal ring of the receiver) in the 17th pointing recorded on survey tape 141. The observation started at 12:57:32 UTC (MJD UTC) and the pulse was detected seconds into the observation, i.e. at 13:02:10.795 UTC (MJD UTC). The Simbad astronomical database lists only 7 sources within a radius of arcmin: six are optical/IR stars, and one is an X-ray source. There are no H or HI anomalies at this position.
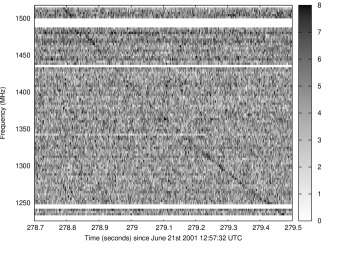
Characteristics: The pulse was detected in only one of the 13 beams of the receiver, with a peak signal-to-noise ratio (S/N) of . Figure 1 shows the pulse as a function of observing time and sky frequency. A frequency-dependent delay is evident. The dispersion measure (DM) which produces the highest S/N, when dedispersed with respect to the standard relation for a cold ionised interstellar medium , is . Testing how well such a law is obeyed by fitting for a frequency-dependent delay function which is proportional to gives . This is robust to dividing the 96-channel data into as many as 16 parts, before obtaining a time-of-arrival (using standard pulsar timing methods) at each sub-band and then fitting. For 16 sub-bands the average S/N per sub-band is . Finer frequency resolution results in unacceptably low S/N in the sub-bands.
The observed pulse width, when the data are dedispersed to MHz (the top of the band) using a DM of , is ms, (the PMPS time resolution is s). The pulse width is ms in the top half of the band (dedispersed to MHz) and ms in the bottom half of the band (dedispersed to MHz). Finer frequency resolution shows the pulse width to be constant (within the limits of what can be determined for the S/N) as a function of frequency across the entire -MHz band. The pulse is barely resolved (if at all), as the dispersive smearing time within the -MHz frequency channels is ms ( ms and ms) at the middle (bottom and top) of the band. Removing this contribution from the observed pulse width reveals that any intrinsic width, combined with any scatter broadening, amount to no more than ms. A steep power law, e.g. the Kolmogorov scenario with can be ruled out, as can the predicted scatter broadening time of ms from the empirical estimate of Bhat et al. (2004), although the latter is known to be uncertain to at least 2 orders of magnitude.
With a measure of S/N as a function of frequency, we can, with a knowledge of the sensitivity of the instrument, determine the radio spectrum of the pulse. This results in peak flux densities, for the observed pulse width, ranging from as low as to as high as mJy across the band, with a slight dip in flux density in the middle of the band (see Figure 1). Within the error in this estimation (expected to be at least ) and the limits of the available S/N, this is consistent with a flat spectrum. Another factor, potentially the dominant source of uncertainty, is the angular and frequency dependence of the telescope gain. The pulse is unlikely to have been detected along the central axis of the beam corresponding to maximum sensitivity, where the gain is K/Jy (Manchester et al., 2001). The beam responses are well described as Gaussian, with half-power-beam-widths (HPBWs) of arcmin at the central frequency of MHz. In addition to this angular dependence the HPBW will scale linearly with frequency so that at the top of the band, at MHz, it will be narrower than at the bottom of the band, at MHz, in proportion to the ratio of these frequencies. Clearly the spectrum of any incident astrophysical signal will be made steeper by this effect if detected off-axis. Burke-Spolaor et al. (2011) discuss empirical measurements of this effect where a positive intrinsic spectral index can appear as steep as . Thus there is an extra (perhaps very large) uncertainty in the spectrum of the source, and the spectrum is likely to be flatter than observed. Below we take the peak flux density of the pulse (at the observed pulse width) to be mJy. The intrinsic fluence, , of the -ms burst is thus:
| (1) |
Distance: The distance to the source of the pulse, whatever it may be, is uncertain. The only available estimate is to invert the relationship between DM and distance: . This requires a model of the free electron density. The current best model is NE2001 (Cordes & Lazio, 2002) which predicts that a maximum of of the DM is contributed by the Galaxy, towards the total value of . The six pulsars within a radius of two degrees of this line of sight have DMs of no more than . To estimate the distance there are two options: (i) Assume that the NE2001 model is incorrect along this line of sight, so that all of the DM contribution is due to Galactic material, and the source is then within our Galaxy at a distance of kpc (this being where the ‘Galaxy ends’ according to the NE2001 model); (ii) Take the NE2001 estimate to be correct, in which case the excess DM of would be due to the intergalactic medium and any putative host galaxy for the source. In the second scenario, repeating the analysis of Lorimer et al. (2007), an extremely large distance of Mpc results.
Re-observations: Deciding between these two possibilities is crucial as the implied luminosities, and therefore likely progenitors, depend on it. Motivated by this we performed follow-up observations using the Parkes Telescope to test the hypothesis that the source is Galactic (i.e. NE2001 is incorrect) and a pulsar which emits giant pulses (the most likely Galactic solution). In this scenario many more weaker pulses would be expected to be easily detected. We used analogue filterbanks, the same backend as was used in the original survey (Manchester et al., 2001), with -MHz and -s frequency and time resolution respectively, recording Stokes I with 1-bit digitisation. Concurrently we recorded Stokes IQUV data, with the digital filterbanks with 8-bit digitisation, with the aim of looking more closely at this data, with polarisation information, and with more dynamic range, if a second event was detected in the total intensity data. In hours of follow-up only two events were detected which were inconsistent with radiometer noise, both of which were clearly due to narrow-band radio frequency interference (RFI). No further pulses from J185208 were seen in a total of hours of observation. In the following section we investigate the implications of this.
3 Possible Solutions
Radio Frequency Interference: The strongest signals detectable by any radio telescope are often of terrestrial origin. In searches for isolated astrophysical bursts there are several steps we can follow to minimise the effects of RFI. For instance, the zero-DM subtraction technique can be used to remove broadband RFI, using the fact that it will be strongest at a DM of zero (Eatough et al., 2009). Narrow-band RFI can be removed by keeping an account of the bandpass as a function of time and excising anomolously high or variable channels. Furthermore, for pulsar surveys performed at Parkes using the 13-beam 21-cm receiver, boresight sources are not expected to appear in more than 4 beams at once. Most astrophysical signals are detected in only one beam, and many RFI signals are detected in several beams, i.e they are detected in the sidelobes of the beams’ gain patterns, so that a multi-beam coincidence test can be used to discriminate against these undesired signals. This can take the form of a post-facto comparison of detected events (Keane et al., 2010) or, as has recently been implemented by Kocz et al. (2012), a full cross-correlation of the signals from each beam. The pulse under consideration here survives all of these checks which leads us to conclude that it is astrophysical in origin. As stated in § 2 the pulse follows the theoretical dispersion law without deviation, and is detected in only one beam of the 21-cm receiver. This clearly contrasts with typical RFI signals, but also with less commonly encountered RFI signals such as the “peryton” signals (Burke-Spolaor et al., 2011; Kocz et al., 2012). These signals are detected in most/all beams, but with atypical frequency-dependent delay. This delay is somewhat quadratic, but with ‘kinks’ where . These authors also noted that the inferred DM for these signals, if one fits for the theoretical quadratic dispersion law, is, in the case of 15 of the 21 perytons reported, within of , the DM for the LB. Other curious characteristics of the peryton signals include that: they all occured in the UTC range , have a tendency to appear in the latter of each second, and are separated by gaps of seconds. In the light of the disimilarity between these signals and the burst discussed in this paper we are confident that the two phenomena are not linked. Furthermore we agree with the conclusion of Burke-Spolaor et al. (2011) that the LB originated from a boresight astrophysical source, as originally concluded by Lorimer et al. (2007).
Pulsar Giant Pulse: Pulsar spectra are typically steep: their mean spectral index is , with values steeper than being very uncommon (Maron et al., 2000). Nevertheless, despite the flat spectrum of the pulse, we consider this possibility as, on a pulse-by-pulse basis pulsar spectra can vary dramatically (Kramer et al., 2003), and because the radio-emitting magnetars show flat spectra (e.g. Levin et al. (2010) and references therein). This scenario presupposes that the NE2001 model is sufficiently uncertain, i.e. the free electron content is underestimated by more than 50% along the line of sight to the source. This is possible; see e.g. Gaensler et al. (2008) who showed errors of a factor of two at high Galactic latitutes, and Deller et al. (2009) for a comparison with VLBI-derived distances. The most likely Galactic source to consider is that of a ‘giant pulse’ (GP) from a pulsar at the edge of the Galaxy. GPs are sometimes (arbitrarily) defined to be those pulses where the pulse ‘energy’ (i.e. the product of the peak flux density and the effective pulse width) is more than 10 times the mean (Knight, 2006). There are at least 14 pulsars known to exhibit GPs, the most notable being the Crab Pulsar, which we will use as a template below. The pulse energy distributions for GPs follow power-laws such that the number of GPs with energy is proportional to . The measured value of in the most recent analysis of the main pulse GPs of the Crab is (Karuppusamy et al., 2010). The lowest measured value is for the millisecond pulsar B193721 (Soglasnov et al., 2004) and the highest is for the 0.9-s pulsar B003107 (Kuzmin & Ershov, 2004).
The detected pulse had a S/N of , whereas we would have been capable of easily detecting pulses at S/Ns as low as 5. For a GP-emitting pulsar this means that we might have expected weaker pulses (this is for the Crab’s ) assuming similar pulse widths, or that the probability we get a pulse in a given (unknown) pulse period is where is the total number of periods observed and is the observation time. Thus the probability of not seeing a single weaker pulse for periods in a row is which (assuming , which it no doubt will be for any reasonable pulsar period) is just . This has the (perhaps counter-intuitive) implication that the limit on is independent of the duration of the followup, as long as and there are no re-detections. So, a probability of implies (such as for the Crab) is ruled out and for a probability of , the range is ruled out. Very flat distributions with are not ruled out.
Although the limit on is no better for the hours of followup as compared to the 35-minute PMPS observation alone, the limit on the GP rate is much stronger. The rate per period is , whereas pulses with the same energy () occur with a much higher probability of in the case of the Crab’s main-pulse GPs (see the top panel of Figure 5 in Karuppusamy et al. (2010)). However, we should consider the intrinsic fluence, , for a fair comparison. Taking kpc as the distance to J185208, and recalling that the distance to the Crab is kpc, we see that we must consider the rate of pulses with energy which is for the Crab. This is not excluded by our rate limit, however we know , not as for the Crab. Also, this implicitly assumes that the GP rate is identical to the Crab at an intrinsic fluence of . If we consider the rates to be identical at an intrinsic fluence times lower and utilise our limit, we get a rate of . Choosing a lower intrinsic energy as a reference point gives an even more constraining limit, although it is unclear where this point should be chosen.
We can see that a long period pulsar with (say) s, or one with a GP burst rate times less than the Crab, or, equivalently, a source with a high nulling fraction, is not ruled out. In the past 6 years a number of long-period pulsars have been discovered which might fit these criteria. The first group are the three radio-emitting magnetars. These sources show large modulation in single pulse flux density, and flat radio spectra (Lazaridis et al., 2008). However, unlike the J185208 pulse, they are seen to be ‘on’ for very long timescales and have been tracked over several years. The so-called “RRATs” emit detectable pulses at a rate per period of between . It is unclear, in most cases, whether or not these sources null, but the lower limit on the ratio of peak to average flux densities can be (e.g Keane & McLaughlin (2011)). The pulse energy distributions of these sources are not yet well studied, although some seem to show log-normal distributions (Keane et al., 2010) whereas the two sources with power-law distributions show and respectively (Miller et al., in prep.). With a single pulse it is impossible to pass comment on the likelihood of a log-normal (or any other parameter) distribution.
We applied the same analysis to the LB, where 40 hours of followup observation have been reported without a further detection (Lorimer et al., 2007). In this case, we rule out with a probability of (and with a probability of ), where we have adopted Lorimer et al’s S/N of . The limit on the GP rate per period is . In the case of the LB, where the DM in excess of the NE2001 value is so much larger than in the J185208 case, and hence that the distance is apparently kpc, this rate can be easily scaled to . However, using the nominal distance of Mpc, the inferred radio luminosity is orders of magnitude brighter than the brightest pulse ever detected from the Crab, which seems much too luminous to be due to the same mechanism. For both bursts, we note that the above calculation of the limit for implicitly assumes a rate of 1 per , whereas the best estimate for the rates, in both cases, can be taken to be per (Gehrels, 1986), with corresponding probability of , where . If the true rate were lower than the nominal rate used, the limit would be less constraining than stated above, whereas if the rate is in fact higher the limit would be even stronger.
Annihilating Black Holes: One theorised source of ‘single event’ radio signals are annihilating mini black holes. Evaporating black holes with kg can create electron-positron pairs (as ). If evaporation can only proceed down to a mass , at which point the energy of is released, then pairs with (initial) Lorentz factors of are created. As first pointed out by Rees (1977), such a “fireball” of relativistic pairs, which would have energy J and contain pairs, expanding into the surrounding magnetic field of the interstellar medium, will produce surface currents and a radio burst. Blandford (1977) showed that the pairs will be sufficiently energetic to do this, while avoiding annihilation, in the range , and calculated the energy spectrum of the radio pulse to be:
| (2) |
where describes the shape of the spectrum, a power-law with spectral index up to , a critical frequency GHz, above which the spectrum steepens significantly. Substituting in the earlier expression for and parameterising , and this becomes:
| (3) |
Such a pulse occurs in a single radio frequency cycle (and so is broadband) at a frequency of GHz. The observed pulse width is smeared with respect to the intrinsic width, so that the inferred ‘radio pseudo-luminosity’ of the radio pulse is simply:
| (4) |
At , , so in our parameterisation we have . But we know that, by definition, , where is flux density and is distance. Thus, assuming the burst under consideration here is due to such an annihilating black hole we can infer a distance from the observed , and expected value. This yields a distance of kpc. Larger values of or the lower sensitivity of an off-axis detection both lower the distance. In theory, this estimate for distance in the black hole scenario can be compared with the DM estimate for the distance as a check of consistency. We again have two scenarios: (i) if the NE2001 model is correct then the distance is much too short and inconsistent with the DM distance; (ii) if the NE2001 model is sufficiently incorrect, so that we can attribute essentially all the dispersion to the kpc of Galactic material along the line of sight, the scenario is not inconsistent. In the case of the LB, repeating this analysis we infer a distance of kpc, which is, regardless of whether or not NE2001 is hugely incorrect along that particular line of sight, much too short. Thus this scenario is not a consistent explanation for the LB.
Other Solutions: In double neutron star systems, one star will be recycled to millisecond periods, whereas the second will have a longer period (e.g. Lorimer (2008) and references therein). Hansen & Lyutikov (2001) consider such a binary, on the verge of merging due to the emission of gravitational waves, where the longer period star has a magnetic field of G and a period of s. The millisecond pulsar fuels a flow of plasma in the light cylinder of the long-period pulsar, within which it is completely enclosed, resulting in the loss of orbital and spin energy to a broadband coherent millisecond radio burst. The flux density detected at Earth for such an event, occuring at a distance , is where is an efficiency factor, and is the magnetic field strength of the long period neutron star in units of G. Applying this to the pulse under consideration here implies a distance of Mpc ( kpc) for magnetic field strengths of G ( G), which is not inconsistent with the observed dispersion, for a sufficiently incorrect NE2001 estimate along this line of sight. In the case of the LB, this yields a distance of kpc ( kpc), which is too small a distance to be consistent, regardless of the corrrectness of NE2001 for the line of sight. However, it is highly uncertain as to whether the signal could propagate through the “plasma shroud” of the system, and the volumetric merger rate suggests that these events are unlikely to occur at distances Mpc (Hansen & Lyutikov, 2001). A confirmation would neccessarily require a detection of the gravitational wave counterpart signal, but as both pulses under discussion here occured before the LIGO and GEO600 detectors came online, no such check is possible.
Colgate & Noerdlinger (1971) and Colgate (1975) considered the case of a supernova shell expanding into the magnetic field of the pre-existing star. The shell “combs” the magnetic field into the radial direction, producing a current sheet and an associated coherent radio burst. As for the merger scenario, given the expected rates, the distance such events are expected to occur at is Mpc. Furthermore, for a volumetric supernova rate of (Horiuchi et al., 2011), the number of supernovae expected in the PMPS would be just assuming it would be sensitive out to Mpc in all directions, which itself is highly optimistic given the effects of dispersion and scattering on sensitivity. The predicted allowable pulse energies cover a large range: J, with the 1970s limits just probing the upper end of this range for sources at 100 Mpc (Meikle & Colgate, 1978). Taking the pulse under consideration here to be due to such an event the implied energy at Mpc is J. The same calculation for the LB gives J for the same distance. The wide (and therefore unconstraining) range of allowable energies mean that a distance consistent with the dispersion can easily be found.
Given the wide range of Lorentz factors possible (), one might also devise a relativistic source to fit the observed distance and flux density, e.g. a precessing jet from a microquasar (R. Spencer, private communication). All of the other known types of radio transient signals can be dismissed due to either their timescales, their lack of dispersion (as nearby sources), or both (Keane, 2010).
4 Conclusions & Discussion
The pulse discussed here is consistent with a number of scenarios. It is consistent with a ‘giant pulse’ from either a young pulsar with a burst rate perhaps times less than the Crab, or a long period pulsar, albeit with quite a steep cumulative pulse energy distribution with , and a flat radio spectrum more like those of the radio-emitting magnetars. A second scenario involving the radio signal from an annihilating mini black hole is also consistent. It is interesting that the two possibilities can only apply if the NE2001 model is sufficiently incorrect along the line of sight to the source that all of the dispersion is due to the Galaxy. It is also noteworthy that neither of these two scenarios give a consistent solution for the LB, regardless of NE2001’s precision. We can use the lack of other detections in the PMPS to set an upper limit on , the cosmological density of mini black holes which produce radio bursts (i.e. primordial black holes within a certain mass range). From one event within a (say) kpc radius, detected during the PMPS, whose duration was y and field-of-view was , we can extrapolate to obtain a limit of . Although, amongst other things, this assumes that all such black holes produce radio bursts at the end of their lives, the implication is that annihilating black holes are an insignificant contribution to the matter density of the Universe.
Next we considered radio bursts from NS-NS mergers, which, although the rate is uncertain, can be consistent with an extragalactic source for the pulse, although again not for the LB. A burst associated with an expanding supernova shell allows solutions for both pulses, although the predicted energy range for the pulse (which spans 8 orders of magnitude) means a meaningful comparison with DM-derved distances is not possible. An important point is that the intrinsic timescale is unknown for the pulses discussed here. In both cases the pulse widths are of the order of, and just slightly larger than, the dispersion smearing time within a single -MHz frequency channel. We cannot account for any contribution due to scattering in the interverning medium, as our knowledge of this effect along specific lines of sight through the Galaxy is very poor. However, this could be used to decide between the consistent solutions. For instance, if there is zero (or very little) scattering then we would know that the intrinsic pulse timescale is ms and the annihilating mini black hole (and supernova) scenarios would be ruled out. All we can say is that for the pulsars closest to the line of sight monitored by the Lovell Telescope it is difficult to decipher scattering from intrinsic profile features, although the recent successful work by Hassall et al. (2012) in this area provides cause for optimism. Transient signals detected in the future with LOFAR, and other next generation wide field-of-view telescopes, where rapid localisation, classification, multi-wavelength followup, and the detection of any associated gravitational wave signal (e.g. with Advanced LIGO) will be possible, lead us to believe that unambiguous identification of the sources of such energetic events will become routine in the SKA era.
Acknowledgments
EK acknowledges the FSM for support. The authors thank R. P. Eatough and the anonymous referee for useful discussion and helpful comments which have improved the quality of this paper.
References
- Bhat et al. (2004) Bhat N. D. R., Cordes J. M., Camilo F., Nice D. J., Lorimer D. R., 2004, ApJ, 605, 759
- Blandford (1977) Blandford R. D., 1977, MNRAS, 181, 489
- Booth et al. (2009) Booth R. S., de Blok W. J. G., Jonas J. L., Fanaroff B., 2009, (astro-ph/0910.2935)
- Burke-Spolaor & Bailes (2010) Burke-Spolaor S., Bailes M., 2010, MNRAS, 402, 855
- Burke-Spolaor et al. (2011) Burke-Spolaor S., Bailes M., Ekers R., Macquart J., Crawford F., III, 2011, ApJ, 727, 18
- Colegate & Clarke (2011) Colegate T. M., Clarke N., 2011, PASA, 28, 299
- Colgate & Noerdlinger (1971) Colgate S. A., Noerdlinger P. D., 1971, ApJ, 165, 509
- Colgate (1975) Colgate S. A., 1975, ApJ, 198, 439
- Cordes & Lazio (2002) Cordes J. M., Lazio T. J. W., 2002 (astro-ph/0207156)
- Deller et al. (2009) Deller A. T., Tingay S. J., Bailes M., Reynolds J. E., 2009, ApJ, 701, 1243
- Eatough et al. (2009) Eatough R. P., Keane E. F., Lyne A. G., 2009, MNRAS, 395, 410
- Gaensler et al. (2008) Gaensler B. M., Madsen G. J., Chatterjee S., Mao S. A., 2008, PASA, 25, 184
- Gehrels (1986) Gehrels N., 1986, ApJ, 303, 336
- Hansen & Lyutikov (2001) Hansen B. M. S., Lyutikov M., 2001, MNRAS, 322, 695
- Hassall et al. (2012) Hassall T. et al., 2012, A&A, in press (astro-ph/1204.3864).
- Hobbs et al. (2010) Hobbs G. et al., 2010, CQG, 27, 084013
- Horiuchi et al. ( 2011) Horiuchi S. et al., 2011, ApJ, 738, 154
- Johnston et al. (2008) Johnston S. et al., 2008, Experimental Astronomy, 22, 151
- Karuppusamy et al. (2010) Karuppusamy R., Stappers B. W., van Straten W., 2010, A&A, 515, A36
- Keane (2010) Keane E. F., 2010, Ph.D. thesis, University of Manchester
- Keane et al. (2010) Keane E. F., et al., 2010, MNRAS, 1057
- Keane et al. (2011) Keane E. F., Kramer M., Lyne A. G., Stappers B. W., McLaughlin M. A., 2011, MNRAS, 838
- Keane & McLaughlin (2011) Keane E. F., McLaughlin M. A., 2011, Bulletin of the Astronomical Society of India, 39, 333
- Knight (2006) Knight H. S., 2006, Chinese Journal of Astronomy and Astrophysics Supplement, 6, 41
- Kocz et al. (2012) Kocz J., Bailes M., Barnes D., Burke-Spolaor S., Levin L., 2012, MNRAS, 271
- Kramer et al. (2003) Kramer, M., et al., 2003, A&A, 407, 655
- Kuzmin & Ershov (2004) Kuzmin A. D., Ershov A. A., 2004, A&A, 427, 575
- Lazaridis et al. (2008) Lazaridis, K., et al., 2008, MNRAS, 390, 839
- Levin et al. (2010) Levin, L., et al., 2010, ApJL, 721, L33
- Lorimer (2008) Lorimer D. R., 2008, Living Reviews in Relativity, 11, 8
- Lorimer et al. (2007) Lorimer D. R., Bailes M., McLaughlin M. A., Narkevic D. J., Crawford F., 2007, Science, 318, 777
- Manchester et al. (2001) Manchester R. N. et al., 2001, MNRAS, 328, 17
- Maron et al. (2000) Maron O. et al., Kijak, J., Kramer, M., Wielebinski, R., 2000, A&A, 147, 195
- Meikle & Colgate (1978) Meikle W. P. S., Colgate S. A., 1978, ApJ, 220, 1076
- Nita et al. (2002) Nita G. M., Gary D. E., Lanzerotti L. J., Thomson D. J., 2002, ApJ, 570, 423
- Perley et al. (2011) Perley R. A., Chandler C. J., Butler B. J., Wrobel J. M., 2011, ApJL, 739, L1
- Rees (1977) Rees M. J., 1977, Nature, 266, 333
- Soglasnov et al. (2004) Soglasnov V. A., et al., 2004, ApJ, 616, 439
- Stappers et al. (2011) Stappers B. W. et al., 2011, A&A, 530, A80
- Staveley-Smith et al. (1996) Staveley-Smith L. et al., 1996, Proc. Astr. Soc. Aust., 13, 243