Properties of Nearby Starburst Galaxies Based on their Diffuse Gamma-ray Emission
Abstract
The physical relationship between the far-infrared and radio fluxes of star forming galaxies has yet to be definitively determined. The favored interpretation, the “calorimeter model,” requires that supernova generated cosmic ray (CR) electrons cool rapidly via synchrotron radiation. However, this cooling should steepen their radio spectra beyond what is observed, and so enhanced ionization losses at low energies from high gas densities are also required. Further, evaluating the minimum energy magnetic field strength with the traditional scaling of the synchrotron flux may underestimate the true value in massive starbursts if their magnetic energy density is comparable to the hydrostatic pressure of their disks. Gamma-ray spectra of starburst galaxies, combined with radio data, provide a less ambiguous estimate of these physical properties in starburst nuclei. While the radio flux is most sensitive to the magnetic field, the GeV gamma-ray spectrum normalization depends primarily on gas density. To this end, spectra above 100 MeV were constructed for two nearby starburst galaxies, NGC 253 and M82, using data. Their nuclear radio and far-infrared spectra from the literature are compared to new models of the steady-state CR distributions expected from starburst galaxies. Models with high magnetic fields, favoring galaxy calorimetry, are overall better fits to the observations. These solutions also imply relatively high densities and CR ionization rates, consistent with molecular cloud studies.
1 Introduction
The successful operation of the Gamma-ray Space Telescope provides our first opportunity to infer the potential origins of the diffuse high energy emission from normal galaxies beyond the Milky Way (e. g., Butt, 2010). Recent detections of diffuse gamma-ray emission from Local Group, starburst, and Seyfert 2 galaxies demonstrate the system’s sensitivity (Abdo et al., 2011, 2010a; Lenain et al., 2010). With further integration time beyond these detection studies, we can construct gamma-ray spectra in order to constrain models of the cosmic ray (CR) interactions that give rise to the emission in these sources.
For starburst galaxies in particular, the normalization of the gamma-ray spectrum helps to constrain, among other properties, the volume-averaged gas density affecting the CR distributions. With this and the radio normalization, the strength of the so-called “calorimeter” model of CR cooling may be determined for these sources. At issue is the discrepancy in massive starbursts between the minimum energy magnetic field strength, estimated from the radio flux, and the equipartition field strength, estimated from gas surface density and assuming hydrostatic balance (Thompson et al., 2006). Given their large surface densities and the linearity of the FIR-radio correlation over decades in flux, Thompson et al. (2006) argues for relatively high field strengths in starbursts. These values can be an order of magnitude above the minimum energy field estimates, and thus alter significantly our understanding of the energy budgets in starburst galaxies.
In this work, the gamma-ray, radio, and FIR spectra of the archetypal starburst galaxies NGC 253 and M82 are quantitatively compared to self-consistent models of the various energy loss and emission mechanisms for CRs in normal galaxies. A broad parameter space is explored, including density and magnetic field strength, to constrain the physical conditions of these starburst nuclei that best agree with their full spectral energy distributions.
2 Observations and Results
The data were obtained using the Large Area Telescope (LAT) (Atwood et al., 2009). The LAT is a pair-conversion detector sensitive to photons with energies between roughly 20 MeV and 300 GeV. The publicly available Science Tools (Abdo et al., 2009) were used, and the threads reviewed on the Science Center web site111http://fermi.gsfc.nasa.gov/ssc/data for the binned likelihood analysis were followed.
Almost 3.5 yr of Pass 7 LAT data were downloaded from regions of interest around NGC 253 and M82. To avoid gamma-rays from the Earth’s limb, a zenith cut of was invoked in the data filtering step. The rock angle was constrained to be less than and various other data flags and filters were set as suggested by the LAT team. With the large field of view of the LAT, the background must be modeled in order to ensure photons only associated with the target source are counted. The 2FGL catalog was used as an initial background, and then was used to search for unmodeled sources that showed up with high significance. Two additional sources were identified within of NGC 253, and three were found near M82. These new sources were incorporated into the background model with the likelihood routine . Thirty logarithmically-spaced energy bins per were used for the counts cube and binned exposure map. The spatial binning for both was set to per pixel. An additional was added to the exposure map radius to account for the larger PSF at low energies. The P7SOURCE_V6 instrument response functions were used. The final energy binning was settled upon to maximize the signal-to-noise and detection significance, based on the test statistic (TS), in each bin.
It should be noted that no source with a significant TS was detected above 100 MeV at the location of M81. However, the separation between M82 and M81 is smaller than or comparable to the point spread function of the LAT below 1 GeV, so they are currently difficult to resolve. For this work, it was assumed that none of the flux from the position of M82 originates from M81. The FIR and radio luminosities of M82 are more than an order of magnitude higher than those of M81, so the gamma-ray contribution from M81 is expected to be negligible.
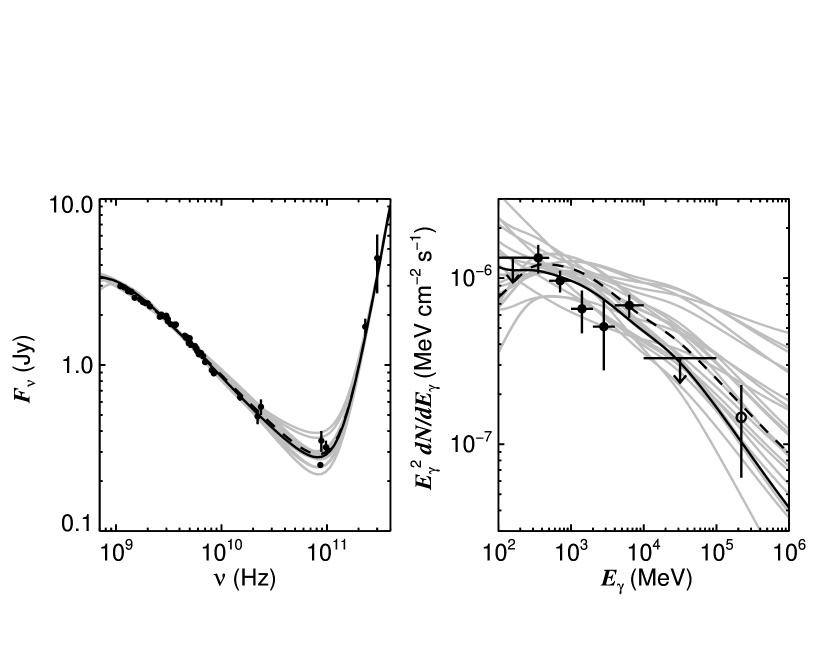
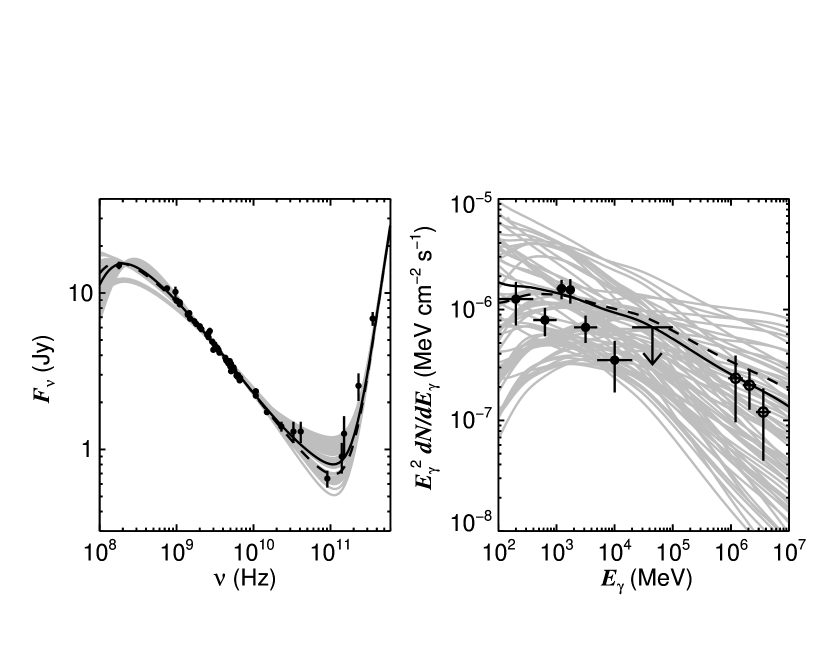
For NGC 253, the integrated flux between 100 MeV and 100 GeV was ph cm-2 s-1, with a photon index of , and TS of 113. For M82, a total flux of ph cm-2 s-1 was found, with a photon index of , and TS of 180. These results are consistent with initial detections (Abdo et al., 2010b) and the second LAT catalog (Abdo et al., 2011). They also extend to meet the TeV observations (Acero et al., 2009; Acciari et al., 2009). Lightcurves show no detectable variability in eight-week bins. The differential spectra of both galaxies are shown in Figures 1 and 2, and are summarized in Table 1. A linear fit yields values that indicate the spectra are inconsistent with a simple power law. In particular, there may be an apparent turnover in the spectra below a GeV indicative of the expected CR proton interactions in these sources (Blom, Paglione & Carramiñana, 1999). The following section presents models of gamma-ray and radio emission from the expected CR populations in starburst nuclei.
3 Modeling the Starburst Emission
The likely origin of gamma-rays from starburst galaxies is the interaction of supernova-accelerated CRs with a large mass of dense, primarily molecular, gas. The high temperatures of dense molecular clouds in starbursts (e. g., Paglione et al., 2004; Sakamoto et al., 2011) indicate significant penetration and ionization by CRs (Suchkov, Allen, & Heckman, 1993). The CR electrons themselves emit synchrotron radiation, so radio spectra of starburst regions serve as a significant constraint as mentioned before. The imbedded, dusty star forming regions should radiate strongly in the FIR, and if the CR electrons lose most of their energy within them, this would be a natural explanation for the FIR-radio correlation and calorimetry. However, the gamma-ray spectra are critical for helping to reduce degeneracies and ambiguities in the physical solutions.
To quantify the starburst contribution to the gamma-ray and radio emission from starburst galaxies, the steady-state CR distributions were modeled. The models are significantly updated versions of earlier studies (Paglione et al., 1996), similar in approach to more recent work (e. g., Torres, 2004). The steady-state CR diffusion-loss equation (Longair, 1981) is now integrated over energy, where the original work solved a time integration, requiring a slightly different Green’s function. For electrons, as before, energy losses due to ionization, non-thermal bremsstrahlung, synchrotron radiation, IC scattering, and escape are accounted for (Paglione et al., 1996; Torres, 2004, appendix). The full Klein-Nishina cross section is now included (Schlickeiser, 2002, p. 88) for IC scattering since relativistic effects become important at the high energies to which and ground-based arrays are now sensitive. Bremsstrahlung losses are now included in the continuous CR energy loss rate rather than approximating it with an energy-independent CR loss timescale. Also the photon energy density for IC is now constrained using the starburst templates of Siebenmorgen & Krügel (2007) fit to the IR spectra. Finally, positrons (see below) are now included.
The CR protons are affected by ionization and escape losses, plus pion production above a total energy of 1.22 GeV. The cross section parameterizations of Kamae et al. (2006) are now employed for all pion species (). Secondary CR electrons are created via knock-on or Coulomb interactions, and the decay of negatively charged pions. Secondary positrons are created through the decay of positive pions. The distributions of these secondary leptons from charged pions are also determined using the parameterizations of Kamae et al. (2006).
Power law primary CR electron and proton injection spectra of the form , in particles cm-3 s-1 MeV-1, are assumed, where is the particle total energy. The previous model used a power law in kinetic energy, similar to other studies (Torres, 2004), which has a conveniently simple overall normalization. The total energy is chosen in this work not only to be consistent with other theoretical studies (Lacki, Thompson, & Quataert, 2010; Bell, 1978), but as a deliberate contrast from the previous work to test the effect of a different injection spectrum. This choice mostly affects the proton spectrum at low energies, and thus the pion spectra, which, via secondary production, could alter both the radio and gamma-ray emission, particularly near the pion bump.
This is strictly a one-zone model only simulating the expected nuclear emission from starburst galaxies. No diffusion to, or emission from, the extended disk is considered. There are a variety or reasons for this choice besides basic simplicity. Given that these sources are so near the flux and angular resolution detection thresholds already, the much lower emissivities from the disk are insignificant to . We originally modeled the disk of NGC 253 (Paglione et al., 1996) and indeed found its gamma-ray emissivity to be negligible compared to the central starburst, in the same way as its radio emission is much reduced (Ulvestad, 2000). Recently Torres et al. (2012) estimated more realistically the steep decline (by an order of magnitude) of the CR proton density outside the inner starburst in NGC 253. The diffuse gamma-ray and radio emission from the Milky Way Galactic center also outshine the disk (Crocker et al., 2011). Our nearest neighbor,the LMC, one of the very few extragalactic sources with resolved gamma-ray emission, similarly only shows emission from its most massive site of star formation (Butt, 2010).
Using a power law injection spectrum in total energy also requires a new normalization. As usual, the normalization is determined by the supernova rate, , starburst volume, , and the efficiency of power transfer between the supernovae and CRs, , such that
| (1) |
The supernova energy, ergs. A minimum CR kinetic energy, a few MeV, is required for acceleration in a shock front given shock velocities of km s-1(Bell, 1978), and is much smaller than the proton rest mass energy. The relative normalization between the proton and electron CR distributions at high energies then depends on the injection spectral index (Bell, 1978; Lacki et al., 2010; Persic et al., 2008; Schlickeiser, 2002, p. 472), and as such is no longer an independent free parameter:
| (2) |
Typical values of –2.4 yield proton-to-electron ratios of 50–200, which are consistent with Milky Way observations and effectively constrain the choice of . Note that this is a simplification which differs from the treatment of Lacki et al. (2010) (see also discussion in Persic et al., 2008) in order to reduce the number of free parameters. This normalization mostly impacts the secondary contribution to the CR electron+positron flux, and introduces variations of at most factors of from other treatments.
A convection loss timescale Myr is assumed, which is consistent with estimates of starburst winds and CR transport time (or length) scales (Heesen et al., 2009; Murphy et al., 2008). So the total energy-dependent escape timescale is the combined diffusion and convection terms, or
| (3) |
In sum, the model variables are , the volume-averaged gas (H H) density , magnetic field strength , diffusion time scale , and photon field energy density (from the integrated starburst SED template).
3.1 Model Results: Steady-State CR Distributions
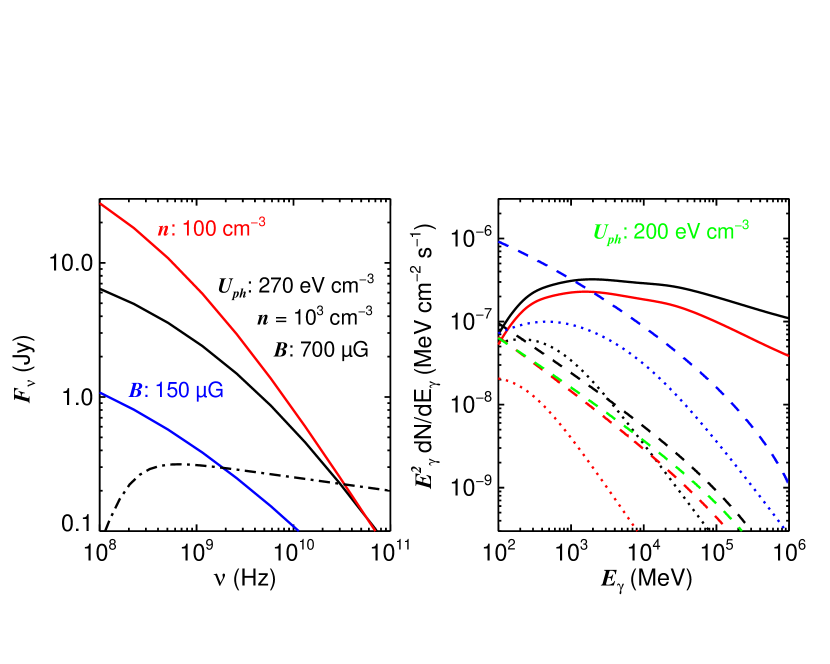
Figure 3 shows the results from a few models broadly indicating the effects of varying density and magnetic field strength on the steady-state CR electron+positron distributions. Higher densities increase the ionization losses at low energies, leading to an overall flatter, or more curved, spectrum. High magnetic fields increase synchrotron radiation losses, subsequently decreasing the CR electron distribution, particularly at high energies. As a result, high energy emission from inverse Compton (IC) scattering and non-thermal bremsstrahlung are reduced. Losses from IC scattering are less important; the overall results are quite insensitive to changes in or the FIR spectrum template. Increased losses due to a shorter convection timescale () are also relatively small, primarily lowering and slightly steepening the CR proton spectrum around TeV energies. Longer diffusion timescales (higher , see Torres et al., 2010) result in slightly harder and higher CR spectra above 10 GeV or so. This effect is also comparatively small, reaching factors of just up to a few above a TeV, and negligibly changing the radio spectrum.
Altering the injection slope affects the steady-state spectral slopes accordingly, but can also substantially change the contribution of secondary particles because of its effect on the proton-to-electron ratio. For example, for flatter slopes, secondary particles contribute more to the lepton distribution (Eq. 2), causing a more pronounced bump around 0.1 GeV in the spectrum. Note that this secondary bump is very subtle compared to the primary spectrum, so adjusting it by factors of a few changes the total lepton spectrum very little. Thus the results are not very sensitive to whether a power law injection spectrum in total or kinetic energy is chosen, nor to the specific treatment of .
The CR proton spectrum depends primarily on the density. As with the electrons, higher densities slightly flatten the proton spectrum at low energies from ionization losses. However, high energy losses are also increased via pion production, so the overall effect is that the proton distribution decreases, and slightly flattens, with density. The effect of using an injection spectrum that is a power law in total, rather than kinetic, energy mostly appears in the resultant pion distributions (and thus the secondary electron+positron distributions). The pion spectrum is marginally lowered (by factors of ) at the 0.1 GeV bump, but is unaffected at high energies. This small difference seems to have a negligible effect on the resultant gamma-ray and radio emission spectra as the secondary contribution is slight, and the high energy pion distributions are unaltered.
3.2 Model Results: Gamma-ray and Radio Spectra
Radio and gamma-ray spectra were generated from the steady-state CR distributions. Gamma-rays are created by IC scattering and non-thermal bremsstralung from primary and secondary CR electrons+positrons, plus the decay of neutral pions from CR protons interacting with ambient gas. Radio spectra are generated by synchrotron radiation from these CR leptons, thermal free-free absorption and emission, plus warm dust emission at millimeter wavelengths. We neglect TeV absorption and pair production for now as their expected impact is relatively small and difficult to discern with current sensitivities (Torres, 2004).
The gamma-ray spectrum of a star forming galaxy above a GeV is dominated by pion decay from CR protons interacting with the interstellar medium (Figure 4). At lower gamma-ray energies, bremsstrahlung and/or IC scattering from CR electrons is important. The IC contribution is very sensitive to the high energy tail of the CR lepton distribution, and contributes most when there is a sufficient density of very high energy CRs, that is, when the magnetic field – and associated energy losses – is low. In fact, sensitive MeV data would be very useful to constrain the TeV CR lepton distributions in these galaxies. Higher densities enhance not only pion decay emission, but also non-thermal bremsstrahlung, since the secondary CR electron and positron distributions increase with density given that they too arise from CR protons (via charged pion decay). Therefore, the gamma-ray spectrum normalization is most sensitive to density, with some dependence on magnetic field strength below a GeV.
The radio spectrum normalization is very sensitive to the magnetic field. Higher gas densities tend to reduce the radio signal somewhat by flattening the CR electron distribution. The flattening, or curvature, in the radio spectrum (Williams & Bower, 2010; Thompson et al., 2006) is a result of ionization reactions affecting mostly lower energy CR electrons. Higher densities also enhance the bump feature in the secondary distributions, adding to the curvature. To a much lesser extent, the far-infrared (FIR) emission from dust also affects the radio and gamma-ray spectra by providing a deep reservoir of seed photons for IC scattering. So a high FIR luminosity increases CR leptonic losses, consequently diminishing slightly the non-thermal bremsstrahlung and synchrotron emission, while enhancing the IC gamma-ray flux. The FIR-radio correlation hints at the interrelatedness of all of these processes in star-forming galaxies. Neither the radio nor gamma-ray emission is very sensitive to the diffusion timescale. Together the radio and gamma-ray normalizations effectively constrain and .
3.3 Model Fits to NGC 253 and M82
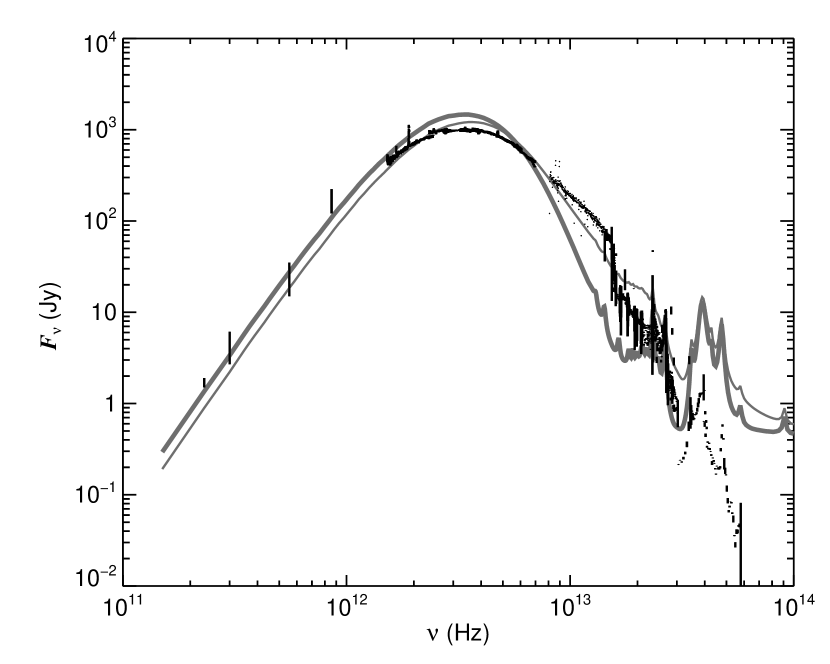
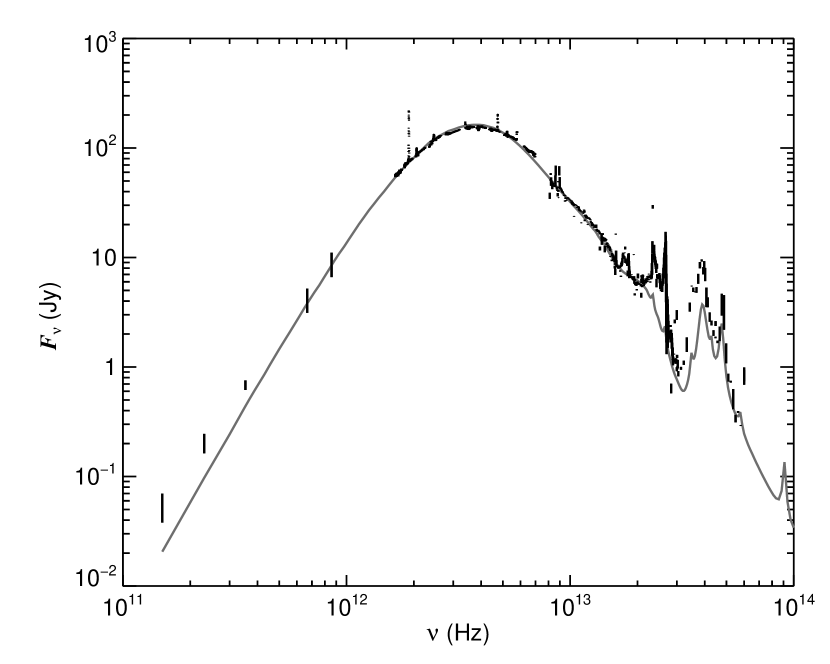
The IR spectra of NGC 253 and M82 are shown in Figures 5 and 6 with some closely matching starburst SEDs from Siebenmorgen & Krügel (2007). The photon densities from these models are 171 and 274 eV cm-3 for NGC 253 and M82, respectively. The assumed supernova rates are 0.1 and 0.08 yr-1 for M82 and NGC 253, respectively, and their assumed distances are 3.9 and 3.5 Mpc.
The radio and gamma-ray spectra were simultaneously fit using hundreds of model runs over a broad parameter space. Given the possibility that the magnetic fields in such strong starbursts may be quite high (Thompson et al., 2006), field strengths up to mG were included. Despite the small effect, we also investigated very short and long diffusion timescales, from 0.1 to 30 Myr since recent gamma-ray studies of supernova-cloud interactions indicate that long timescales reproduce the observations best (Torres et al., 2010). The best fitting models were determined using the minimum . The radio data were selectively chosen to include only the central starburst disks (data from within the inner arcmin, or central 300–500 pc where the molecular and mm continuum emission are strongest), not the more extended winds/halos. In starburst galaxies, this extended emission tends to have a much steeper spectrum (Williams & Bower, 2010; Heesen et al., 2009; Elmouttie et al., 1997) and is derived from a more evolved CR population rather than one directly interacting with the central starburst and contributing to the pion decay gamma-rays. The volumes for these galaxies were assumed to be disks of 150 pc radius and 70 pc thickness. This volume may underestimate their full molecular extent, especially in M82, but this distinction is not so critical here; fluxes are generated from the modeled emissivities by multiplying by the volume (Torres, 2004), thus canceling with the term in the normalization (Equation 1).
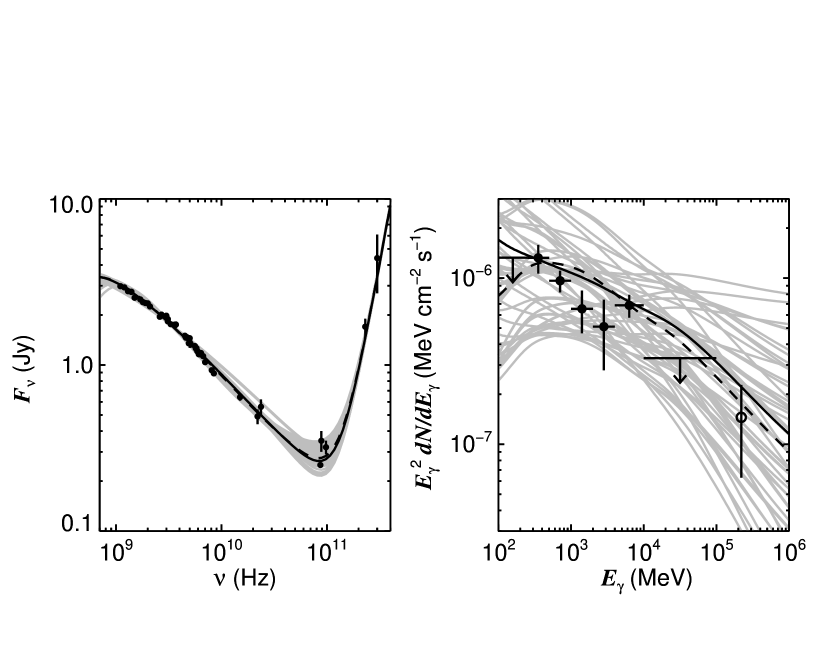
The best fit models are shown with the data in Figures 7–9. There is a large mismatch in both the noise and number of data points between the radio and gamma-rays. Thus the scatter in the gamma-ray models is understandable since the normalization is dictated mostly by the radio data. To stress the physical implications of the new data, fits were done artificially increasing the weighting of the gamma-ray data by the ratio of the numbers of radio and gamma-ray points. Very similar solutions result, though over a narrower range of parameter space.
Lacki et al. (2011) compared the first catalog detections and TeV data to a collection of published model predictions and concluded that they were for the most part broadly consistent with each other (many of these models were constrained merely by non-detections at GeV energies and so considerably overestimated the observations). The scatter in the models in their Fig. 1 mirrors the 3- envelope of fits in Figs. 7–9.
Normalizing the radio and gamma-ray models to match the spectra yields power transfer efficiencies for both galaxies. All fits within 3- of the minimum result in efficiencies well below 20%, which is consistent with theoretical predictions (Markiewicz, Drury & Völk, 1990).
Solutions with low values (Figures 10 and 11) do include low magnetic fields around the minimum energy value, G, but with very low gas densities of cm-3. Based on studies of dust and molecular gas in these galaxies, volume-averaged densities of at least several hundred HH cm-3 are expected (Paglione et al., 2004; Sakamoto et al., 2011; Weiß et al., 2001). Models with higher densities imply higher magnetic fields of several hundred G, approaching the calorimeter model expectations. Valid solutions also result for short confinement timescales. Torres et al. (2010) found that a diffusion coefficient of cm2 s-1 is strongly constrained by and TeV observations of supernova-cloud interactions. Given , and setting to the starburst radius of 150 pc, yields Myr. We restrict the following discussion just to models where cm-3 and Myr.
4 Discussion
These results generally favor the high magnetic field calorimeter model for starburst CR populations (Thompson et al., 2006). The implication is that the CR cooling rate, primarily via synchrotron radiation and ionization losses, is faster that the escape rate. Figure 12 shows the loss timescales for electrons using models consistent with the radio and gamma-ray data for NGC 253. Here the CR lifetime is simply approximated as either the energy loss timescale , where is the CR energy loss rate (Torres, 2004; Paglione et al., 1996), or the steady-state lifetime, . Even for lower densities and magnetic fields, the electron loss timescales are shorter than the escape timescale. Even protons appear mostly calorimetric, especially for low energies and high densities. So it would seem that the condition that is satisfied for electrons, particularly for higher values of and and given that diffusion timescales are likely longer than 1 Myr (recall that depends weakly on ). Therefore the minimum energy estimate for magnetic field strength may indeed underestimate the true value in starburst galaxies.
Another argument in favor of the high field (high density) solutions comes from a rough examination of the transport and interactions of CRs during their lifetimes within the starburst region. CRs encounter a column of primarily molecular gas which has been measured from CO studies to have beam-averaged values of up to H2 cm-2 (Paglione et al., 2004; Paglione et al., 2001; Weiß et al., 2001), where typical single-dish beam sizes encompass the entire central starburst region (300–600pc). One may approximate this column density as , where is akin to the mean free path of the CR. This path length is then of order 100 pc for low average gas densities (30 cm-3) and around a few pc for high values ( cm-3). The former result implies that the typical CR leaves the starburst region within its lifetime, rather than losing the majority of its energy within it, contradicting the steady-state assumption and calorimetry. But it is hard to understand independent studies of very warm cloud core temperatures in starbursts if CRs interact in such a limited way with molecular cloud cores (explored below). The high density (and high magnetic field) solutions imply that CRs lose the majority of their energy on spatial scales of order the sizes of dense molecular cloud clumps or cores. This result is much more consistent with model expectations and observations from photodissociation and/or cosmic ray dominated regions (Matsushita et al., 2010; Papadopoulos, 2010), the calorimeter model, the high measured cloud temperatures (Panuzzo et al., 2010), and the size scales of Galactic molecular clumps at such densities (McQuinn et al., 2002). Confirming this expectation are the measured volume densities and peak column densities of individual, pc scale cloud complexes in NGC 253 and M82 ( H2 cm-2 and cm-3) (Sakamoto et al., 2011; Weiß et al., 2001). Comparable magnetic field strengths, and volume and column densities, have been inferred across the full pc extent of the massive star-forming cloud Sgr B2 in the Galactic center (Crutcher et al., 1996).
Further justification for the high density and magnetic field solutions may be derived from the expected ionization rates from penetrating CRs in starburst molecular clouds. Ionization rates, , are estimated using the best fit models for CR electron+positron and proton distributions, and the cross sections and procedures from Padovani, Galli, & Glassgold (2009). Only the H2 cross sections are used in this analysis since they are the most significant. The steady-state CR fluxes are extrapolated down to the H2 ionization energy of 15.6 eV for the integration. Note that this extrapolation overestimates the true ionization rate since other absorption processes such as H2 excitation and dissociation may occur as gas column densities get large. Padovani et al. (2009) indicates that at low energies ( MeV and MeV for electrons and protons, respectively), the CR spectrum becomes rather flat, with a plateau that declines with the encountered column density. Deep within clouds, the CR proton contribution dominates over CR electron ionization given the apparently more gradual decline of with column density.
This analysis yields median values of s-1 for NGC 253 and M82 (Figure 13). This CR ionization rate is a few orders of magnitude above the estimate in M82 based on CR heating and the observed cloud temperatures, (Suchkov et al., 1993), and factors of 1–10 above the rate for ULIRGs (Papadopoulos, 2010). Taking from Suchkov et al. (1993) as the fiducial rate necessary to achieve the observed cloud kinetic temperatures in M82 and NGC 253, and reducing the mean from this work by that magnitude requires a column density of H2 cm-2 (Padovani et al., 2009), consistent with the observed column density. Further, Figure 13 indicates trends between and density and magnetic field strength. Solutions for lower and require more attenuation of the low energy CR flux to match the fiducial . From Padovani et al. (2009), column densities of up to H2 cm-2 or more are needed to reduce by the required factors of (Figure 14). Such column densities exceed the gas mass of their entire starburst regions, which further supports the higher density solutions, and thus the high calorimeter model. At very high densities however, lower columns are needed to reach the fiducial , and can yield path lengths much less than a pc, which is unreasonably small. Therefore, the ionization rate analysis disfavors the extremely high and low density (and magnetic field) solutions.
Finally, theoretical and observed scaling relations between , and and , complete the argument against very low magnetic fields in these starbursts. While the radio and gamma-ray solutions indicate a degeneracy between and (Figures 10 and 11), which also roughly follows the expected scaling relation , the magnetic field should also increase proportionately with (Crutcher, 1999). This scaling is shown in Figure 14. Again, magnetic fields of several hundred G are favored.
5 Conclusions
Self-consistent models of the steady-state CR distributions in starburst galaxies match both the radio and gamma-ray spectra of NGC 253 and M82. The models solve the CR diffusion-loss equation given a power law spectrum of supernova-accelerated particles, accounting for energy and particle losses due to ionization, synchrotron radiation, IC scattering, bremsstrahlung, secondary particle generation, and escape. The radio normalization depends mostly on the magnetic field, with some sensitivity to density in mostly the curvature of the spectrum. The gamma-ray spectrum, now observable with sufficient sensitivity with and TeV detections, is mostly normalized by the density, with some dependence on the magnetic field below a GeV. Therefore, with both radio and gamma-ray data, the densities and magnetic fields in a starburst region may be independently and less ambiguously constrained than from radio data alone. In particular, the question of calorimetry (high magnetic fields) in massive starbursts may be addressed.
In NGC 253 and M82, these model results favor the high magnetic field solutions anticipated by Thompson et al. (2006). The higher densities also implied are consistent with molecular gas studies. Further, the ionization rates, approximated from the steady-state CR distributions with high magnetic fields and densities, also match expectations. These results confirm that CR penetration and heating is an important contributor to the warm temperatures observed in starburst galaxies. These starburst nuclei may be populated to a significant filling factor with giant molecular clouds resembling Sgr B2 in magnetic field (G), column density ( H2 cm-2), and density ( cm-3).
References
- Abdo et al. (2011) Abdo, A. A. et al. 2012, ApJS, 199, 31
- Abdo et al. (2010b) Abdo, A. A. et al. 2010b, ApJ, 709, L152
- Abdo et al. (2010a) Abdo, A. A. et al. 2010a, A&A, 523, L2
- Abdo et al. (2009) Abdo, A. A. et al. 2009, ApJS, 183, 46
- Acero et al. (2009) Acero, F. et al. 2009, Science, 326, 1080
- Acciari et al. (2009) VERITAS Collaboration, Acciari et al. 2009, Nature, 462, 770
- Alton, Davies, & Bianchi (1999) Alton, P. B., Davies, J. I., Bianchi, S. 1999, A&A, 343, 51
- Atwood et al. (2009) Atwood, W. B. et al. 2009, ApJ, 697,1071
- Bell (1978) Bell, A. R. 1978b, MNRAS, 182, 443
- Bennett et al. (2003) Bennett, C. L. et al. 2003, ApJS, 148, 97
- Blattnig et al. (2000) Blattnig, S. R. et al. 2000, Phys. Rev. D, 62, 09403
- Blom et al. (1999) Blom, J. J., Paglione, T. A. D., Carramiñana, A. 1999, ApJ, 516, 744
- Butt (2010) Butt, Y. 2010, ApJ, 725, 1
- Carilli (1996) Carilli, C. L. 1996, A&A, 305, 402
- Carilli et al. (1992) Carilli, C. L., Holdaway, M. A., Ho, P. T. P., de Pree, C. G. 1992, ApJ, 399, 373
- Carlstrom et al. (1989) Carlstrom, J. E., Jackson, J., Ho, P. T. P., & Turner, J. L. 1989, in The Interstellar Medium in External Galaxies (Washington, DC: NASA), 337
- Chini et al. (1984) Chini, R., Kreysa, E., Mezger, P. G., Gemuend, H.-P. 1984, A&A, 137, 117
- Condon (1983) Condon, J. J. 1983, ApJS, 53, 459
- Crocker et al. (2011) Crocker, R. M., Jones, D. I., Aharonian, F., et al. 2011, MNRAS, 413, 763
- Crutcher (1999) Crutcher, R. M. 1999, ApJ, 520, 706
- Crutcher et al. (1996) Crutcher, R. M., Roberts, D. A., Mehringer, D. M., & Troland, T. H. 1996, ApJ, 462, L79
- Elmouttie et al. (1997) Elmouttie, M., Haynes, R. F., Jones, K. L., Ehle, M., Beck, R., Harnett, J. I., Wielebinski, R. 1997, MNRAS, 284, 830
- Garcia-Burillo et al. (2000) Garcia-Burillo, S., Martín-Pintado, J., Fuente, A., Neri, R. 2000, A&A, 355, 499
- Hildebrand et al. (1977) Hildebrand, R. H., Whitcomb, S. E., Winston, R., Stiening, R. F., Harper, D. A., Moseley, S. H. 1977, ApJ, 216, 698
- Heesen et al. (2009) Heesen, V., Beck, R., Krause, M., Dettmar, R.-J. 2009, A&A, 494, 563
- Hughes, Gear, & Robson (1994) Hughes, D. H., Gear, W. K., & Robson, E. I. 1994, MNRAS, 270, 641
- Kamae et al. (2006) Kamae, T., Karlsson, N., Mizuno, T., Abe, T., Koi, T. 2006, ApJ, 647, 692
- Krügel et al. (1990) Krügel, E., Chini, R., Klein, U., Lemke, R., Wielebinski, R., Zylka, R. 1990, A&A, 240, 232
- Kleinmann & Low (1970) Kleinmann, D. E., Low, F. J. 1970, ApJ, 161, 203
- Kellermann & Pauliny-Toth (1973) Kellermann, K. I. & Pauliny-Toth, I. I. K. 1973, AJ, 78, 828
- Kühr et al. (1981) Kürh, H., Witzel, A., Pauliny-Toth, I. I. K., Nauber, U. 1981, A&AS, 45, 367
- Lacki et al. (2011) Lacki, B. C., Thompson, T. A., Quataert, E., Loeb, A., & Waxman, E. 2011, ApJ, 734, 107
- Lacki et al. (2010) Lacki, B.C., Thompson, T. A., & Quataert, E. 2010, ApJ, 717, 1
- Laing & Peacock (1980) Laing, R. A. & Peacock, J. A. 1980, MNRAS, 190, 903
- Lenain et al. (2010) Lenain, J.-P., Ricci, C., Türler, M., Dorner, d., Walter, R. 2011, A&A, 524, 72
- Longair (1981) Longair, M. S. 1981, High Energy Astrophysics, (Cambridge:Cambridge University Press)
- Markiewicz, Drury & Völk (1990) Markiewicz, W. J., Drury, L. O’C., Völk, H. J. 1990, A&A, 236, 487
- Matsushita et al. (2010) Matsushita, S., Kawabe, R., Kohno, K., Tosaki, T., Vila-Vilaró, B. 2010, PASJ, 62, 409
- McQuinn et al. (2002) McQuinn, K. B. W., Simon, R., Law, C. J., Jackson, J. M., Bania, T. M., Clemens, D. P., & Heyer, M. H. 2002, ApJ, 576, 274
- Murphy et al. (2008) Murphy, E. J., Helou, G., Kenney, J. D. P., Armus, L., Braun, R. 2008, ApJ, 678, 828
- Padovani et al. (2009) Padovani, M., Galli, D., Glassgold, A. E. 2009, A&A, 501, 619
- Paglione et al. (1996) Paglione, T. A. D., Marscher, A. P., Jackson, J. M., & Bertsch, D. L. 1996, ApJ, 460, 295
- Paglione et al. (2001) Paglione, T. A. D. et al. 2001, ApJS, 135, 183
- Paglione et al. (2004) Paglione, T. A. D., Yam, O., Tosaki, T., Jackson, J. M. 2004, ApJ, 611, 835
- Papadopoulos (2010) Papadopoulos, P. P. 2010, ApJ, 720, 226
- Panuzzo et al. (2010) Panuzzo, P., Rangwala, N., Rykala, A., et al. 2010, A&A, 518, L37
- Pauliny-Toth et al. (1978) Pauliny-Toth, I. I. K., Witzel, A., Preuss, E., Kürh, H., Kellermann, K. I., Fomalont, E. B., Davis, M. M. 1978, AJ, 83, 451
- Peng et al. (1996) Peng, R., Zhou, S., Whiteoak, J. B., Lo, K. Y., & Sutton, E. C. 1996, ApJ, 470, 821
- Persic et al. (2008) Persic, M., Rephaeli, Y., & Arieli, Y. 2008, A&A, 486, 143
- Radovich, Kahanpää, & Lemke (2001) Radovich, M., Kahanpää, J., & Lemke, D. 2001, A&A, 377, 73
- Ricci et al. (2006) Ricci, R., Prandoni, I., Gruppioni, C., Sault, R. J., de Zotti, G. 2006, A&A, 445, 465
- Rieke et al. (1973) Rieke, G. H., Harper, D. D., Low, F. J., Armstrong, K. R. 1973, ApJ, 183, 67
- Rieke & Lebofsky (1987) Rieke, G. H. & Lebofsky, M. J. 1978, ApJ, 220, 37
- Rieke et al. (1980) Rieke, G. H., Lebofsky, M. J., Thompson, R. I., Low, F. J., Tokunaga, A. T. 1980, ApJ, 238, 24
- Rieke & Low (1972a) Rieke, G. H. & Low, F. J. 1972, ApJ, 176, 95
- Rieke & Low (1975b) Rieke, G. H. & Low, F. J. 1975, ApJ, 197, 17
- Sakamoto et al. (2011) Sakamoto, K., Mao, R.-Q., Matsushita, S., Peck, A. B., Sawada, T., Wiedner, M. C. 2011, ApJ, 735, 19
- Schlickeiser (2002) Schlickeiser, R. 2002, Cosmic Ray Astrophysics (New York: Springer)
- Siebenmorgen et al. (2004) Siebenmorgen, R., Freudling, W., Krügel, E., Haas, M. 2004, A&A, 421, 129
- Siebenmorgen & Krügel (2007) Siebenmorgen, R. & Krügel, E. 2007, A&A, 461, 445
- Suchkov et al. (1993) Suchkov, A., Allen, R. J., & Heckman, T. M. 1993, ApJ, 413, 542
- Takano et al. (2005) Takano, S., Hofner, P., Winnewisser, G., Nakai, N., Kawaguchi, K. 2005, PASJ, 57, 549
- Thompson et al. (2006) Thompson, Todd A., Quataert, Eliot, Waxman, Eli, Murray, Norman, Martin, Crystal L. 2006, ApJ, 645, 186
- Torres (2004) Torres, D. F. 2004, ApJ, 617, 966
- Torres et al. (2012) Torres, D. F., Cillis, A., Lacki, B., & Rephaeli, Y. 2012, MNRAS, 423, 822
- Torres et al. (2010) Torres, D. F., Marrero, A. Y. R., & de Cea Del Pozo, E. 2010, MNRAS, 408, 1257
- Ulvestad (2000) Ulvestad, J. S. 2000, AJ, 120, 278
- Weiß et al. (2001) Weiß, A., Neininger, N., Hüttemeister, S., & Klein, U. 2001, A&A, 365, 571
- Williams & Bower (2010) Williams, P. K. G. & Bower, G. C. 2010, ApJ, 710, 1462


| M82 | NGC 253 | |||||
|---|---|---|---|---|---|---|
| range | TS | range | TS | |||
| (GeV) | ( MeV cm-2 s-1) | (GeV) | ( MeV cm-2 s-1) | |||
| 17 | 11 | |||||
| 24 | 25 | |||||
| 53 | 27 | |||||
| 36 | 20 | |||||
| 47 | 29 | |||||
| 16 | 25 | |||||
| 2.2 | 1.6 | |||||