Measurements of the polarisation amplitudes and triple product asymmetries in
Using 1 fb-1 of collision data collected at center of mass energy TeV during 2011 by the LHCb detector. Measurements of the triple product asymmetries, polarisation amplitudes and strong phase difference in the decay are presented.
1 Introduction
In the Standard Model the decay proceeds via a flavour changing neutral current process. In such processes contributions from beyond the Standard Model are possible via the introduction of new amplitudes or phases in the penguin loop. Hence studies of the polarisation amplitudes and triple product asymmetries in this mode provide important tests of the Standard Model.
The decay is a pseudoscalar to vector-vector transition. Therefore, there are three possible spin configurations of the vector mesons allowed by conservation of angular momentum. These can be written as linear polarisation states , and . The final state is a superposition of -even and -odd states. The longitudinal() and parallel() components are -even while the perpendicular() component is -odd.
Tree dominated decays such as are prominently longitudinally polarised while in penguin dominated decays such as and , roughly equal longitudinal and transverse components are observed. The predictions do suffer from large hadronic uncertainties.
To measure polarisation amplitudes, a time-integrated untagged angular analysis is performed. Due to fast oscillation of the meson an equal number of and are assumed at production. In addition, the violating phase is assumed to be zero, as predicted in Ref. . Under these assumptions, the differential decay width is given
| (1) |
where the helicity angles ) are defined in Fig. 1 and are the lifetimes for the light and heavy mass eigenstates respectively. The strong phase difference is defined as arg().
Non zero triple product asymmetries can be due to either T violation or final state interactions. The former, assuming conservation, implies is violated. In the decay two triple products can be constructed, denoted and , where the positive sign is taken if the T-even quantity and the negative sign otherwise. These correspond to the T-odd triple products
| (2) |
where (i = 1,2) is a unit vector perpendicular to the decay plane and is a unit vector in the direction of the momentum in the rest frame (see Fig. 1).
Extraction of the triple products is a simple counting experiment which does not require tagging the flavour of the meson or time dependence. The asymmetries are defined as
| (3) |
where () is the number of events with () and () is the number of events with (). The dataset used for these analyses consists of candidates in 1 fb-1 of data collected at the LHCb detector at a centre-of-mass energy TeV.
2 Candidate Selection
candidates are selected using events where both mesons decay into the final state . The candidate selection criteria were optimised using a data-driven approach based on the technique with the invariant mass of the four-kaon system as the discriminating variable to separate signal from background. The figure of merit to be optimised is where S (B) is signal (background) yield. Full details on the selection can be found in Ref. .
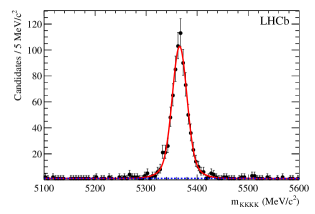
Figure 2 shows the four-kaon mass for selected events. An unbinned maximum likelihood fit is used to extract the signal yield. The signal component is modelled by two Gaussian functions with a common mean. The relative fraction and width of the second Gaussian are fixed to values obtained from simulation. Combinatoric background is modelled by an exponential function. Background from and is found to be negligible in both data-driven and simulation studies. Fitting this probability density function (PDF) yields signal events.
Data-driven studies to determine contributions from S-wave final states arising from and non-resonant yield results consistent with zero. The S-wave fraction is hence assumed to be zero in this analysis. A systematic error is assigned based on this assumption.
3 Results
| Source | ||||
|---|---|---|---|---|
| S-wave component | 0.007 | 0.005 | 0.012 | 0.001 |
| Decay time acceptance | 0.006 | 0.006 | 0.002 | 0.007 |
| Angular acceptance | 0.007 | 0.006 | 0.006 | 0.028 |
| Trigger category | 0.003 | 0.002 | 0.001 | 0.004 |
| Background model | 0.001 | - | 0.001 | 0.003 |
| Total | 0.012 | 0.010 | 0.014 | 0.029 |
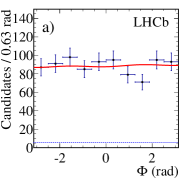
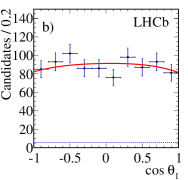
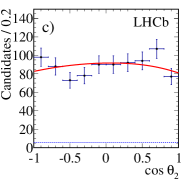
The polarisation amplitudes are determined by performing an unbinned maximum likelihood fit to the reconstructed mass and helicity angle distributions. Both the signal and background PDFs are the products of a mass component together with an angular component. The angular component of the signal is given by Eq. 1 multiplied by the angular acceptance of the detector, where the acceptance is determined using the simulation. The polarisation amplitudes are constrained such that . The angular distributions for the background have been studied using the mass sidebands in the data, these distributions are consistent with being flat in . A uniform angular PDF is therefore assumed for the background and more complicated shapes are considered as part of the systematic studies. The values of ps-1 and ps-1 together with their correlation coefficient of , as measured by LHCb, are used as a Gaussian constraint. The angular projections are shown in Fig. 3.
| Source | & uncertainty |
|---|---|
| Angular acceptance | 0.009 |
| Decay time acceptance | 0.014 |
| Fit model | 0.005 |
| Total |
To determine the triple product asymmetries, the dataset is partitioned according to whether U (V) is less than or greater than zero. Simultaneous fits are performed to the mass distributions for each of the two partitions. In these fits, the mean and resolution of the Gaussian signal component together with the slope of the exponential background component are common parameters. The asymmetries are left as free parameters and are fitted for directly in the simultaneous fit.
The measurements of the polarisation amplitudes and triple product asymmetries are summarised in Table 3. Several sources of systematic uncertainty are considered, summarised in Tables 1 and 2. The measured values agree well with previous measurements by the CDF collaboration. The triple product asymmetries are consistent with zero and hence no indication of T-odd asymmetries are observed with the present statistics.
| Parameter | Measurement |
|---|---|
| (stat.)(syst.) | |
| (stat.)(syst.) | |
| (stat.)(syst.) | |
| (stat.)(syst.) | |
| (stat.)(syst.) | |
| (stat.)(syst.) |
References
References
- [1] M. Gronau and J. L. Rosner, Phys. Rev. D 84, 096013 (2011).
- [2] W. Bensalem and D. London, Phys. Rev. D 64, 116003 (2001).
- [3] A. Datta and D. London, Int. J. Mod. Phys. A19, 2505 (2004).
- [4] B. A. et al., Phys. Rev. D 69, 031102 (2004).
- [5] B. A. et al., Phys. Rev. Lett. 97, 201801 (2006).
- [6] B. A. et al., Phys. Rev. Lett. 98, 051801 (2007).
- [7] K.-F. C. et al., Phys. Rev. Lett. 94, 221804 (2005).
- [8] J. R. M. Beneke and D. Yang, Nucl. Phys. B 774, 64 (2007).
- [9] H.-Y. Cheng and C.-K. Chua, Phys. Rev. D 80, 114026 (2009).
- [10] A. A. et al., Phys. Rev. D 76, 074018 (2007).
- [11] M. Raidal, Phys. Rev. Lett. 89, 231803 (2002).
- [12] A. A. A. J. et al., JINST 3, S08005 (2008).
- [13] M. Pivk and F. R. L. Diberder, Nucl. Instrum. Methods A 555, 356 (2005).
- [14] R. A. et al., LHCb-CONF-2011-052 (2011).
- [15] R. A. et al., Phys. Rev. Lett. 108, 101803 (2012).
- [16] D. E. A. et al., Phys. Rev. Lett. 95, 031801.