The GALEX Arecibo SDSS Survey
We present the second data release from the GALEX Arecibo SDSS Survey (GASS), an ongoing large Arecibo program to measure the Hi properties for an unbiased sample of 1000 galaxies with stellar masses greater than M⊙ and redshifts . GASS targets are selected from the Sloan Digital Sky Survey (SDSS) spectroscopic and Galaxy Evolution Explorer (GALEX) imaging surveys, and are observed until detected or until a gas mass fraction limit of a few per cent is reached. This second data installment includes new Arecibo observations of 240 galaxies, and marks the 50% of the complete survey. We present catalogs of the Hi, optical and ultraviolet parameters for these galaxies, and their Hi-line profiles. Having more than doubled the size of the sample since the first data release, we also revisit the main scaling relations of the Hi mass fraction with galaxy stellar mass, stellar mass surface density, concentration index, and NUV color, as well as the gas fraction plane introduced in our earlier work.
Key Words.:
Galaxies: fundamental parameters – Ultraviolet: galaxies – Radio lines: galaxies – Surveys – Catalogs1 Introduction
Studies of atomic hydrogen (Hi) in galaxies have proved to be of great importance in order to gain insights into some of the main physical processes that drive galaxy evolution (e.g., reviews by Roberts & Haynes 1994 and Sancisi et al. 2008; see also, e.g. Walter et al. 2008). In particular, quantifying how the gas content varies with star formation and structural properties of galaxies is of paramount importance for constraining models of galaxy formation. Equally important is to perform such studies on large and unbiased samples of galaxies, in order to obtain results that are truly representative of the local population. In the past few years we have been carrying out the GALEX Arecibo SDSS Survey (GASS; Catinella et al. 2010, hereafter Paper 1), which is designed to provide such a representative sample for massive galaxies, and whose aim is to understand the role played by gas in the transition between blue, star-forming galaxies and red, passively-evolving systems.
GASS uses the Arecibo telescope to measure the Hi properties of 1000 galaxies with stellar masses greater than M⊙ and redshifts . For these galaxies, we have homogeneous measurements of structural parameters from the Sloan Digital Sky Survey (SDSS; York et al. 2000), and ultraviolet (UV) photometry from GALEX (Martin et al. 2005) imaging. The availability of multi-wavelength data is essential in order to connect the atomic gas to the other galaxy components, and GASS is optimally configured for follow-up with a range of different telescopes. At , the angular diameters of GASS galaxies are small enough that accurate total CO fluxes can be obtained in a single pointing111 The FWHM of the IRAM 30m telescope beam is 22″ at 115 GHz. The optical diameters of GASS galaxies, estimated as twice the Petrosian radius that includes 90% of the r-band light from SDSS, are all smaller than 1′, with a mean of 24″. of the IRAM 30m telescope in the majority of cases (COLD GASS survey, Saintonge et al. 2011a). Most of the galaxies fit comfortably within a single SDSS frame and GALEX pointing, so that accurate photometry (and hence stellar masses and star formation rates) can be measured. The redshift range does mean, however, that a wide-area blind, shallow survey such as the Arecibo Legacy Fast ALFA (ALFALFA; Giovanelli et al. 2005) survey only detects the most Hi-rich galaxies. It has thus been necessary to target galaxies not detected by ALFALFA in order to measure Hi mass fractions down to a limit of 2-5%.
The combination of GASS on Arecibo, the COLD GASS follow-up on the IRAM 30m telescope (Saintonge et al. 2011a), and long-slit optical spectroscopy on the MMT telescope (Moran et al. 2010, 2012) has yielded a wealth of scientific results. We quantified the scaling relations between atomic and molecular gas fractions and global galaxy properties such as stellar mass, stellar mass surface density , NUV color and concentration parameter (Paper 1; Saintonge et al. 2011a). We showed that galaxies that are unusually Hi-rich for their color and have outer disks that are bluer (Wang et al. 2011), younger and more metal poor (Moran et al. 2010, 2012). We also investigated scaling relations between atomic and molecular content and star formation rates (Schiminovich et al. 2010; Saintonge et al. 2011b), and baryonic mass-velocity-size relations (Catinella et al. 2012). Thanks to our multi-wavelength legacy data set, which provides physical information about the stars and atomic, molecular and ionized gas in massive systems, we are gaining significant insight into differences in the evolutionary states of different galaxies, and setting important constraints for theoretical modeling efforts (e.g. Fu et al. 2010; Lagos et al. 2011; Davé et al. 2011; Kauffmann et al. 2012).
In this paper we present the second data release of GASS, which marks 50% of the full survey. We use the improved statistics to revisit the gas fraction scaling relations explored in Paper 1, and discuss apparent deviations from linearity that were not evident in the first data release sample, which included 20% of the full survey.
All the distance-dependent quantities in this work are computed assuming , and km s-1 Mpc-1. AB magnitudes are used throughout the paper.
2 Sample selection, observations and data processing
Survey design, sample selection, Arecibo observations and data reduction are described in detail in Paper 1, thus we only provide a summary here, including relevant updates.
GASS measures the global Hi properties of 1000 galaxies, selected uniquely by their stellar mass () and redshift (). The galaxies are located within the intersection of the footprints of the SDSS primary spectroscopic survey, the projected GALEX Medium Imaging Survey and ALFALFA. We defined a GASS parent sample, based on SDSS DR6 (Adelman-McCarthy et al. 2008) and the final ALFALFA footprint, which includes 12006 galaxies that meet our survey criteria. The targets for 21cm observations are chosen by randomly selecting a subset of the parent sample which balances the distribution across stellar mass and which maximizes existing GALEX exposure time.
We observe the galaxies with the Arecibo radio telescope until we detect them or until we reach a limit of a few percent in gas mass fraction (defined as / in this work). Practically, we have set a limit of for galaxies with , and a constant gas mass limit for galaxies with smaller stellar masses. This corresponds to a gas fraction limit for the whole sample. Given the Hi mass limit assigned to each galaxy (set by its gas fraction limit and stellar mass), we computed the observing time, , required to reach that value with our observing mode and instrumental setup (see below). We exclude from our sample any galaxies requiring more than 3 hours of total integration time (this effectively behaves like a redshift cut at the lowest stellar masses). As mentioned in Paper 1, we do not re-observe galaxies with good detections already available from ALFALFA and/or the Cornell Hi digital archive (Springob et al. 2005, hereafter S05), a homogeneous compilation of Hi parameters for 9000 optically-selected galaxies.
GASS observations started in March 2008 and are expected to be completed in 2012. Together with the first data release (DR1, Paper 1), the data published in this paper amount to 50% of the final survey sample, and were obtained by the end of February 2011, with a total allocation of 572 hours of telescope time (of which 13% unusable due to radio frequency interference [RFI] or other technical problems). Arecibo observations are carried out remotely in standard position-switching mode (i.e. each observation consists of an on/off source pair, each typically integrated for 5 minutes, followed by the firing of a calibration noise diode). We use the L-band wide receiver and the interim correlator, and record the spectra every second with 9-level sampling. Two correlator boards with 12.5 MHz bandwidth, one polarization, and 2048 channels per spectrum (yielding a velocity resolution of 1.4 km s-1 at 1370 MHz before smoothing) are centered at or near the frequency corresponding to the SDSS redshift of the target; two other boards are used for RFI monitoring.
The data reduction, performed in the IDL environment, includes the following steps (for each on/off pair and polarization): Hanning smoothing, bandpass subtraction, RFI excision, and flux calibration. The spectra obtained from each pair are weighted by 1/, where is the root mean square noise measured in the signal-free portion of the spectrum, and co-added. The two orthogonal linear polarizations are inspected (if present, polarization mismatches are noted in Appendix B) and averaged. The final spectrum is boxcar smoothed, baseline subtracted (we fitted a low-order polynomial, , for 80% of our sample; only 6% of the spectra required ), and measured as described in Paper 1. The only difference with respect to DR1 is the estimate of the instrumental broadening correction for the velocity widths. Measured Hi linewidths, , are corrected as follows:
| (1) |
where is the galaxy redshift and is the instrumental broadening correction, which for DR1 was taken to be the final velocity resolution of the spectrum after smoothing (i.e., between 5 and 21 km s-1). As explained in Catinella et al. (2012, section 2.1), we decided to adopt , which is in better agreement with other work (e.g. Courtois et al. 2009) and with our own tests on high signal-to-noise GASS Hi profiles. Updated values for the DR1 linewidths can be simply obtained from Table 2 of Paper 1 by applying equation 1 to (column 7) with (column 5).
3 The second data release
This second data release is incremental over DR1, and includes new Arecibo observations of 240 galaxies. Here we present optical, UV and 21 cm parameters for these objects, and illustrate the main characteristics of the combined DR1+DR2 sample in the following section. The catalogs presented below are available for the combined DR1 and DR2 samples on the GASS website222 http://www.mpa-garching.mpg.de/GASS/data.php .
3.1 SDSS and GALEX data
This section summarizes the quantities derived from optical and UV data used in this paper. All the optical parameters listed below were obtained from Structured Query Language (SQL) queries to the SDSS DR7 database server333 http://cas.sdss.org/dr7/en/tools/search/sql.asp , unless otherwise noted.
The GALEX UV photometry for our sample was reprocessed by us, as explained in Wang et al. (2010) and summarized in Paper 1. Briefly, we produced NUV images by registering GALEX and SDSS frames, and convolving the latter to the UV point spread function. The measured NUV colors are corrected for Galactic extinction following Wyder et al. (2007), from which we obtained (where the extinction is available from the SDSS data base and reported in Table LABEL:t_sdss below). We do not apply internal dust attenuation corrections.
Table LABEL:t_sdss lists the relevant SDSS and UV quantities for the GASS
objects published in this work, ordered by increasing right ascension:
Cols. (1) and (2): GASS and SDSS identifiers.
Col. (3): UGC (Nilson 1973), NGC (Dreyer 1888) or IC (Dreyer 1895, 1908)
designation, or other name, typically from
the Catalog of Galaxies and Clusters of Galaxies (CGCG; Zwicky et al. 1961),
or the Virgo Cluster Catalog (VCC; Binggeli et al. 1985).
Col. (4): SDSS redshift, . The typical uncertainty of
SDSS redshifts for this sample is 0.0002.
Col. (5): base-10 logarithm of the stellar mass, , in solar
units. Stellar masses are derived from SDSS photometry using the
methodology described in Salim et al. (2007) (a Chabrier 2003
initial mass function is assumed).
Over our required stellar mass range, these values are
believed to be accurate to better than 30%.
Col. (6): radius containing 50% of the Petrosian flux in z-band, ,
in arcsec.
Cols. (7) and (8): radii containing 50% and 90% of the Petrosian
flux in r-band, and respectively, in arcsec (for
brevity, we omit the subscript “” from these quantities
throughout the paper).
Col. (9): base-10 logarithm of the stellar mass surface density, , in
M⊙ kpc-2. This quantity is defined as
, with in kpc units.
Col. (10): Galactic extinction in r-band, extr, in magnitudes, from SDSS.
Col. (11): r-band model magnitude from SDSS, , corrected for Galactic extinction.
Col. (12): minor-to-major axial ratio from the exponential
fit in r-band, , from SDSS.
Col. (13): inclination to the line-of-sight, in degrees, computed as follows:
| (2) |
where is listed in the previous column, and is the
intrinsic axial ratio of a galaxy seen edge-on. We adopt
and set the inclination to 90∘ for galaxies with (see
Catinella et al. 2012 and discussion therein). However we provide also
to allow different estimates of the inclination.
Col. (14): NUV observed color from our reprocessed photometry,
corrected for Galactic extinction.
Col. (15): exposure time of GALEX NUV image, TNUV, in seconds.
Col. (16): maximum on-source integration time, , required to
reach the limiting Hi mass fraction, in minutes (see § 2).
Given the Hi mass limit and redshift of each galaxy, is
computed assuming a 5 signal with 300 km s-1 velocity width and
the instrumental parameters typical of our observations (i.e., gain
10 K Jy-1 and system temperature 28 K at 1370 MHz).
3.2 Hi source catalogs
The DR2 sample includes 133 detections and 107 non-detections, for which we provide upper limits below.
The measured Hi parameters for the detected
galaxies are listed in Table LABEL:t_det, ordered by increasing right ascension:
Cols. (1) and (2): GASS and SDSS identifiers.
Col. (3): SDSS redshift, .
Col. (4): on-source integration time of the Arecibo
observation, , in minutes. This number refers to
on scans that were actually combined, and does not account for
possible losses due to RFI excision (usually negligible).
Col. (5): velocity resolution of the final, smoothed spectrum in km s-1.
Col. (6): redshift, , measured from the Hi spectrum.
The error on the corresponding heliocentric velocity, ,
is half the error on the width, tabulated in the following column.
Col. (7): observed velocity width of the source line profile
in km s-1, , measured at the 50% level of each peak.
The error on the width is the sum in quadrature of the
statistical and systematic uncertainties in km s-1. Statistical errors
depend primarily on the signal-to-noise of the Hi spectrum, and are
obtained from the rms noise of the linear fits to the edges of the
Hi profile. Systematic errors depend on the subjective choice of the
Hi signal boundaries (see Paper 1), and are negligible for most of
the galaxies in our sample (see also Appendix B).
Col. (8): velocity width corrected for instrumental broadening
and cosmological redshift only, c, in km s-1 (see equation
1). No inclination or turbulent motion corrections are applied.
Col. (9): observed, integrated Hi-line flux density in Jy km s-1,
, measured on the smoothed and baseline-subtracted
spectrum. The reported uncertainty is the sum in quadrature of the
statistical and systematic errors (see col. 7).
The statistical errors are calculated according to equation 2 of S05:
where is the noise measured in the signal-free part of the
spectral baseline (see col. 10), is the velocity resolution
of the smoothed spectrum (see col. 5), and the factor 2 accounts for
the contribution from uncertainties in the baseline fit (following
Schneider et al. 1990).
Col. (10): rms noise of the observation in mJy, measured on the
signal- and RFI-free portion of the smoothed spectrum.
Col. (11): signal-to-noise ratio of the Hi spectrum, S/N,
estimated following Saintonge (2007) and adapted to the velocity
resolution of the spectrum.
This is the definition of S/N adopted by ALFALFA, which accounts for the
fact that for the same peak flux a broader spectrum has more signal.
Col. (12): base-10 logarithm of the Hi mass, , in solar
units, computed via:
| (3) |
where is the luminosity distance to the galaxy at
redshift as measured from the Hi spectrum.
Col. (13): base-10 logarithm of the Hi mass fraction, /.
Col. (14): quality flag, Q (1=good, 2=marginal, 3=marginal and
confused, 5=confused). An asterisk indicates the presence of a note
for the source in Appendix B.
Code 1 indicates reliable detections, with a S/N ratio of order of
6.5 or higher (this is the same threshold adopted by ALFALFA).
Marginal detections have lower S/N, thus more uncertain
Hi parameters, but are still secure detections, with Hi redshift
consistent with the SDSS one.
The S/N limit is not strict, but depends also on Hi profile and baseline
quality. As a result, galaxies with S/N slightly above the threshold
but with uncertain profile or bad baseline may be flagged with a
code 2, and objects with S/N and Hi profile with
well-defined edges may be classified as code 1.
We assigned the quality flag 5 to eighteen “confused” galaxies, where
most of the Hi emission is believed to come from another source
within the Arecibo beam. For some of the galaxies, the presence of
small companions within the beam might contaminate (but is unlikely to
dominate) the Hi signal – this is just noted in Appendix B.
Finally, we assigned code 3 to twelve galaxies, which are both marginal and
confused.
Table LABEL:t_ndet gives the derived Hi upper limits for the non-detections.
Columns (1-4) and (5) are the same as columns (1-4) and (10) in Table LABEL:t_det,
respectively. Column (6) lists the upper limit on the Hi mass in
solar units, Log ,lim, computed assuming a 5 signal with 300 km s-1 velocity width, if the spectrum was smoothed to 150 km s-1. Column (7)
gives the corresponding upper limit on the gas fraction, Log ,lim/.
An asterisk in Column (8) indicates the presence of a note for the
galaxy in Appendix B.
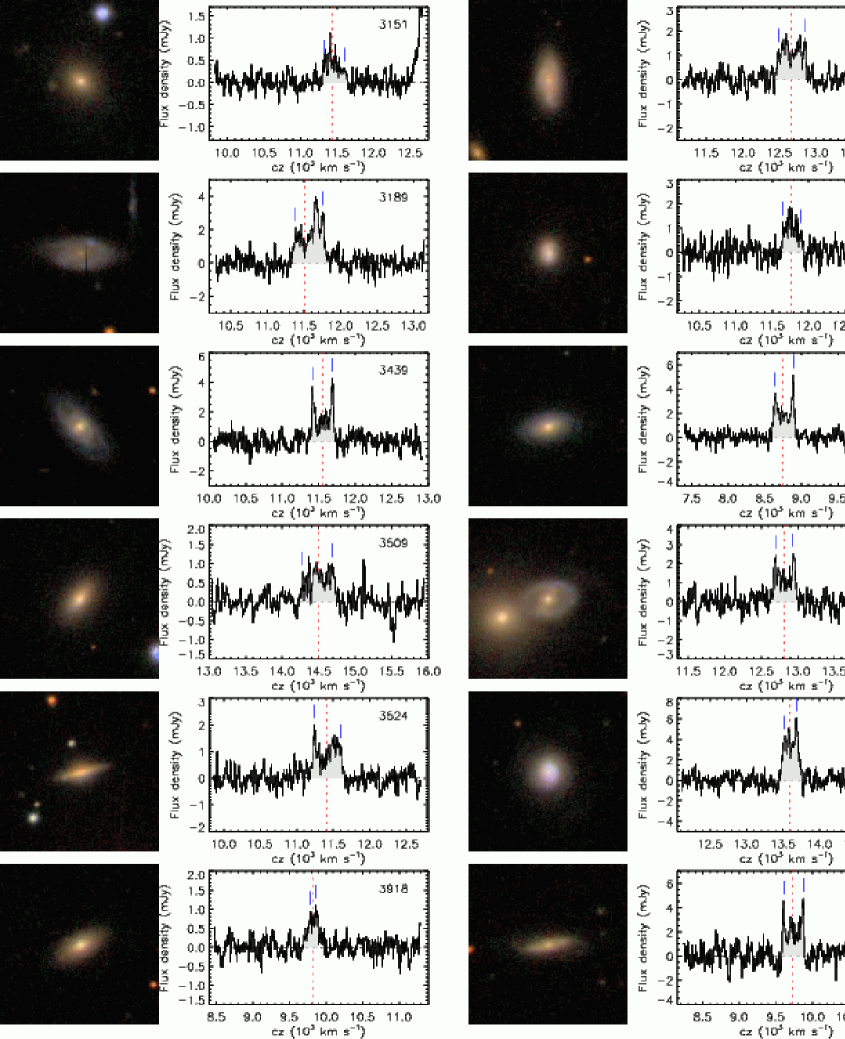
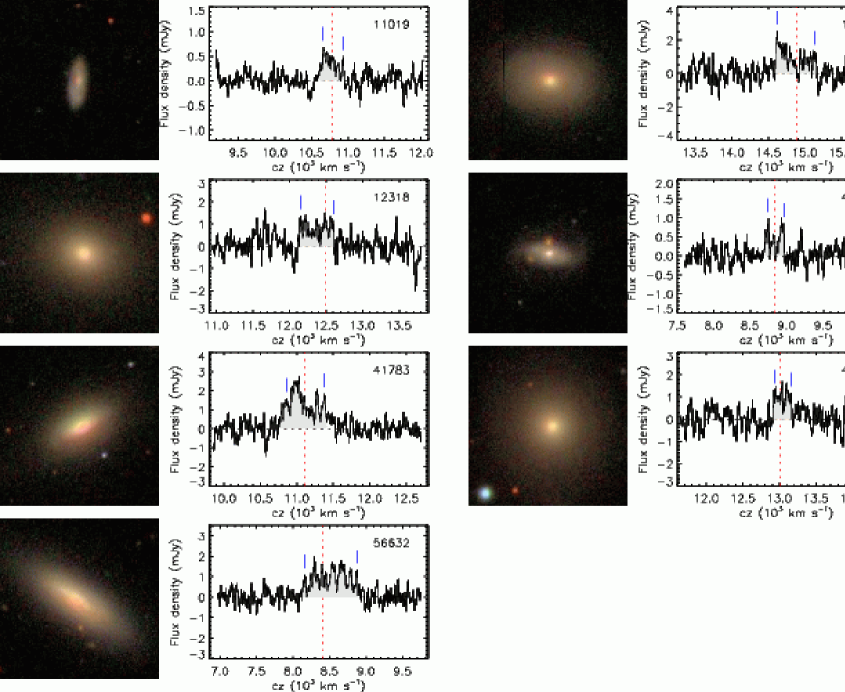
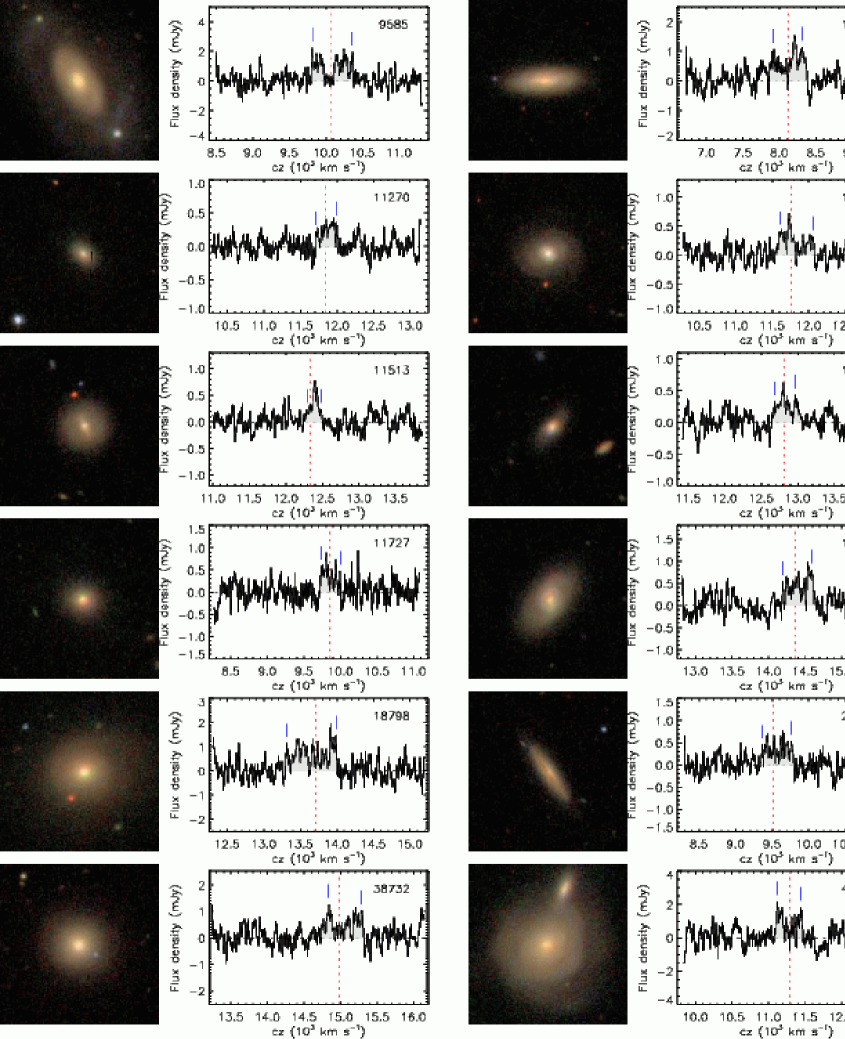
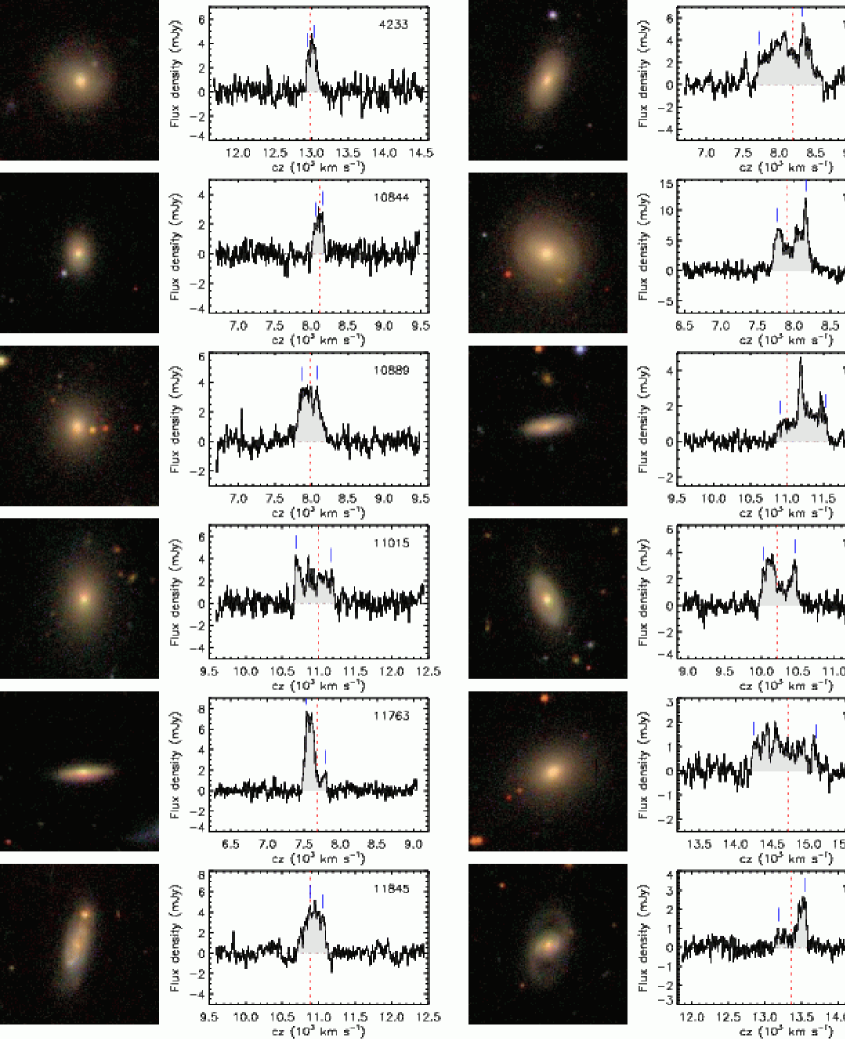
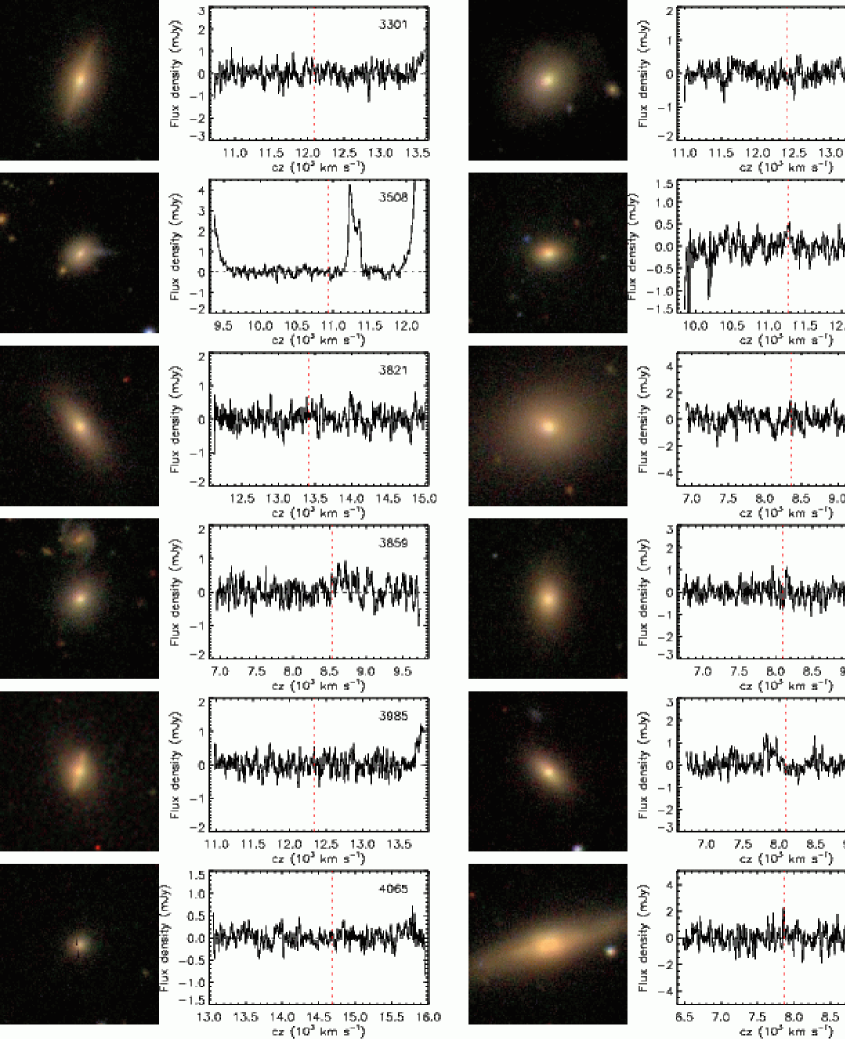
SDSS images and Hi spectra of the DR2 galaxies are presented in Appendix A, organized as follows: Hi detections with quality flag 1 in Table LABEL:t_det (Figure 8), marginal detections with quality flag 2 (Figure 2) and 3 (Figure 3), confused detections (Figure 4) and non-detections (Figure 5). The objects in each of these figures are ordered by increasing GASS number (indicated on the top right corner of each spectrum). The SDSS images show a 1 arcmin square field, i.e. only the central part of the region sampled by the Arecibo beam (the half power full width of the beam is 3.5′ at the frequencies of our observations). Therefore, companions that might be detected in our spectra typically are not visible in the postage stamps, but they are noted in Appendix B. The Hi spectra are always displayed over a 3000 km s-1 velocity interval, which includes the full 12.5 MHz bandwidth adopted for our observations. The Hi-line profiles are calibrated, smoothed (to a velocity resolution between 5 and 21 km s-1 for the detections, as listed in Table LABEL:t_det, or to 15 km s-1 for the non-detections), and baseline-subtracted. A red, dotted line indicates the heliocentric velocity corresponding to the optical redshift from SDSS. In Figures 8-4, the shaded area and two vertical dashes show the part of the profile that was integrated to measure the Hi flux and the peaks used for width measurement, respectively.
4 GASS sample properties
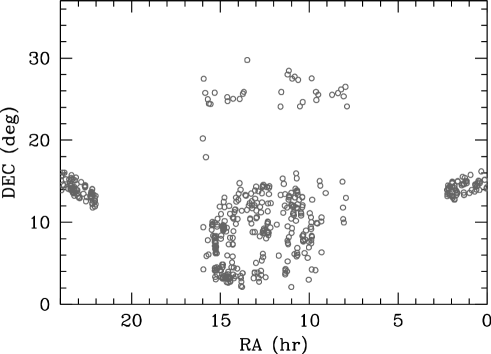
Taken together, the first and second GASS data releases include 416 galaxies, of which 232 are Hi detections and 184 are non-detections. We will refer to this as the GASS observed sample. Because we do not reobserve galaxies with good Hi detections already available from either ALFALFA or the S05 archive, this data set lacks the most gas-rich objects, which need to be added back in the correct proportions. By following the procedure described in section 7.2 of Paper 1, we obtained a sample that includes 480 galaxies (of which 296 are detections) and that is representative in terms of Hi properties. We will refer to this as the GASS representative sample. Notice that, because of the improved statistics compared to DR1, here we use only one such representative sample (as opposed to a suite of 100 realizations, differing for the set of randomly-selected gas-rich galaxies added to the GASS observations).
The sky distribution of the representative sample is shown in Figure 1. We restricted the observations as much as possible to the two declination intervals from ∘ to ∘ and from ∘ to ∘, for which ALFALFA catalogs were available to us in advance of publication (Haynes et al. 2011). The uneven right ascension distribution is the result of telescope allocation, which favored small observing session at LST intervals less oversubscribed (such as 1416 hours).
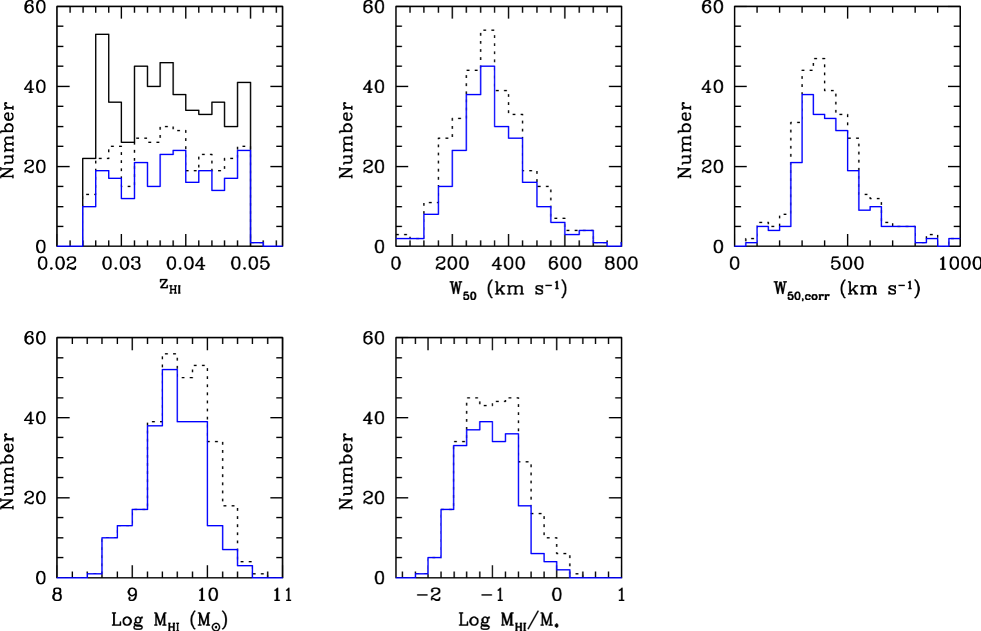
The Hi properties of the detected galaxies are illustrated in Figure 2 for both observed (blue histograms) and representative (dotted) samples. The solid black histogram in the top left panel shows the redshift distribution for the full representative sample, using the SDSS redshifts for the non-detections. As for the DR1 sample presented in Paper 1, the distribution of corrected velocity widths (which have not been deprojected to edge-on view) peaks near 300 km s-1, which is the value that we assume to compute upper limits for the Hi masses of the non-detections, and to estimate in Table LABEL:t_sdss.
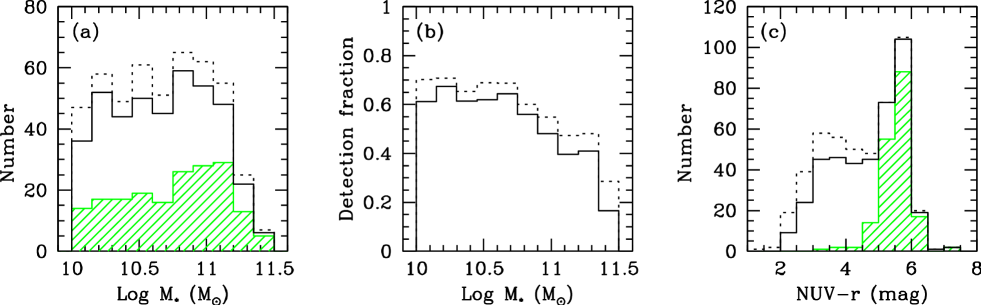
Figure 3 presents the stellar mass (a) and NUV color (c) distributions for the observed (black histogram) and representative (dotted) samples. The corresponding distributions for the non-detections are shown as hatched green histograms. The stellar mass histogram is almost flat by survey design, as we wish to obtain similar statistics in each bin in order to perform comparisons at fixed stellar mass. As already noted in Paper 1, non-detections span the entire range of stellar masses, but they are concentrated in the red portion of the NUV space. The detection fraction, i.e. the ratio of detected galaxies to total, is plotted as a function of stellar mass in (b). The detection fraction is close to 70% for M⊙, and drops to 30% in the highest stellar mass bin.
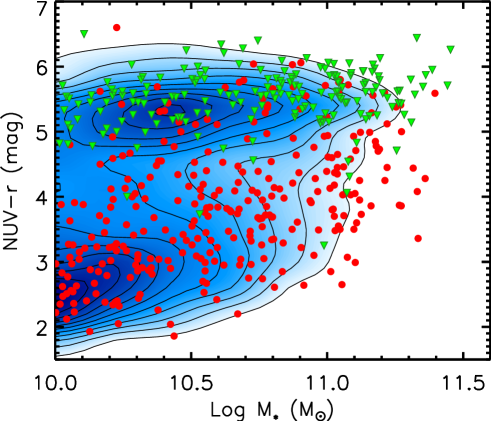
The NUV color-stellar mass diagram shown in Figure 4 combines the information contained in Figures 3a and 3c. In order to clearly indicate the loci of the blue cloud and red sequence, we use the GASS parent sample mentioned in § 2, which is the complete set of 12,006 galaxies that meet our selection criteria. The locations of these galaxies in the diagram are shown by the grayscales; the red sequence peaks at NUV5.5 mag, and the blue cloud is mostly confined to NUV mag. The results for the GASS representative sample are indicated by red and green symbols. GASS non-detections are almost entirely confined to the red sequence. We note that, because we select targets with an approximately flat stellar mass distribution (see Section 2 and Fig. 3), we oversample the high stellar mass galaxies, which are more rare in a volume-limited survey. Hence the distribution of our representative sample in the color-stellar mass diagram is somewhat offset toward higher values compared to that of the GASS parent sample.
5 Gas fraction scaling relations
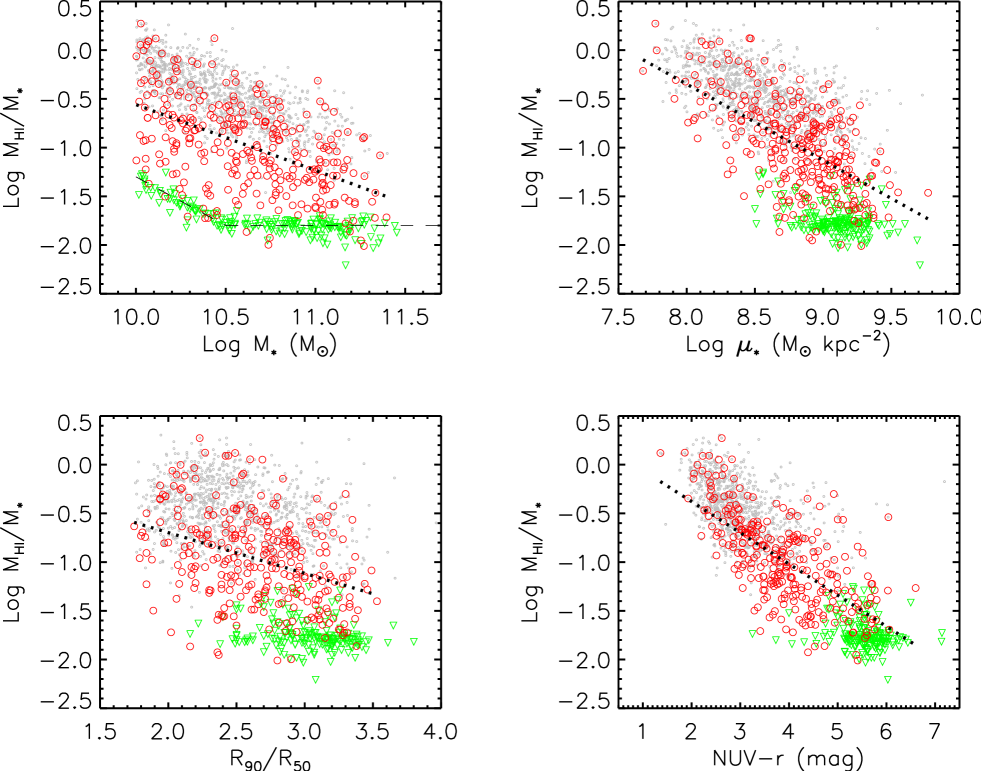
The updated versions of the scaling relations investigated in Paper 1 are presented in Figures 5 and 6. We describe the figures first, and discuss them together afterward.
Clockwise from the top left, Figure 5 shows how the gas mass fraction / depends on stellar mass, stellar mass surface density, observed NUV color and concentration index for the GASS representative sample. Red circles and green upside-down triangles indicate Hi detections and non-detections (plotted at their upper limits), respectively. ALFALFA detections of galaxies in the parent sample (1102 objects in total), whose Hi masses have been computed consistently with GASS ones from the fluxes tabulated by Haynes et al. (2011), are shown as gray dots for comparison. Dotted lines in each panel are linear fits to the detections, which we use only to quantify the scatter .
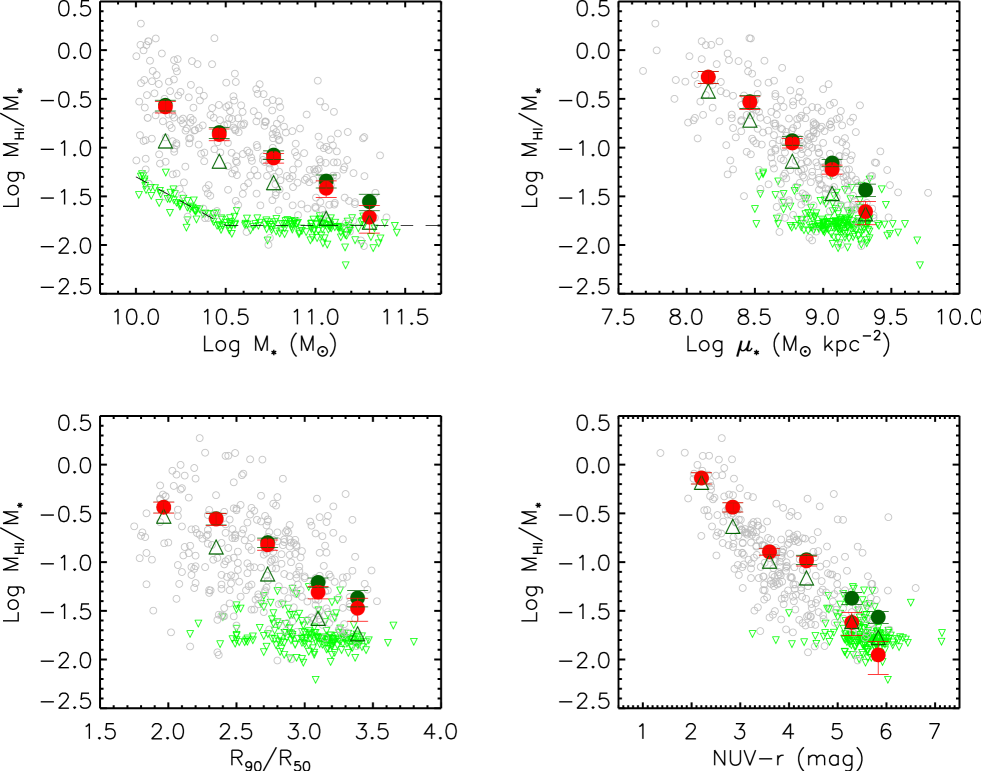
The average values of the gas fraction are plotted as a function of the same quantities in Figure 6. Gray and green symbols reproduce individual GASS detections and non-detections, respectively, from Figure 5. The averages are computed including the non-detections, whose Hi masses were set either to their upper limits (green circles) or to zero (red circles). As in Paper 1, these averages are weighted in order to compensate for the flat stellar mass distribution of the GASS sample, using the volume-limited parent sample as a reference. Briefly, we binned both the parent sample and the GASS representative sample by stellar mass (with a 0.2 dex step), and used the ratio between the two histograms as a weight. Error bars indicate the standard deviation of the weighted averages. Lastly, weighted median values of the gas fraction, calculated using upper limits for the Hi masses of the non-detections, are plotted as green triangles. The values of weighted average and median gas fractions shown in this figure are listed in Table 1 for reference.
These results are consistent with our previous findings
(see also Fabello et al. 2011 and Cortese et al. 2011), and show that:
– The gas fraction of GASS detections is a decreasing function of
stellar mass, stellar mass surface density, and NUV color.
The scatters around the linear fits to these relations are unchanged
with respect to DR1 ( and 0.33 dex, respectively),
despite the fact that the sample size has more than doubled (from
200 to 480 galaxies).
– The strongest correlation is with observed NUV color
(Pearson correlation coefficient ); the
average / decreases from 73% to 2% from the bluest to the
reddest galaxies. The decrease quoted in Paper 1 was smaller because,
due to poorer statistics, we did not have enough observations below
NUV mag to compute an average gas fraction.
Given the link between star formation rate and gas content, the strong
correlation between NUV and gas fraction is expected, though as we
note further below and in the next section, departures from a tight,
linear correlation may result from contributions to UV light from an
older population, or alternatively, diminished UV from dust
attenuation.
– The weakest correlations are with stellar mass ()
and concentration index (; the scatter is dex, it was 0.45 dex for the DR1 sample). In both cases, the
difference between average and median gas fractions points to the
presence of significant tails of galaxies with small values of
/. The relation between gas fraction and stellar mass
surface density has a correlation coefficient .
– All the non-detections have stellar mass surface density
M⊙ kpc-2. The average gas fractions are
insensitive to the way we treat the non-detections, except for the
very most massive, dense and red galaxies.
– In the GASS stellar mass and redshift intervals, ALFALFA only
detects the bluest, most gas-rich objects.
With our improved statistics, the relation between gas fraction and NUV color for the detections now seems to show a break at NUV3.5 mag, which corresponds approximately to the upper envelope of the blue sequence (see Figure 4). The galaxies with the highest gas fractions systematically lie above the linear fit to the detections (Figure 5). This can be seen also in Figure 6, if we focus on the bins that are not dominated by the non-detections. Interestingly, including the non-detections in the computation of the average gas fractions restores the linearity of the relation with NUV color. This agrees with the results based on the Herschel Reference Survey (HRS; Boselli et al. 2010) sample, which is more local and thus probes significantly lower gas fractions than GASS. The HRS / versus NUV relation does not show any evidence for a change of slope (see Fig. 1 of Cortese et al. 2011), but only an increase of scatter outside the blue sequence, which we observe as well. We will come back to this point in the next section.
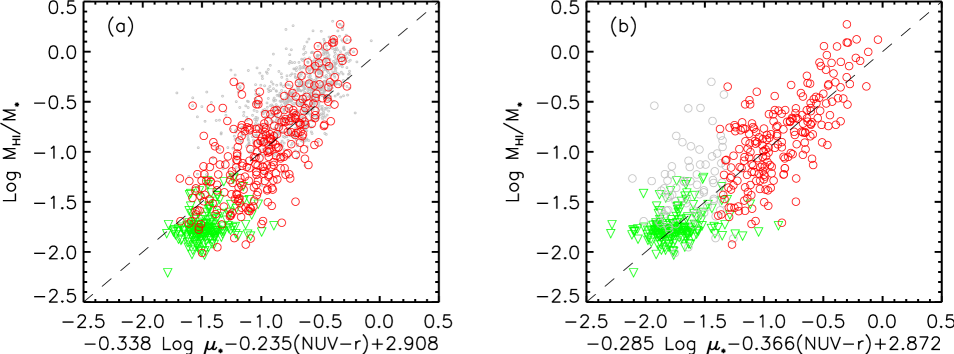
6 Gas fraction plane
In Paper 1 we introduced the gas fraction plane, a relation between gas mass fraction and a linear combination of NUV color (which is a proxy for star formation rate per unit stellar mass) and stellar mass surface density, which can be used to define what is “Hi normalcy” for local massive, star-forming galaxies. As discussed by Zhang et al. (2009), such a relation is a direct consequence of the Kennicutt-Schmidt global star formation law (Schmidt 1963; Kennicutt 1998) if one assumes that star formation and gas densities are computed over the same spatial area — thus it is physically motivated. Figure 7a shows the result for the GASS representative sample. We remind the reader that the best fit relation is obtained following Bernardi et al. (2003) (i.e., this is the solution that minimizes the scatter on the coordinate, and therefore it is equivalent to a direct fit), and that only Hi detections (red circles) are used. The coefficients of the fit (reported on the axis of the figure) and the rms scatter in Log /, 0.319 dex, are almost unchanged with respect to the DR1 solution, showing that the 20% survey sample was indeed representative. The Pearson correlation coefficient for the relation shown in Figure 7a is .
We note that Li et al. (2012) presented a slightly different solution for this gas fraction plane (see their Fig. 2), obtained by weighting each galaxy by the mass-dependent selection function of GASS. However, the weights make negligible difference to the result (they obtain Log / Log NUV, with identical scatter, 0.32 dex).
Our gas fraction plane is also consistent with the one based on the HRS sample, when this is restricted to the Hi-normal galaxies (i.e., when Hi-deficient systems in the Virgo cluster are excluded; see Cortese et al. 2011). This agreement is a non-trivial result, given the different selection criteria and data sets of the two surveys. Notice however that the scatter of the HRS plane is smaller (0.27 dex, see below).
As can be seen in Figure 7a, the highest gas fraction galaxies lie systematically above the mean relation, indicated by a dashed line. This is the same deviation from linearity discussed for the / versus NUV relation in the previous section. As already noted, the apparent break of the gas fraction-color relation seen for the Hi detections is linked to the gas fraction limit of GASS. Indeed the break effectively disappears when non-detections are included in the averages, and a similar discontinuity is not seen for the HRS sample, which probes significantly lower gas fractions.
Because the gas fraction plane is computed using only detections, its validity breaks down in the region where the contribution of the non-detections becomes important. Thus, a more reliable solution for the plane can be obtained by using only galaxies with NUV mag, where we have virtually only detections (this is a conservative threshold based on the inspection of Figure 3c). This cut has the additional advantage of excluding a region of parameter space that is problematic for two reasons. First, outside the blue sequence, the UV emission might not be physically associated to the Hi, but might trace a more evolved stellar population, and thus NUV might no longer be a good proxy for specific star formation rate (see also O’Connell 1999; Boselli et al. 2005; Cortese & Hughes 2009). This increases the scatter of the gas fraction-color relation outside the blue sequence. Second, both NUV and saturate, i.e. they never exceed NUV6 mag and Log 9.5 M⊙ kpc-2. This will introduce an apparent non-linearity in the relations involving gas fraction regardless of Hi content.
The gas fraction plane computed using only galaxies with NUV mag is shown in Figure 7b: the relation becomes more linear, but clearly the scatter of the redder galaxies (shown in gray) increases. Importantly, the main outliers remain the same. The scatter of the plane in Figure 7b is 0.29 dex over the subset of galaxies used for its computation (and 0.32 dex when all detections are included), which better agrees with the scatter of the HRS plane (0.27 dex).
We note that the GASS DR1 sample included too few galaxies on the top right corner of the plane to notice a clear deviation for the galaxies with the highest gas fractions. Our improved statistics allows us to look now into second order corrections, such as the one suggested above. Naturally, one has to keep in mind that the relation used to predict gas fractions has only a statistical validity, and should not be trusted for an individual galaxy.
Another approach to obtain a better prediction for the gas fractions of the galaxies with the highest values of and/or / is to correct the non-linearity by adding degrees of freedom when fitting the plane (although this is no longer physically justified by the Kennicutt-Schmidt star formation law). As shown by Wang et al. (2011), gas-rich galaxies tend to have bluer-than-average outer disks. Thus, Li et al. (2012) advocate that a new gas fraction estimator that includes two additional parameters, stellar mass and color gradient (defined as the difference between outer and inner color), yields a better fit to the Hi-rich galaxies. However, over the GASS stellar mass regime, the scatter decreases very little (from 0.32 to 0.31 dex, see their Figure 2).
| / | |||||
|---|---|---|---|---|---|
| (average)a | (average)b | (median)c | |||
| Log | 10.16 | 0.2720.034 | 0.2620.035 | 0.117 | 105 |
| 10.46 | 0.1430.018 | 0.1360.019 | 0.072 | 110 | |
| 10.77 | 0.0840.009 | 0.0780.009 | 0.044 | 116 | |
| 11.06 | 0.0450.007 | 0.0380.007 | 0.019 | 117 | |
| 11.30 | 0.0280.005 | 0.0190.006 | 0.017 | 32 | |
| Log | 8.16 | 0.5300.075 | 0.5300.075 | 0.380 | 24 |
| 8.46 | 0.2960.045 | 0.2910.046 | 0.191 | 50 | |
| 8.77 | 0.1180.012 | 0.1120.012 | 0.072 | 119 | |
| 9.07 | 0.0690.006 | 0.0600.006 | 0.034 | 193 | |
| 9.31 | 0.0370.005 | 0.0220.006 | 0.021 | 81 | |
| 1.97 | 0.3660.047 | 0.3660.047 | 0.296 | 33 | |
| 2.35 | 0.2790.039 | 0.2760.039 | 0.143 | 91 | |
| 2.73 | 0.1590.018 | 0.1500.018 | 0.076 | 137 | |
| 3.10 | 0.0620.007 | 0.0490.007 | 0.026 | 176 | |
| 3.39 | 0.0430.008 | 0.0340.009 | 0.018 | 42 | |
| NUV | 2.20 | 0.7300.096 | 0.7300.096 | 0.659 | 15 |
| 2.85 | 0.3660.040 | 0.3660.040 | 0.233 | 65 | |
| 3.60 | 0.1280.010 | 0.1270.010 | 0.102 | 91 | |
| 4.36 | 0.1060.012 | 0.1030.012 | 0.069 | 79 | |
| 5.29 | 0.0430.006 | 0.0240.006 | 0.025 | 123 | |
| 5.83 | 0.0270.004 | 0.0110.004 | 0.017 | 94 |
Notes. — aWeighted, average gas fraction; Hi mass of non-detections set to upper limit.
bWeighted, average gas fraction; Hi mass of non-detections set to zero.
cWeighted, median gas fraction; Hi mass of non-detections set to upper limit.
dNumber of galaxies in the bin.
7 Conclusions
This paper presents the second data release of GASS, an ongoing large Arecibo program to measure Hi parameters for 1000 massive galaxies, selected from the SDSS spectroscopic and GALEX imaging surveys. This release is incremental over the first one (Paper 1), and includes new Hi observations for 240 galaxies. The representative sample presented here, which was obtained by adding the correct proportion of Hi-rich objects detected by ALFALFA or in the S05 archive that we did not re-observe with Arecibo, includes 480 galaxies, and marks the 50% of the full survey.
We discussed the properties of the 50% survey sample, and used it to revisit the scaling relations between gas mass fraction and galaxy structural parameters and color, as well as the gas fraction plane, presented in Paper 1. Overall our results confirm our previous findings, which were based on the initial 20% survey sample, and with almost identical scatters. However, the significantly improved statistics also allowed us to notice second-order effects, in the form of a systematic deviation of the high gas fraction tail in the / versus NUV and gas fraction plane relations. We identify the cause for such a deviation in the sensitivity limit of GASS, which is a gas fraction limited survey. Above a NUV color of 4.5 mag, the results are dominated by the non-detections, which seem to cause an apparent break in the gas fraction versus color relation. As a result, the gas fraction plane slightly underpredicts / at the high end. Possible solutions include fitting the plane where the relation between gas fraction and NUV is not dominated by the non-detections, or include additional parameters to the fit.
The new catalogs of Hi, optical and UV parameters presented in this
work increase the legacy value of GASS, and place our investigations
of what physical processes are responsible for the transition between
blue, star-forming galaxies and red, passively-evolving systems on a
statistically more solid ground.
Acknowledgements.
We thank the anonymous referee for useful suggestions. This research has made use of the NASA/IPAC Extragalactic Database (NED) which is operated by the Jet Propulsion Laboratory, California Institute of Technology, under contract with the National Aeronautics and Space Administration. The Arecibo Observatory is operated by SRI International under a cooperative agreement with the National Science Foundation (AST-1100968), and in alliance with Ana G. Méndez-Universidad Metropolitana, and the Universities Space Research Association. GALEX (Galaxy Evolution Explorer) is a NASA Small Explorer, launched in April 2003. We gratefully acknowledge NASA’s support for construction, operation, and science analysis for the GALEX mission, developed in cooperation with the Centre National d’Etudes Spatiales (CNES) of France and the Korean Ministry of Science and Technology. Funding for the SDSS and SDSS-II has been provided by the Alfred P. Sloan Foundation, the Participating Institutions, the National Science Foundation, the U.S. Department of Energy, the National Aeronautics and Space Administration, the Japanese Monbukagakusho, the Max Planck Society, and the Higher Education Funding Council for England. The SDSS Web Site is http://www.sdss.org/. The SDSS is managed by the Astrophysical Research Consortium for the Participating Institutions. The Participating Institutions are the American Museum of Natural History, Astrophysical Institute Potsdam, University of Basel, University of Cambridge, Case Western Reserve University, University of Chicago, Drexel University, Fermilab, the Institute for Advanced Study, the Japan Participation Group, Johns Hopkins University, the Joint Institute for Nuclear Astrophysics, the Kavli Institute for Particle Astrophysics and Cosmology, the Korean Scientist Group, the Chinese Academy of Sciences (LAMOST), Los Alamos National Laboratory, the Max-Planck-Institute for Astronomy (MPIA), the Max-Planck-Institute for Astrophysics (MPA), New Mexico State University, Ohio State University, University of Pittsburgh, University of Portsmouth, Princeton University, the United States Naval Observatory, and the University of Washington.References
- Adelman-McCarthy et al. (2008) Adelman-McCarthy, J. K., Agüeros, M. A., Allam, S. S., et al. 2008, ApJS, 175, 297
- Bernardi et al. (2003) Bernardi, M., Sheth, R. K., Annis, J., et al. 2003, AJ, 125, 1866
- Binggeli et al. (1985) Binggeli, B., Sandage, A., & Tammann, G. A. 1985, AJ, 90, 1681
- Boselli et al. (2005) Boselli, A., Cortese, L., Deharveng, J. M., et al. 2005, ApJ, 629, L29
- Boselli et al. (2010) Boselli, A., Eales, S., Cortese, L., et al. 2010, PASP, 122, 261
- Catinella et al. (2012) Catinella, B., Kauffmann, G., Schiminovich, D., et al. 2012, MNRAS, 420, 1959
- Catinella et al. (2010) Catinella, B., Schiminovich, D., Kauffmann, G., et al. 2010, MNRAS, 403, 683 (Paper 1)
- Chabrier (2003) Chabrier, G. 2003, PASP, 115, 763
- Cortese et al. (2011) Cortese, L., Catinella, B., Boissier, S., Boselli, A., & Heinis, S. 2011, MNRAS, 415, 1797
- Cortese & Hughes (2009) Cortese, L. & Hughes, T. M. 2009, MNRAS, 400, 1225
- Courtois et al. (2009) Courtois, H. M., Tully, R. B., Fisher, J. R., et al. 2009, AJ, 138, 1938
- Davé et al. (2011) Davé, R., Finlator, K., & Oppenheimer, B. D. 2011, MNRAS, 416, 1354
- Dreyer (1888) Dreyer, J. L. E. 1888, MmRAS, 49, 1
- Dreyer (1895) Dreyer, J. L. E. 1895, MmRAS, 51, 185
- Dreyer (1908) Dreyer, J. L. E. 1908, MmRAS, 59, 105
- Fabello et al. (2011) Fabello, S., Catinella, B., Giovanelli, R., et al. 2011, MNRAS, 411, 993
- Fu et al. (2010) Fu, J., Guo, Q., Kauffmann, G., & Krumholz, M. R. 2010, MNRAS, 409, 515
- Giovanelli et al. (2005) Giovanelli, R., Haynes, M. P., Kent, B. R., et al. 2005, AJ, 130, 2598
- Haynes et al. (2011) Haynes, M. P., Giovanelli, R., Martin, A. M., et al. 2011, AJ, 142, 170
- Kauffmann et al. (2012) Kauffmann, G., Li, C., Fu, J., et al. 2012, MNRAS, 422, 997
- Kennicutt (1998) Kennicutt, Jr., R. C. 1998, ApJ, 498, 541
- Lagos et al. (2011) Lagos, C. D. P., Baugh, C. M., Lacey, C. G., et al. 2011, MNRAS, 418, 1649
- Li et al. (2012) Li, C., Kauffmann, G., Fu, J., et al. 2012, MNRAS, in press (arXiv:1202.2857)
- Martin et al. (2005) Martin, D. C., Fanson, J., Schiminovich, D., et al. 2005, ApJ, 619, L1
- Moran et al. (2012) Moran, S. M., Heckman, T. M., Kauffmann, G., et al. 2012, ApJ, 745, 66
- Moran et al. (2010) Moran, S. M., Kauffmann, G., Heckman, T. M., et al. 2010, ApJ, 720, 1126
- Nilson (1973) Nilson, P. 1973, Uppsala general catalogue of galaxies (Uppsala: Astron. Obs. Pub.) (UGC)
- O’Connell (1999) O’Connell, R. W. 1999, ARA&A, 37, 603
- Roberts & Haynes (1994) Roberts, M. S. & Haynes, M. P. 1994, ARA&A, 32, 115
- Saintonge (2007) Saintonge, A. 2007, AJ, 133, 2087
- Saintonge et al. (2011a) Saintonge, A., Kauffmann, G., Kramer, C., et al. 2011a, MNRAS, 415, 32
- Saintonge et al. (2011b) Saintonge, A., Kauffmann, G., Wang, J., et al. 2011b, MNRAS, 415, 61
- Salim et al. (2007) Salim, S., Rich, R. M., Charlot, S., et al. 2007, ApJS, 173, 267
- Sancisi et al. (2008) Sancisi, R., Fraternali, F., Oosterloo, T., & van der Hulst, T. 2008, A&A Rev., 15, 189
- Schiminovich et al. (2010) Schiminovich, D., Catinella, B., Kauffmann, G., et al. 2010, MNRAS, 408, 919
- Schmidt (1963) Schmidt, M. 1963, ApJ, 137, 758
- Schneider et al. (1990) Schneider, S. E., Thuan, T. X., Magri, C., & Wadiak, J. E. 1990, ApJS, 72, 245
- Springob et al. (2005) Springob, C. M., Haynes, M. P., Giovanelli, R., & Kent, B. R. 2005, ApJS, 160, 149 (S05)
- Walter et al. (2008) Walter, F., Brinks, E., de Blok, W. J. G., et al. 2008, AJ, 136, 2563
- Wang et al. (2011) Wang, J., Kauffmann, G., Overzier, R., et al. 2011, MNRAS, 412, 1081
- Wang et al. (2010) Wang, J., Overzier, R., Kauffmann, G., von der Linden, A., & Kong, X. 2010, MNRAS, 401, 433
- Wyder et al. (2007) Wyder, T. K., Martin, D. C., Schiminovich, D., et al. 2007, ApJS, 173, 293
- York et al. (2000) York, D. G., Adelman, J., Anderson, Jr., J. E., et al. 2000, AJ, 120, 1579
- Zhang et al. (2009) Zhang, W., Li, C., Kauffmann, G., et al. 2009, MNRAS, 397, 1243
- Zwicky et al. (1961) Zwicky, F., Herzog, E., Wild, P., Karpowicz, M., & Kowal, C. T. 1961-1968, Catalogue of galaxies and of clusters of galaxies (Pasadena: Caltech) (CGCG)
Appendix A GASS DR2 spectra and tables
We present here SDSS postage stamp images, Arecibo Hi-line spectra, and catalogs of optical, UV and Hi parameters for the 240 galaxies included in this second data release. The figures are organized as follows:
-
•
Figure 8: Hi detections.
-
•
Figure 2: marginal Hi detections (cataloged as “quality code 2” in Table LABEL:t_det.
-
•
Figure 3: marginal Hi detections that are also confused within the Arecibo beam (cataloged as “quality code 3” in Table LABEL:t_det.
-
•
Figure 4: Hi detections that are confused within the Arecibo beam (cataloged as “quality code 5” in Table LABEL:t_det.
-
•
Figure 5: Hi non-detections.
The tables include SDSS and UV parameters for the 240 galaxies (Table LABEL:t_sdss), Hi measurements for the 133 detections (Table LABEL:t_det), and Hi upper limits for the 107 non-detections (Table LABEL:t_ndet). For the detailed content of the tables, see Section 3. Notes on individual objects (marked with an asterisk in the last column of Tables LABEL:t_det and LABEL:t_ndet) are reported in Appendix B.
| Log | Log | extr | r | (b/a)r | incl | NUV | TNUV | ||||||||
|---|---|---|---|---|---|---|---|---|---|---|---|---|---|---|---|
| GASS | SDSS ID | Other name | (M⊙) | (″) | (″) | (″) | (M⊙ kpc-2) | (mag) | (mag) | (deg) | (mag) | (sec) | (min) | ||
| (1) | (2) | (3) | (4) | (5) | (6) | (7) | (8) | (9) | (10) | (11) | (12) | (13) | (14) | (15) | (16) |
| 11834 | J000047.89+141639.1 | … | 0.0362 | 10.71 | 3.21 | 3.55 | 10.51 | 9.12 | 0.17 | 15.15 | 0.341 | 74 | 3.94 | 1671 | 24 |
| 11825 | J000210.19+140810.3 | … | 0.0420 | 10.62 | 2.17 | 2.16 | 7.01 | 9.25 | 0.19 | 15.45 | 0.719 | 45 | 5.68 | 364 | 65 |
| 11917 | J000742.65+151112.7 | … | 0.0446 | 10.74 | 2.96 | 3.39 | 10.45 | 9.04 | 0.18 | 15.25 | 0.677 | 49 | 4.06 | 1680 | 48 |
| 12005 | J002420.72+144632.3 | … | 0.0309 | 10.06 | 1.71 | 1.79 | 5.09 | 9.16 | 0.17 | 16.04 | 0.348 | 73 | 5.05 | 3519 | 33 |
| 12002 | J002504.00+145815.2 | … | 0.0367 | 10.48 | 1.75 | 1.81 | 5.74 | 9.41 | 0.14 | 15.47 | 0.424 | 68 | 6.25 | 3519 | 66 |
| 3163 | J002846.83+150529.3 | … | 0.0422 | 10.63 | 3.99 | 4.23 | 9.19 | 8.72 | 0.17 | 15.12 | 0.468 | 64 | 3.82 | 3133 | 64 |
| 3151 | J003143.05+142911.2 | … | 0.0381 | 10.40 | 2.90 | 3.40 | 11.16 | 8.85 | 0.19 | 15.51 | 0.784 | 39 | 4.85 | 3133 | 77 |
| 27181 | J003248.17+144738.1 | … | 0.0418 | 10.60 | 3.38 | 3.67 | 10.23 | 8.84 | 0.18 | 15.11 | 0.781 | 40 | 3.22 | 1659 | 73 |
| 27167 | J003921.66+142811.5 | … | 0.0380 | 10.37 | 2.02 | 2.15 | 5.96 | 9.14 | 0.27 | 15.49 | 0.711 | 46 | 4.48 | 1658 | 76 |
| 3189 | J004023.48+143649.4 | … | 0.0384 | 10.05 | 5.59 | 5.96 | 11.68 | 7.92 | 0.32 | 15.66 | 0.471 | 64 | 2.77 | 1658 | 80 |
| 27219 | J004125.29+134334.3 | … | 0.0332 | 10.21 | 4.34 | 4.33 | 9.51 | 8.44 | 0.23 | 16.43 | 0.253 | 81 | 3.96 | 1658 | 44 |
| 3233 | J005134.04+135452.7 | … | 0.0392 | 10.23 | 2.31 | 2.35 | 5.82 | 8.85 | 0.20 | 15.67 | 0.708 | 46 | 3.28 | 175 | 87 |
| 3301 | J005915.31+133433.3 | … | 0.0404 | 10.92 | 3.55 | 3.65 | 11.61 | 9.15 | 0.19 | 14.55 | 0.491 | 63 | 6.13 | 3142 | 14 |
| 3435 | J010832.07+150122.9 | … | 0.0414 | 10.76 | 3.29 | 3.54 | 11.80 | 9.03 | 0.17 | 14.61 | 0.769 | 41 | 5.40 | 1648 | 33 |
| 3439 | J010905.96+144520.8 | … | 0.0386 | 10.35 | 2.96 | 3.56 | 10.34 | 8.78 | 0.14 | 15.48 | 0.790 | 39 | 3.05 | 1648 | 81 |
| 3465 | J011221.82+150039.0 | … | 0.0292 | 10.19 | 2.75 | 3.07 | 8.87 | 8.93 | 0.13 | 15.33 | 0.570 | 57 | 3.63 | 1648 | 26 |
| 3509 | J011711.65+132027.3 | … | 0.0484 | 10.81 | 2.50 | 2.68 | 8.33 | 9.18 | 0.09 | 15.28 | 0.562 | 58 | 4.14 | 1647 | 51 |
| 3524 | J011716.09+143720.5 | … | 0.0380 | 10.73 | 2.38 | 2.66 | 7.22 | 9.36 | 0.10 | 15.58 | 0.337 | 74 | 5.15 | 1608 | 27 |
| 3519 | J011728.11+144215.9 | UGC827 | 0.0427 | 10.74 | 4.93 | 5.31 | 11.67 | 8.64 | 0.11 | 14.95 | 0.736 | 44 | 3.68 | 1647 | 40 |
| 3508 | J011900.04+143643.1 | … | 0.0365 | 10.37 | 2.90 | 2.98 | 7.45 | 8.87 | 0.10 | 15.55 | 0.723 | 45 | 5.12 | 6090 | 64 |
| 3757 | J012227.97+153238.4 | … | 0.0376 | 10.52 | 1.93 | 2.14 | 6.43 | 9.34 | 0.31 | 15.25 | 0.665 | 50 | 4.92 | 1658 | 65 |
| 3854 | J013854.76+150117.7 | CGCG437-008 | 0.0279 | 10.91 | 5.67 | 6.35 | 20.16 | 9.06 | 0.16 | 13.76 | 0.785 | 39 | 5.58 | 2954 | 3 |
| 3859 | J013901.89+145808.5 | … | 0.0285 | 10.18 | 2.92 | 3.26 | 10.53 | 8.88 | 0.15 | 15.38 | 0.780 | 40 | 4.96 | 2954 | 23 |
| 3821 | J014042.68+133304.6 | … | 0.0447 | 10.87 | 3.21 | 3.26 | 10.63 | 9.09 | 0.15 | 14.85 | 0.561 | 58 | 5.84 | 1604 | 27 |
| 3819 | J014143.18+134032.8 | … | 0.0453 | 10.67 | 2.63 | 2.74 | 6.81 | 9.06 | 0.15 | 14.72 | 0.871 | 30 | 2.20 | 3361 | 72 |
| 4094 | J014326.66+131913.0 | … | 0.0276 | 10.55 | 3.15 | 3.18 | 9.47 | 9.22 | 0.13 | 14.71 | 0.581 | 56 | 5.94 | 1696 | 16 |
| 4119 | J014629.79+135709.6 | … | 0.0444 | 11.19 | 4.26 | 4.85 | 15.59 | 9.18 | 0.14 | 14.22 | 0.776 | 40 | 6.13 | 1625 | 6 |
| 4195 | J014906.09+142550.6 | … | 0.0445 | 10.62 | 3.96 | 4.57 | 13.20 | 8.66 | 0.14 | 15.31 | 0.686 | 48 | 4.74 | 1677 | 85 |
| 4074 | J014911.62+125111.6 | UGC1274 | 0.0262 | 11.17 | 3.86 | 4.16 | 12.80 | 9.71 | 0.22 | 13.41 | 0.489 | 63 | 6.03 | 1644 | 1 |
| 4065 | J014941.82+124458.2 | … | 0.0490 | 10.17 | 2.40 | 2.53 | 7.66 | 8.56 | 0.21 | 16.57 | 0.917 | 24 | 5.31 | 1644 | 217 |
| 4203 | J015027.35+141140.0 | … | 0.0341 | 10.18 | 4.65 | 4.67 | 10.29 | 8.33 | 0.14 | 15.70 | 0.373 | 71 | 3.45 | 1661 | 49 |
| 4145 | J015517.63+125935.5 | … | 0.0322 | 10.30 | 2.18 | 2.43 | 7.68 | 9.16 | 0.15 | 15.09 | 0.419 | 68 | 3.04 | 1659 | 39 |
| 4137 | J015651.99+131246.0 | … | 0.0445 | 10.90 | 2.59 | 2.78 | 9.25 | 9.32 | 0.14 | 15.00 | 0.573 | 57 | 5.35 | 1651 | 23 |
| 4233 | J015707.32+145543.5 | … | 0.0433 | 10.88 | 3.59 | 3.94 | 12.05 | 9.03 | 0.16 | 14.70 | 0.883 | 29 | 5.69 | 1671 | 23 |
| 4223 | J015712.97+144407.6 | CGCG438-008 | 0.0260 | 10.56 | 3.62 | 3.96 | 13.26 | 9.16 | 0.14 | 14.44 | 0.971 | 14 | 5.19 | 1671 | 12 |
| 3918 | J015718.40+130745.8 | … | 0.0327 | 10.38 | 2.12 | 2.11 | 6.72 | 9.24 | 0.15 | 15.30 | 0.556 | 58 | 5.69 | 1651 | 41 |
| 4017 | J020517.54+133020.6 | IC1775 | 0.0258 | 10.23 | 6.78 | 10.39 | 19.52 | 8.29 | 0.24 | 14.44 | 0.908 | 25 | 3.17 | 1662 | 16 |
| 3880 | J020519.88+131530.7 | … | 0.0270 | 10.52 | 2.77 | 2.80 | 8.35 | 9.33 | 0.28 | 14.61 | 0.714 | 46 | 6.00 | 1662 | 17 |
| 3977 | J020744.46+140453.7 | … | 0.0324 | 10.26 | 3.76 | 4.28 | 11.18 | 8.64 | 0.22 | 15.60 | 0.270 | 79 | 3.57 | 1645 | 40 |
| 4030 | J020939.47+135859.4 | … | 0.0491 | 11.33 | 7.64 | 8.32 | 16.80 | 8.72 | 0.26 | 14.08 | 0.822 | 36 | 4.08 | 1531 | 5 |
| 4038 | J021121.82+143015.5 | UGC1681 | 0.0417 | 10.72 | 4.83 | 5.95 | 15.25 | 8.65 | 0.28 | 15.10 | 0.223 | 84 | 3.40 | 1531 | 41 |
| 4039 | J021131.43+141202.4 | … | 0.0254 | 10.32 | 3.69 | 4.33 | 12.75 | 8.93 | 0.25 | 14.80 | 0.675 | 49 | 3.47 | 1531 | 15 |
| 4040 | J021139.06+140830.3 | … | 0.0269 | 10.32 | 2.32 | 2.36 | 7.43 | 9.27 | 0.25 | 14.99 | 0.530 | 60 | 5.80 | 1531 | 19 |
| 4048 | J021219.38+133645.6 | … | 0.0414 | 10.55 | 3.51 | 3.75 | 8.71 | 8.77 | 0.30 | 15.40 | 0.615 | 54 | 3.45 | 1692 | 84 |
| 3981 | J021404.39+131156.3 | … | 0.0416 | 10.55 | 3.51 | 3.81 | 9.96 | 8.76 | 0.34 | 15.34 | 0.497 | 62 | 3.76 | 1692 | 88 |
| 3985 | J021412.12+132612.8 | … | 0.0411 | 10.76 | 3.48 | 3.73 | 10.56 | 8.98 | 0.33 | 15.09 | 0.617 | 53 | 5.95 | 1692 | 33 |
| 4057 | J021419.24+135611.2 | … | 0.0397 | 10.52 | 2.34 | 2.64 | 7.19 | 9.13 | 0.34 | 15.27 | 0.505 | 62 | 3.36 | 1654 | 81 |
| 51416 | J075559.95+125853.2 | CGCG058-073 | 0.0445 | 11.27 | 3.98 | 4.54 | 14.53 | 9.31 | 0.09 | 13.92 | 0.860 | 31 | 5.43 | 208 | 4 |
| 56319 | J080322.76+095745.8 | … | 0.0345 | 10.14 | 3.39 | 3.28 | 8.31 | 8.54 | 0.07 | 16.70 | 0.272 | 79 | 4.78 | 223 | 51 |
| 56304 | J080534.10+102336.2 | UGC4215 | 0.0340 | 10.89 | 7.43 | 15.04 | 26.90 | 8.63 | 0.06 | 14.18 | 0.812 | 37 | 3.61 | 218 | 8 |
| 56632 | J090437.07+133314.7 | CGCG061-057 | 0.0281 | 11.00 | 4.92 | 5.35 | 15.02 | 9.27 | 0.10 | 13.59 | 0.372 | 71 | 4.94 | 1612 | 2 |
| 16753 | J091828.43+062003.7 | … | 0.0335 | 10.29 | 3.57 | 3.93 | 11.23 | 8.68 | 0.12 | 15.21 | 0.623 | 53 | 3.41 | 1706 | 45 |
| 25844 | J091959.74+100631.7 | … | 0.0326 | 10.25 | 1.43 | 1.47 | 4.05 | 9.46 | 0.13 | 15.65 | 0.503 | 62 | 5.62 | 1677 | 41 |
| 8347 | J093858.50+040940.5 | … | 0.0463 | 10.68 | 2.65 | 2.71 | 7.72 | 9.04 | 0.12 | 15.29 | 0.863 | 31 | 6.04 | 2114 | 76 |
| 18702 | J095051.58+081340.7 | … | 0.0299 | 10.20 | 3.50 | 3.86 | 8.49 | 8.71 | 0.10 | 15.71 | 0.255 | 81 | 3.84 | 1676 | 28 |
| 18707 | J095150.14+082213.8 | … | 0.0405 | 10.57 | 3.04 | 3.33 | 8.61 | 8.93 | 0.13 | 14.95 | 0.596 | 55 | 3.33 | 207 | 71 |
| 20305 | J095243.86+100001.0 | … | 0.0303 | 10.30 | 4.92 | 5.47 | 12.13 | 8.50 | 0.10 | 15.68 | 0.190 | 90 | 4.75 | 112 | 30 |
| 18673 | J095301.79+072736.4 | … | 0.0385 | 10.38 | 2.47 | 2.67 | 6.07 | 8.97 | 0.12 | 15.32 | 0.659 | 50 | 3.04 | 1249 | 81 |
| 18686 | J095302.62+075029.3 | CGCG035-075 | 0.0411 | 10.55 | 4.91 | 5.76 | 12.10 | 8.48 | 0.11 | 14.89 | 0.606 | 54 | 2.99 | 1676 | 83 |
| 18681 | J095324.56+074956.2 | … | 0.0393 | 10.67 | 3.66 | 3.95 | 11.00 | 8.90 | 0.11 | 15.40 | 0.260 | 80 | 4.22 | 1676 | 39 |
| 20292 | J095349.23+091137.6 | CGCG063-098 | 0.0299 | 10.67 | 4.22 | 4.53 | 10.91 | 9.02 | 0.13 | 14.38 | 0.776 | 40 | 4.47 | 3178 | 13 |
| 20371 | J095402.22+103629.6 | CGCG063-101 | 0.0399 | 11.24 | 6.35 | 7.62 | 21.70 | 8.97 | 0.08 | 13.84 | 0.764 | 41 | 5.38 | 208 | 3 |
| 20448 | J095812.59+110635.5 | … | 0.0272 | 10.06 | 2.04 | 2.17 | 6.07 | 9.12 | 0.08 | 15.40 | 0.587 | 56 | 3.26 | 109 | 20 |
| 18755 | J100057.16+073743.2 | CGCG036-018 | 0.0489 | 11.31 | 5.81 | 6.54 | 19.49 | 8.94 | 0.07 | 14.10 | 0.829 | 35 | 5.80 | 224 | 5 |
| 14863 | J100134.25+065555.3 | CGCG036-021 | 0.0489 | 11.39 | 4.83 | 5.33 | 16.05 | 9.17 | 0.06 | 14.15 | 0.567 | 57 | 5.95 | 330 | 4 |
| 5035 | J100152.69+030040.7 | … | 0.0441 | 10.77 | 2.91 | 3.09 | 9.94 | 9.10 | 0.07 | 14.82 | 0.661 | 50 | 3.72 | 10840 | 40 |
| 18830 | J101100.68+085920.7 | … | 0.0320 | 10.27 | 2.41 | 2.56 | 8.01 | 9.05 | 0.08 | 15.34 | 0.702 | 47 | 4.67 | 320 | 38 |
| 18798 | J101329.66+075415.5 | CGCG036-062 | 0.0458 | 11.22 | 4.58 | 5.35 | 17.20 | 9.11 | 0.09 | 14.24 | 0.776 | 40 | 5.12 | 419 | 6 |
| 18875 | J102004.22+074622.1 | CGCG037-002 | 0.0451 | 11.11 | 4.62 | 4.85 | 16.29 | 9.01 | 0.07 | 14.34 | 0.673 | 49 | 5.47 | 6825 | 9 |
| 18877 | J102025.15+074037.8 | CGCG037-003 | 0.0452 | 10.97 | 4.37 | 4.64 | 11.75 | 8.91 | 0.07 | 14.62 | 0.435 | 67 | 4.08 | 336 | 18 |
| 18872 | J102039.65+075133.9 | CGCG037-006 | 0.0451 | 11.13 | 4.25 | 4.48 | 15.17 | 9.11 | 0.07 | 14.26 | 0.679 | 49 | 5.93 | 6825 | 8 |
| 18887 | J102055.54+081849.4 | … | 0.0458 | 10.76 | 3.38 | 3.66 | 10.62 | 8.92 | 0.08 | 15.42 | 0.333 | 74 | 3.95 | 6825 | 49 |
| 54233 | J102157.80+243918.7 | IC2567 | 0.0402 | 11.14 | 5.95 | 7.00 | 17.63 | 8.92 | 0.06 | 14.03 | 0.479 | 64 | 5.19 | 112 | 5 |
| 26320 | J102238.71+120517.8 | … | 0.0450 | 10.71 | 2.35 | 2.43 | 7.15 | 9.20 | 0.11 | 15.48 | 0.624 | 53 | 4.89 | 112 | 59 |
| 18862 | J102241.20+082003.2 | … | 0.0446 | 10.68 | 4.00 | 4.28 | 11.77 | 8.71 | 0.09 | 15.19 | 0.544 | 59 | 3.81 | 254 | 66 |
| 26336 | J102316.17+130528.7 | CGCG065-013 | 0.0320 | 11.00 | 4.91 | 5.18 | 15.76 | 9.16 | 0.13 | 14.00 | 0.634 | 52 | 6.06 | 322 | 4 |
| 26319 | J102339.36+130227.4 | … | 0.0322 | 10.29 | 2.84 | 3.02 | 8.45 | 8.91 | 0.12 | 15.44 | 0.476 | 64 | 5.26 | 322 | 39 |
| 23026 | J102721.97+110447.9 | UGC5665 | 0.0323 | 11.16 | 6.25 | 7.50 | 23.74 | 9.10 | 0.09 | 13.94 | 0.374 | 71 | 5.29 | 335 | 2 |
| 23069 | J102742.61+104927.6 | … | 0.0316 | 10.22 | 3.36 | 3.51 | 10.11 | 8.71 | 0.09 | 15.51 | 0.826 | 35 | 5.60 | 335 | 36 |
| 23039 | J102756.01+111444.6 | … | 0.0325 | 10.78 | 3.04 | 3.22 | 10.29 | 9.34 | 0.09 | 14.24 | 0.671 | 49 | 5.68 | 335 | 11 |
| 54763 | J103721.85+272131.4 | CGCG154-033 | 0.0421 | 11.11 | 6.00 | 5.10 | 19.39 | 8.84 | 0.06 | 14.38 | 0.821 | 36 | 4.83 | 192 | 7 |
| 26570 | J103905.90+132153.5 | … | 0.0325 | 10.00 | 4.02 | 4.21 | 9.15 | 8.32 | 0.12 | 15.66 | 0.865 | 31 | 2.97 | 326 | 40 |
| 23227 | J103913.15+121130.9 | … | 0.0479 | 11.18 | 4.30 | 4.64 | 14.77 | 9.09 | 0.07 | 14.51 | 0.372 | 71 | 4.85 | 1565 | 9 |
| 23228 | J103920.02+114128.1 | … | 0.0479 | 11.04 | 3.02 | 3.18 | 10.10 | 9.26 | 0.09 | 14.70 | 0.880 | 29 | 5.62 | 219 | 16 |
| 15211 | J104024.66+065137.7 | … | 0.0303 | 10.89 | 4.48 | 5.79 | 17.15 | 9.17 | 0.10 | 14.70 | 0.343 | 73 | 4.64 | 695 | 5 |
| 26640 | J104028.50+133721.9 | CGCG065-082 | 0.0317 | 10.99 | 5.88 | 6.59 | 20.47 | 9.00 | 0.10 | 13.81 | 0.745 | 43 | 5.97 | 326 | 4 |
| 26639 | J104046.05+134659.9 | … | 0.0317 | 10.24 | 4.21 | 4.33 | 10.59 | 8.54 | 0.10 | 15.88 | 0.287 | 78 | 5.42 | 326 | 36 |
| 15166 | J104121.14+061644.3 | CGCG037-116 | 0.0339 | 10.02 | 5.00 | 5.62 | 11.62 | 8.10 | 0.07 | 15.33 | 0.427 | 67 | 2.35 | 2583 | 48 |
| 29555 | J104145.56+135352.9 | … | 0.0316 | 10.38 | 3.33 | 3.63 | 11.29 | 8.88 | 0.09 | 14.94 | 0.767 | 41 | 4.55 | 326 | 36 |
| 57099 | J104221.91+152134.6 | IC637 | 0.0490 | 11.10 | 5.12 | 5.83 | 17.88 | 8.84 | 0.09 | 14.05 | 0.839 | 34 | 4.71 | 200 | 13 |
| 15151 | J104251.39+055135.5 | CGCG037-125 | 0.0334 | 10.99 | 4.21 | 4.60 | 13.51 | 9.24 | 0.06 | 14.39 | 0.378 | 71 | 4.93 | 2583 | 5 |
| 29594 | J104639.64+140647.4 | … | 0.0336 | 10.03 | 3.06 | 3.08 | 8.95 | 8.56 | 0.09 | 16.01 | 0.350 | 73 | 5.33 | 1831 | 46 |
| 15242 | J105016.92+060721.3 | CGCG038-026 | 0.0422 | 10.61 | 2.81 | 2.77 | 8.99 | 9.00 | 0.08 | 14.96 | 0.658 | 50 | 5.60 | 1573 | 72 |
| 23437 | J105147.93+115901.7 | … | 0.0465 | 10.91 | 3.54 | 3.74 | 11.98 | 9.01 | 0.05 | 14.78 | 0.675 | 49 | 5.35 | 427 | 27 |
| 54986 | J105739.31+272937.1 | … | 0.0454 | 11.19 | 5.51 | 5.89 | 16.43 | 8.93 | 0.06 | 14.16 | 0.966 | 15 | 5.79 | 192 | 7 |
| 17684 | J110037.27+102613.9 | IC663 | 0.0361 | 11.08 | 5.44 | 5.68 | 14.05 | 9.04 | 0.08 | 14.13 | 0.714 | 46 | 6.05 | 329 | 4 |
| 29624 | J110050.33+133551.4 | … | 0.0340 | 10.32 | 4.02 | 5.12 | 12.76 | 8.59 | 0.04 | 15.92 | 0.250 | 81 | 4.17 | 1642 | 48 |
| 23518 | J110103.65+120827.7 | … | 0.0342 | 10.43 | 3.10 | 3.10 | 8.87 | 8.92 | 0.05 | 15.30 | 0.409 | 69 | 7.14 | 107 | 50 |
| 23563 | J110741.70+130132.4 | CGCG066-117 | 0.0350 | 11.26 | 6.66 | 6.91 | 19.94 | 9.07 | 0.04 | 13.45 | 0.636 | 52 | 5.62 | 205 | 2 |
| 47896 | J110851.20+282832.5 | UGC6191 | 0.0363 | 11.12 | 6.30 | 7.56 | 18.44 | 8.95 | 0.07 | 13.76 | 0.786 | 39 | 3.73 | 199 | 4 |
| 17840 | J111254.48+093050.3 | … | 0.0291 | 10.19 | 2.03 | 2.15 | 6.37 | 9.20 | 0.07 | 15.29 | 0.555 | 58 | 5.05 | 1605 | 25 |
| 15612 | J111341.33+074545.9 | MRK1295 | 0.0291 | 10.53 | 2.15 | 2.14 | 6.54 | 9.49 | 0.09 | 14.84 | 0.706 | 46 | 5.87 | 1607 | 22 |
| 12318 | J111443.35+040128.2 | CGCG039-088 | 0.0417 | 11.21 | 4.36 | 4.64 | 15.23 | 9.23 | 0.13 | 13.88 | 0.774 | 40 | 5.60 | 2466 | 4 |
| 23539 | J111447.94+114735.0 | … | 0.0379 | 10.19 | 1.74 | 1.76 | 4.76 | 9.10 | 0.05 | 15.99 | 0.466 | 65 | 5.76 | 1612 | 76 |
| 12293 | J112029.23+040742.1 | CGCG039-127 | 0.0496 | 11.32 | 6.20 | 7.32 | 17.61 | 8.87 | 0.12 | 14.16 | 0.706 | 46 | 4.44 | 1536 | 5 |
| 29892 | J112946.35+152001.1 | CGCG096-056 | 0.0366 | 11.02 | 4.86 | 5.51 | 15.68 | 9.06 | 0.10 | 13.88 | 0.576 | 57 | 3.81 | 119 | 6 |
| 23757 | J113645.51+132009.9 | … | 0.0342 | 10.51 | 3.26 | 3.55 | 9.70 | 8.96 | 0.10 | 14.83 | 0.458 | 65 | 3.63 | 341 | 47 |
| 12597 | J114309.53+055557.8 | … | 0.0315 | 10.31 | 2.31 | 2.19 | 6.62 | 9.13 | 0.07 | 15.40 | 0.455 | 65 | 5.45 | 2614 | 35 |
| 18087 | J114940.66+094255.1 | … | 0.0352 | 10.39 | 2.57 | 2.77 | 7.85 | 9.02 | 0.07 | 15.32 | 0.861 | 31 | 4.55 | 90 | 56 |
| 18202 | J121134.94+092106.8 | … | 0.0269 | 10.25 | 2.86 | 2.94 | 8.64 | 9.02 | 0.05 | 15.00 | 0.889 | 28 | 5.55 | 76 | 19 |
| 30192 | J121418.23+142345.8 | … | 0.0251 | 10.43 | 2.81 | 2.80 | 9.49 | 9.29 | 0.11 | 14.66 | 0.568 | 57 | 5.18 | 109 | 14 |
| 24168 | J121612.36+132615.4 | … | 0.0260 | 10.44 | 4.49 | 4.92 | 13.94 | 8.85 | 0.09 | 14.96 | 0.280 | 78 | 4.77 | 2601 | 16 |
| 28057 | J122532.62+080301.4 | … | 0.0381 | 10.30 | 6.31 | 6.71 | 12.34 | 8.08 | 0.06 | 15.37 | 0.768 | 41 | 2.95 | 3272 | 77 |
| 18482 | J123053.16+090456.9 | … | 0.0393 | 10.43 | 1.93 | 1.97 | 6.42 | 9.21 | 0.05 | 15.61 | 0.735 | 44 | 5.54 | 311 | 88 |
| 12970 | J123553.79+054539.8 | VCC1643 | 0.0418 | 10.89 | 6.94 | 7.83 | 21.60 | 8.51 | 0.07 | 14.39 | 0.782 | 40 | 5.50 | 3047 | 18 |
| 18576 | J123625.93+085639.7 | … | 0.0277 | 10.26 | 3.36 | 3.61 | 9.50 | 8.87 | 0.06 | 15.10 | 0.606 | 54 | 4.13 | 1696 | 21 |
| 24366 | J123938.86+122507.9 | … | 0.0411 | 10.86 | 2.16 | 2.23 | 7.23 | 9.51 | 0.13 | 14.96 | 0.420 | 68 | 5.76 | 3791 | 20 |
| 24437 | J123949.27+133256.8 | CGCG070-205 | 0.0466 | 10.67 | 2.72 | 2.90 | 8.02 | 9.00 | 0.09 | 15.60 | 0.471 | 64 | 3.74 | 189 | 81 |
| 28482 | J124307.28+111243.1 | IC3694 | 0.0282 | 10.23 | 5.38 | 5.45 | 12.53 | 8.42 | 0.08 | 14.63 | 0.694 | 47 | 2.32 | 1658 | 23 |
| 28462 | J124618.26+115224.8 | IC3760 | 0.0449 | 10.73 | 2.55 | 2.67 | 7.77 | 9.16 | 0.07 | 15.11 | 0.581 | 56 | 5.62 | 2285 | 51 |
| 28461 | J124622.67+115235.7 | IC815 | 0.0443 | 11.36 | 5.08 | 5.33 | 17.71 | 9.19 | 0.07 | 13.76 | 0.834 | 34 | 5.87 | 2285 | 3 |
| 13091 | J125451.85+035305.4 | CGCG043-063 | 0.0483 | 11.44 | 5.16 | 5.45 | 18.02 | 9.18 | 0.10 | 13.77 | 0.726 | 45 | 5.71 | 305 | 3 |
| 28551 | J125657.07+122148.6 | … | 0.0496 | 11.18 | 3.39 | 3.74 | 12.12 | 9.26 | 0.09 | 14.67 | 0.412 | 68 | 5.68 | 259 | 10 |
| 25167 | J130256.89+125250.0 | … | 0.0362 | 10.49 | 3.58 | 4.15 | 12.15 | 8.81 | 0.07 | 15.05 | 0.367 | 72 | 4.16 | 109 | 62 |
| 40425 | J130404.23+084820.6 | … | 0.0358 | 10.17 | 4.02 | 4.40 | 10.77 | 8.40 | 0.09 | 15.65 | 0.326 | 75 | 2.97 | 253 | 59 |
| 13158 | J130454.21+034928.1 | UGC8173 | 0.0410 | 10.81 | 4.52 | 5.23 | 13.28 | 8.81 | 0.08 | 14.35 | 0.807 | 37 | 2.61 | 3371 | 25 |
| 6749 | J130750.80+031140.7 | UGC8208 | 0.0386 | 11.12 | 6.08 | 7.17 | 18.45 | 8.92 | 0.07 | 14.06 | 0.266 | 80 | 4.25 | 121 | 5 |
| 25236 | J131357.26+123533.2 | CGCG072-031 | 0.0256 | 10.24 | 4.09 | 4.20 | 12.53 | 8.76 | 0.06 | 14.75 | 0.908 | 25 | 5.16 | 103 | 15 |
| 25202 | J131415.99+120348.5 | … | 0.0343 | 10.52 | 3.04 | 3.20 | 8.39 | 9.03 | 0.07 | 14.64 | 0.680 | 48 | 5.29 | 111 | 45 |
| 26911 | J131621.43+133006.6 | CGCG072-041 | 0.0304 | 10.98 | 5.13 | 5.56 | 18.21 | 9.14 | 0.06 | 13.71 | 0.829 | 35 | … | … | 3 |
| 25296 | J132357.45+120233.3 | CGCG072-063 | 0.0390 | 11.01 | 2.80 | 3.24 | 9.55 | 9.47 | 0.08 | 14.44 | 0.580 | 56 | 4.13 | 96 | 8 |
| 34531 | J132939.26+294612.3 | UGC8483 | 0.0472 | 11.27 | 5.71 | 6.72 | 21.22 | 8.94 | 0.03 | 14.04 | 0.779 | 40 | 5.63 | 144 | 5 |
| 51190 | J134404.06+253948.6 | … | 0.0486 | 11.03 | 4.98 | 5.66 | 13.16 | 8.79 | 0.04 | 14.42 | 0.445 | 66 | 3.70 | 367 | 19 |
| 13551 | J134505.90+034815.3 | … | 0.0331 | 10.05 | 2.77 | 2.91 | 7.86 | 8.67 | 0.06 | 15.75 | 0.553 | 58 | 4.81 | 2971 | 44 |
| 25475 | J134807.60+112405.1 | … | 0.0360 | 10.34 | 2.18 | 2.43 | 6.73 | 9.09 | 0.09 | 15.58 | 0.619 | 53 | … | … | 61 |
| 13624 | J135152.41+032718.0 | CGCG045-119 | 0.0296 | 10.31 | 5.86 | 6.45 | 13.70 | 8.38 | 0.09 | 14.41 | 0.670 | 49 | 2.50 | 1626 | 28 |
| 44846 | J135512.58+250117.1 | IC4344 | 0.0310 | 11.00 | 6.90 | 8.01 | 21.60 | 8.89 | 0.04 | 13.65 | 0.687 | 48 | 4.61 | 268 | 3 |
| 40260 | J135827.10+132904.7 | CGCG074-022 | 0.0388 | 10.77 | 3.10 | 3.18 | 10.03 | 9.15 | 0.07 | 14.89 | 0.571 | 57 | 5.29 | 240 | 24 |
| 25572 | J140700.00+130019.1 | CGCG074-109 | 0.0274 | 10.45 | 3.20 | 3.52 | 12.21 | 9.12 | 0.07 | 14.74 | 0.446 | 66 | 5.22 | 110 | 20 |
| 41303 | J140741.05+094835.8 | … | 0.0374 | 10.23 | 2.02 | 1.99 | 5.80 | 9.01 | 0.07 | 15.95 | 0.584 | 56 | 6.60 | 109 | 72 |
| 38538 | J141119.35+113105.1 | … | 0.0385 | 10.13 | 2.73 | 2.94 | 8.81 | 8.63 | 0.06 | 15.74 | 0.885 | 28 | 3.38 | 106 | 80 |
| 38546 | J141229.86+111425.9 | UGC9089 | 0.0282 | 11.03 | 6.73 | 7.47 | 18.52 | 9.02 | 0.06 | 13.56 | 0.382 | 71 | 4.37 | 106 | 2 |
| 41444 | J141547.01+085436.6 | … | 0.0287 | 10.73 | 2.18 | 2.25 | 7.20 | 9.69 | 0.07 | 14.22 | 0.630 | 52 | 5.32 | 222 | 8 |
| 45439 | J141722.70+250310.1 | CGCG133-024 | 0.0299 | 10.90 | 3.52 | 3.63 | 11.33 | 9.40 | 0.05 | 14.00 | 0.459 | 65 | 5.69 | 28617 | 5 |
| 30854 | J141833.16+071712.4 | … | 0.0257 | 10.16 | 5.86 | 6.33 | 17.52 | 8.36 | 0.09 | 15.59 | 0.197 | 90 | 4.50 | 1680 | 15 |
| 30847 | J141835.33+072118.8 | … | 0.0250 | 10.29 | 3.40 | 3.51 | 10.16 | 8.98 | 0.08 | 14.86 | 0.416 | 68 | 5.59 | 1680 | 14 |
| 28875 | J143041.62+115913.3 | … | 0.0271 | 10.39 | 2.76 | 2.83 | 8.19 | 9.19 | 0.07 | 14.80 | 0.769 | 41 | 5.83 | 107 | 19 |
| 7520 | J143314.34+023909.6 | CGCG047-087 | 0.0291 | 10.80 | 4.92 | 5.50 | 15.45 | 9.04 | 0.10 | 14.25 | 0.411 | 68 | 5.66 | 1690 | 6 |
| 9601 | J143351.42+034046.1 | CGCG047-095 | 0.0288 | 10.83 | 3.67 | 3.84 | 12.20 | 9.33 | 0.10 | 14.18 | 0.538 | 59 | 6.09 | 1696 | 5 |
| 9585 | J143419.01+033951.7 | CGCG047-101 | 0.0336 | 11.04 | 4.47 | 5.01 | 16.47 | 9.23 | 0.10 | 13.95 | 0.572 | 57 | 4.45 | 1696 | 4 |
| 46068 | J143709.53+251503.0 | CGCG133-098 | 0.0340 | 11.40 | 5.03 | 5.99 | 17.60 | 9.48 | 0.08 | 13.88 | 0.538 | 59 | 5.59 | 90 | 1 |
| 41703 | J144119.18+085256.5 | … | 0.0294 | 10.16 | 2.98 | 3.04 | 9.44 | 8.82 | 0.07 | 15.34 | 0.569 | 57 | 3.71 | 208 | 27 |
| 29205 | J144551.55+100910.4 | … | 0.0375 | 10.11 | 3.29 | 4.08 | 9.34 | 8.47 | 0.07 | 16.44 | 0.286 | 78 | 3.21 | 299 | 72 |
| 29225 | J144636.62+115108.7 | … | 0.0294 | 10.40 | 2.84 | 2.89 | 8.35 | 9.11 | 0.08 | 15.07 | 0.619 | 53 | 5.45 | 281 | 27 |
| 38732 | J145033.16+093742.2 | CGCG076-071 | 0.0499 | 11.08 | 3.50 | 3.50 | 10.89 | 9.13 | 0.08 | 14.41 | 0.924 | 23 | 5.72 | 11717 | 17 |
| 38728 | J145055.60+093946.5 | … | 0.0386 | 10.08 | 1.32 | 1.38 | 4.42 | 9.21 | 0.09 | 16.21 | 0.722 | 45 | 5.19 | 144 | 82 |
| 38706 | J145129.30+092005.9 | UGC9561 | 0.0293 | 10.96 | 4.02 | 5.10 | 14.64 | 9.36 | 0.09 | 13.80 | 0.517 | 61 | 4.28 | 11717 | 3 |
| 10012 | J145243.07+031329.3 | CGCG048-044 | 0.0279 | 10.76 | 3.48 | 3.74 | 12.72 | 9.33 | 0.12 | 13.96 | 0.685 | 48 | 5.55 | 5768 | 7 |
| 10058 | J145413.13+045029.5 | IC1072 | 0.0347 | 11.06 | 5.55 | 6.04 | 19.15 | 9.03 | 0.10 | 13.78 | 0.640 | 52 | 5.68 | 3652 | 4 |
| 41783 | J145730.93+082326.3 | CGCG076-111 | 0.0371 | 11.09 | 3.18 | 3.29 | 10.12 | 9.49 | 0.10 | 13.93 | 0.524 | 60 | 4.58 | 141 | 5 |
| 38923 | J145758.08+110027.4 | CGCG076-114 | 0.0479 | 11.04 | 4.92 | 5.28 | 14.07 | 8.83 | 0.10 | 14.27 | 0.738 | 43 | 3.55 | 64 | 16 |
| 41793 | J145841.32+075905.9 | CGCG048-086 | 0.0376 | 11.25 | 7.25 | 8.35 | 19.82 | 8.92 | 0.09 | 13.56 | 0.813 | 36 | 5.38 | 149 | 2 |
| 39120 | J150935.51+102525.9 | … | 0.0276 | 10.26 | 3.44 | 3.69 | 10.23 | 8.86 | 0.10 | 15.63 | 0.266 | 80 | 4.00 | 201 | 20 |
| 38974 | J151133.48+092824.2 | CGCG077-036 | 0.0353 | 11.17 | 4.82 | 6.22 | 21.45 | 9.26 | 0.11 | 14.02 | 0.666 | 50 | 5.97 | 144 | 3 |
| 10297 | J151252.96+043050.4 | CGCG049-043 | 0.0370 | 11.14 | 3.15 | 3.24 | 10.82 | 9.55 | 0.14 | 13.74 | 0.707 | 46 | 5.75 | 1408 | 4 |
| 39211 | J151435.92+082002.1 | CGCG077-049 | 0.0334 | 11.03 | 3.38 | 3.49 | 11.40 | 9.47 | 0.08 | 13.69 | 0.492 | 63 | 5.61 | 135 | 4 |
| 42011 | J151615.35+064747.5 | CGCG049-081 | 0.0343 | 10.78 | 3.15 | 3.23 | 9.83 | 9.26 | 0.10 | 14.43 | 0.531 | 60 | 5.81 | 1696 | 14 |
| 42174 | J151817.19+070757.0 | … | 0.0320 | 10.34 | 2.25 | 2.29 | 6.63 | 9.17 | 0.10 | 15.33 | 0.610 | 54 | 5.69 | 2261 | 38 |
| 46564 | J151925.35+254713.6 | CGCG135-046 | 0.0323 | 11.05 | 4.15 | 4.45 | 14.31 | 9.34 | 0.13 | 13.90 | 0.761 | 41 | 5.50 | 261 | 3 |
| 39600 | J152750.23+094002.2 | … | 0.0436 | 10.72 | 2.78 | 2.84 | 8.38 | 9.09 | 0.10 | 15.16 | 0.483 | 63 | 5.19 | 107 | 49 |
| 46678 | J153339.97+242416.8 | CGCG136-012 | 0.0434 | 11.19 | 5.66 | 6.52 | 22.01 | 8.95 | 0.15 | 13.97 | 0.912 | 25 | 4.73 | 175 | 5 |
| 42287 | J154245.88+245909.9 | CGCG136-062 | 0.0336 | 11.19 | 5.29 | 5.86 | 18.15 | 9.23 | 0.12 | 13.45 | 0.659 | 50 | 4.70 | 172 | 2 |
| 10827 | J220147.39+131228.5 | … | 0.0301 | 10.11 | 2.76 | 2.84 | 7.82 | 8.81 | 0.18 | 15.65 | 0.581 | 56 | 6.50 | 208 | 29 |
| 10831 | J220322.59+123857.6 | CGCG428-021 | 0.0273 | 10.46 | 3.50 | 3.71 | 10.11 | 9.05 | 0.16 | 14.80 | 0.516 | 61 | 5.00 | 186 | 20 |
| 10856 | J220330.28+123938.9 | NGC7195 | 0.0264 | 10.78 | 4.23 | 4.45 | 12.88 | 9.24 | 0.16 | 13.94 | 0.780 | 40 | 5.41 | 186 | 5 |
| 10813 | J220358.03+115421.2 | … | 0.0268 | 10.55 | 3.70 | 3.92 | 12.05 | 9.11 | 0.46 | 14.62 | 0.811 | 37 | 5.47 | 186 | 14 |
| 10836 | J220419.41+125806.2 | CGCG428-026 | 0.0274 | 10.69 | 3.53 | 3.79 | 12.43 | 9.27 | 0.15 | 14.28 | 0.564 | 57 | 6.28 | 208 | 8 |
| 10850 | J220538.79+122521.3 | … | 0.0355 | 10.28 | 3.30 | 3.41 | 8.16 | 8.69 | 0.25 | 15.76 | 0.325 | 75 | 4.00 | 186 | 58 |
| 10863 | J220848.81+132152.9 | … | 0.0275 | 10.48 | 3.20 | 3.56 | 10.93 | 9.14 | 0.20 | 15.13 | 0.389 | 70 | 5.57 | 208 | 20 |
| 10841 | J221111.69+114802.6 | … | 0.0270 | 10.36 | 3.15 | 3.40 | 9.37 | 9.05 | 0.22 | 14.66 | 0.676 | 49 | 3.68 | 3264 | 19 |
| 10885 | J221212.48+121218.6 | … | 0.0275 | 10.04 | 4.06 | 4.25 | 8.98 | 8.49 | 0.18 | 14.83 | 0.787 | 39 | 2.51 | 2790 | 20 |
| 10889 | J221236.07+140103.9 | … | 0.0266 | 10.45 | 3.23 | 3.76 | 12.67 | 9.14 | 0.17 | 14.83 | 0.832 | 34 | 5.15 | 7104 | 18 |
| 10890 | J221241.31+140434.4 | … | 0.0252 | 10.35 | 4.98 | 5.67 | 16.23 | 8.71 | 0.17 | 14.66 | 0.869 | 30 | 5.26 | 7104 | 14 |
| 10844 | J221253.09+122158.7 | … | 0.0271 | 10.16 | 2.37 | 2.50 | 7.23 | 9.10 | 0.17 | 15.36 | 0.727 | 44 | 5.62 | 2790 | 19 |
| 10896 | J221336.49+134020.7 | … | 0.0278 | 10.13 | 3.18 | 3.26 | 8.16 | 8.79 | 0.17 | 15.35 | 0.571 | 57 | 5.56 | 7104 | 21 |
| 10942 | J221530.28+134023.4 | … | 0.0251 | 10.04 | 2.32 | 2.43 | 7.92 | 9.06 | 0.18 | 15.44 | 0.828 | 35 | 5.54 | 7104 | 14 |
| 10943 | J221540.59+133616.9 | … | 0.0275 | 10.23 | 3.90 | 4.13 | 9.93 | 8.71 | 0.19 | 15.17 | 0.531 | 60 | 5.00 | 7104 | 20 |
| 10944 | J221543.66+134252.3 | … | 0.0262 | 10.05 | 1.75 | 1.85 | 5.99 | 9.28 | 0.19 | 15.45 | 0.616 | 53 | 5.51 | 7104 | 17 |
| 10950 | J221559.51+132715.3 | … | 0.0254 | 10.21 | 1.82 | 1.86 | 4.98 | 9.43 | 0.19 | 15.18 | 0.677 | 49 | 5.65 | 7104 | 15 |
| 10949 | J221600.51+130851.8 | … | 0.0262 | 10.33 | 2.59 | 2.67 | 8.98 | 9.21 | 0.20 | 14.79 | 0.350 | 73 | 5.43 | 1696 | 17 |
| 10948 | J221636.89+131514.4 | … | 0.0258 | 10.02 | 3.53 | 4.12 | 10.31 | 8.65 | 0.20 | 15.82 | 0.356 | 73 | 4.82 | 1696 | 16 |
| 10953 | J221652.39+132533.5 | … | 0.0256 | 10.21 | 2.94 | 2.94 | 8.57 | 9.01 | 0.21 | 14.98 | 0.390 | 70 | 5.55 | 1696 | 15 |
| 10952 | J221657.95+133235.0 | … | 0.0262 | 10.47 | 4.04 | 4.45 | 11.49 | 8.97 | 0.20 | 15.07 | 0.280 | 78 | 7.13 | 173 | 17 |
| 10879 | J221750.25+125941.7 | … | 0.0360 | 10.05 | 1.17 | 1.20 | 3.53 | 9.34 | 0.24 | 16.31 | 0.735 | 44 | 5.11 | 1670 | 61 |
| 10979 | J221859.40+131114.8 | CGCG428-072 | 0.0268 | 10.33 | 2.64 | 2.67 | 9.74 | 9.18 | 0.23 | 14.72 | 0.729 | 44 | 4.99 | 1670 | 18 |
| 10990 | J223137.59+130343.2 | … | 0.0367 | 10.36 | 4.68 | 4.93 | 11.47 | 8.43 | 0.18 | 16.06 | 0.123 | 90 | 2.81 | 199 | 66 |
| 10985 | J223407.83+123415.9 | … | 0.0495 | 10.78 | 3.13 | 4.39 | 10.91 | 8.94 | 0.15 | 15.71 | 0.568 | 57 | 4.28 | 207 | 61 |
| 11013 | J223650.63+143055.6 | … | 0.0358 | 10.20 | 4.43 | 4.78 | 9.58 | 8.34 | 0.20 | 15.40 | 0.742 | 43 | 3.22 | 3001 | 60 |
| 11015 | J223701.58+142417.4 | … | 0.0367 | 10.76 | 4.19 | 4.72 | 14.69 | 8.93 | 0.19 | 14.63 | 0.634 | 52 | 5.51 | 31414 | 20 |
| 11003 | J223715.17+141551.3 | … | 0.0367 | 10.29 | 2.78 | 3.01 | 7.24 | 8.82 | 0.17 | 15.81 | 0.335 | 74 | 4.05 | 31414 | 66 |
| 11019 | J223810.59+142626.1 | … | 0.0360 | 10.05 | 3.72 | 3.76 | 7.82 | 8.34 | 0.19 | 16.13 | 0.319 | 75 | 3.63 | 3141 | 61 |
| 11041 | J224237.97+132844.5 | … | 0.0373 | 10.03 | 2.81 | 3.05 | 8.53 | 8.53 | 0.13 | 16.28 | 0.940 | 20 | 5.71 | 11561 | 71 |
| 11055 | J225026.03+145510.3 | … | 0.0275 | 10.45 | 4.69 | 5.11 | 14.00 | 8.78 | 0.17 | 14.46 | 0.815 | 36 | 3.94 | 199 | 20 |
| 11087 | J225525.96+125539.3 | … | 0.0376 | 10.88 | 3.62 | 3.80 | 11.60 | 9.16 | 0.12 | 14.86 | 0.325 | 75 | 5.28 | 2905 | 13 |
| 11071 | J225726.69+130005.9 | … | 0.0257 | 10.56 | 6.24 | 7.08 | 16.92 | 8.70 | 0.19 | 14.28 | 0.571 | 57 | 4.40 | 2905 | 12 |
| 11126 | J230111.07+130932.5 | … | 0.0484 | 10.75 | 4.00 | 4.08 | 9.74 | 8.71 | 0.56 | 14.96 | 0.571 | 57 | 3.66 | 1610 | 65 |
| 11132 | J230146.58+133218.8 | … | 0.0341 | 10.62 | 2.12 | 2.16 | 7.11 | 9.45 | 0.36 | 14.64 | 0.542 | 59 | 6.21 | 1610 | 28 |
| 11231 | J230307.96+135327.4 | … | 0.0341 | 10.06 | 4.99 | 5.58 | 11.55 | 8.14 | 0.39 | 15.26 | 0.436 | 67 | 2.97 | 1610 | 49 |
| 11120 | J230343.06+135535.5 | … | 0.0271 | 10.40 | 3.56 | 3.88 | 10.23 | 8.99 | 0.42 | 14.55 | 0.367 | 72 | 3.49 | 1687 | 19 |
| 11250 | J230735.69+152754.1 | … | 0.0364 | 10.30 | 4.04 | 4.19 | 9.88 | 8.51 | 0.56 | 15.42 | 0.414 | 68 | 3.85 | 298 | 64 |
| 11268 | J231138.88+150741.6 | … | 0.0418 | 10.72 | 2.83 | 3.35 | 10.05 | 9.11 | 0.29 | 15.17 | 0.870 | 30 | 3.47 | 3284 | 42 |
| 11267 | J231142.06+150638.2 | CGCG431-010 | 0.0400 | 11.07 | 5.00 | 5.49 | 13.09 | 9.01 | 0.27 | 14.06 | 0.816 | 36 | 4.06 | 3284 | 7 |
| 11314 | J231224.51+135704.5 | … | 0.0341 | 10.54 | 3.02 | 3.28 | 9.36 | 9.06 | 0.19 | 14.89 | 0.595 | 55 | 4.19 | 3264 | 40 |
| 11297 | J231331.44+141938.6 | … | 0.0392 | 10.41 | 1.88 | 1.85 | 6.28 | 9.22 | 0.17 | 15.07 | 0.856 | 32 | 5.44 | 4965 | 87 |
| 11303 | J231340.50+131331.8 | … | 0.0395 | 10.35 | 3.76 | 4.12 | 10.06 | 8.55 | 0.16 | 16.38 | 0.200 | 90 | 4.30 | 3264 | 90 |
| 11285 | J231516.82+133201.6 | … | 0.0395 | 10.05 | 2.27 | 2.51 | 6.48 | 8.69 | 0.15 | 16.95 | 0.218 | 85 | 4.80 | 3335 | 89 |
| 11280 | J231530.93+134040.6 | … | 0.0400 | 10.99 | 5.22 | 5.61 | 19.00 | 8.89 | 0.17 | 14.36 | 0.560 | 58 | 5.28 | 3335 | 10 |
| 11462 | J231756.35+135352.1 | … | 0.0395 | 10.90 | 3.66 | 4.20 | 14.65 | 9.12 | 0.14 | 14.47 | 0.572 | 57 | 4.37 | 2256 | 15 |
| 11270 | J231816.95+133426.6 | … | 0.0395 | 10.07 | 2.32 | 2.41 | 6.93 | 8.69 | 0.15 | 16.23 | 0.639 | 52 | 3.91 | 3335 | 90 |
| 11349 | J231836.21+151758.7 | … | 0.0256 | 10.13 | 4.99 | 5.52 | 12.09 | 8.47 | 0.11 | 14.76 | 0.523 | 60 | 2.88 | 4851 | 15 |
| 11437 | J232215.37+140450.6 | … | 0.0264 | 10.56 | 4.35 | 5.05 | 13.73 | 8.99 | 0.13 | 14.55 | 0.368 | 72 | 3.83 | 1676 | 13 |
| 11513 | J232239.48+154405.3 | … | 0.0411 | 10.62 | 4.19 | 4.47 | 9.65 | 8.68 | 0.11 | 15.32 | 0.772 | 40 | 4.53 | 3180 | 62 |
| 11514 | J232326.53+152510.4 | … | 0.0428 | 10.27 | 1.56 | 1.65 | 4.91 | 9.16 | 0.14 | 16.27 | 0.643 | 51 | 4.27 | 3180 | 124 |
| 11494 | J232335.34+151148.8 | … | 0.0427 | 10.62 | 4.22 | 4.65 | 9.63 | 8.65 | 0.21 | 15.09 | 0.614 | 54 | 2.95 | 3180 | 71 |
| 11397 | J232447.10+142301.6 | … | 0.0395 | 10.46 | 2.01 | 2.06 | 6.59 | 9.21 | 0.11 | 15.52 | 0.870 | 30 | 5.22 | 1681 | 89 |
| 11383 | J232548.27+140317.2 | … | 0.0377 | 10.21 | 3.01 | 3.29 | 8.49 | 8.65 | 0.13 | 15.78 | 0.643 | 51 | 3.23 | 2434 | 74 |
| 11366 | J232621.83+141230.1 | … | 0.0430 | 10.87 | 3.38 | 3.55 | 9.86 | 9.09 | 0.14 | 14.74 | 0.663 | 50 | 5.47 | 2434 | 23 |
| 11357 | J232624.38+135742.9 | … | 0.0433 | 10.87 | 3.22 | 3.36 | 10.07 | 9.12 | 0.14 | 14.88 | 0.446 | 66 | 5.81 | 2434 | 24 |
| 11582 | J232748.74+142831.1 | … | 0.0411 | 10.86 | 3.83 | 4.41 | 11.90 | 9.00 | 0.18 | 14.86 | 0.710 | 46 | 5.56 | 2932 | 20 |
| 11687 | J232753.17+144239.5 | … | 0.0416 | 10.92 | 2.88 | 3.15 | 10.61 | 9.30 | 0.21 | 14.86 | 0.772 | 40 | 5.55 | 2932 | 16 |
| 11697 | J233113.42+151402.9 | … | 0.0312 | 10.02 | 2.97 | 3.38 | 9.17 | 8.64 | 0.17 | 16.42 | 0.442 | 66 | 3.88 | 2473 | 34 |
| 11727 | J233341.93+140429.8 | … | 0.0328 | 10.40 | 1.88 | 2.21 | 7.32 | 9.37 | 0.22 | 15.45 | 0.864 | 31 | 5.32 | 2327 | 42 |
| 11763 | J234157.75+151407.2 | … | 0.0256 | 10.21 | 2.30 | 2.43 | 6.94 | 9.22 | 0.10 | 15.94 | 0.270 | 79 | 4.59 | 2963 | 15 |
| 11770 | J234646.15+160235.0 | CGCG455-046 | 0.0416 | 11.31 | 4.94 | 5.45 | 16.52 | 9.22 | 0.08 | 13.93 | 0.785 | 39 | 5.14 | 247 | 3 |
| 11754 | J234823.35+143004.8 | … | 0.0409 | 10.77 | 3.26 | 3.57 | 10.06 | 9.06 | 0.11 | 15.00 | 0.606 | 54 | 5.56 | 2942 | 29 |
| 11783 | J235224.35+143535.1 | … | 0.0270 | 10.33 | 2.22 | 2.37 | 6.66 | 9.33 | 0.10 | 15.02 | 0.745 | 43 | 5.58 | 1699 | 19 |
| 11808 | J235257.31+154244.8 | … | 0.0479 | 10.78 | 4.28 | 4.56 | 11.90 | 8.69 | 0.11 | 14.97 | 0.678 | 49 | 4.97 | 1693 | 55 |
| 11815 | J235308.28+160351.9 | CGCG455-064 | 0.0491 | 11.12 | 2.79 | 3.06 | 10.14 | 9.38 | 0.11 | 14.56 | 0.715 | 46 | 4.99 | 3673 | 13 |
| 11845 | J235644.47+135435.4 | … | 0.0363 | 10.60 | 4.90 | 5.32 | 13.15 | 8.65 | 0.16 | 14.98 | 0.347 | 73 | 4.10 | 1705 | 39 |
| 11824 | J235747.57+153649.2 | … | 0.0380 | 10.25 | 6.17 | 6.33 | 14.09 | 8.05 | 0.14 | 15.46 | 0.486 | 63 | 3.24 | 1677 | 76 |
| c | rms | Log | |||||||||||
|---|---|---|---|---|---|---|---|---|---|---|---|---|---|
| GASS | SDSS ID | (min) | (km s-1) | (km s-1) | (km s-1) | (Jy km s-1) | (mJy) | S/N | (M⊙) | Log / | Q | ||
| (1) | (2) | (3) | (4) | (5) | (6) | (7) | (8) | (9) | (10) | (11) | (12) | (13) | (14) |
| 11834 | J000047.89+141639.1 | 0.0362 | 4 | 15 | 0.036162 | 380 16 | 359 | 0.72 0.12 | 0.67 | 10.0 | 9.62 | 1.09 | 1* |
| 11825 | J000210.19+140810.3 | 0.0420 | 43 | 21 | 0.042186 | 419 14 | 392 | 0.23 0.04 | 0.19 | 8.8 | 9.26 | 1.36 | 1 |
| 11917 | J000742.65+151112.7 | 0.0446 | 25 | 13 | 0.044594 | 401 3 | 378 | 0.43 0.05 | 0.30 | 14.0 | 9.58 | 1.16 | 5* |
| 3163 | J002846.83+150529.3 | 0.0422 | 15 | 21 | 0.042253 | 394 2 | 368 | 0.48 0.07 | 0.32 | 11.5 | 9.58 | 1.05 | 1 |
| 3151 | J003143.05+142911.2 | 0.0381 | 76 | 13 | 0.038243 | 328 9 | 309 | 0.13 0.02 | 0.15 | 9.5 | 8.93 | 1.47 | 1 |
| 27181 | J003248.17+144738.1 | 0.0418 | 5 | 21 | 0.041922 | 297 12 | 275 | 0.44 0.09 | 0.50 | 7.9 | 9.53 | 1.07 | 1 |
| 27167 | J003921.66+142811.5 | 0.0380 | 5 | 21 | 0.038093 | 246 13 | 227 | 0.62 0.10 | 0.56 | 10.9 | 9.60 | 0.77 | 1* |
| 3189 | J004023.48+143649.4 | 0.0384 | 9 | 16 | 0.038583 | 412 13 | 389 | 0.83 0.08 | 0.44 | 16.6 | 9.74 | 0.31 | 1* |
| 27219 | J004125.29+134334.3 | 0.0332 | 19 | 15 | 0.033323 | 339 5 | 320 | 0.30 0.05 | 0.31 | 9.6 | 9.17 | 1.04 | 1 |
| 3233 | J005134.04+135452.7 | 0.0392 | 10 | 16 | 0.039274 | 266 3 | 248 | 0.28 0.06 | 0.39 | 7.8 | 9.27 | 0.95 | 1 |
| 3439 | J010905.96+144520.8 | 0.0386 | 10 | 13 | 0.038540 | 301 2 | 284 | 0.54 0.07 | 0.47 | 13.2 | 9.55 | 0.80 | 1* |
| 3465 | J011221.82+150039.0 | 0.0292 | 15 | 13 | 0.029224 | 287 5 | 273 | 0.70 0.06 | 0.41 | 19.9 | 9.42 | 0.77 | 1* |
| 3509 | J011711.65+132027.3 | 0.0484 | 35 | 21 | 0.048353 | 444 15 | 413 | 0.28 0.05 | 0.21 | 9.1 | 9.47 | 1.34 | 1* |
| 3524 | J011716.09+143720.5 | 0.0380 | 25 | 16 | 0.038096 | 393 15 | 371 | 0.43 0.06 | 0.30 | 12.9 | 9.44 | 1.29 | 1 |
| 3519 | J011728.11+144215.9 | 0.0427 | 10 | 16 | 0.042766 | 296 6 | 276 | 0.42 0.07 | 0.43 | 10.2 | 9.53 | 1.22 | 1* |
| 3819 | J014143.18+134032.8 | 0.0453 | 4 | 16 | 0.045365 | 222 10 | 205 | 0.95 0.09 | 0.61 | 18.6 | 9.94 | 0.73 | 1 |
| 4203 | J015027.35+141140.0 | 0.0341 | 10 | 13 | 0.033997 | 322 2 | 305 | 0.65 0.06 | 0.39 | 18.2 | 9.52 | 0.66 | 1 |
| 4145 | J015517.63+125935.5 | 0.0322 | 14 | 15 | 0.031855 | 337 19 | 319 | 0.56 0.06 | 0.32 | 16.9 | 9.40 | 0.90 | 1* |
| 4137 | J015651.99+131246.0 | 0.0445 | 15 | 21 | 0.044561 | 240 25 | 220 | 0.40 0.05 | 0.31 | 12.6 | 9.54 | 1.36 | 1* |
| 4233 | J015707.32+145543.5 | 0.0433 | 5 | 16 | 0.043363 | 147 13 | 134 | 0.54 0.08 | 0.68 | 11.6 | 9.65 | 1.23 | 5* |
| 4223 | J015712.97+144407.6 | 0.0260 | 8 | 21 | 0.025948 | 429 25 | 408 | 0.99 0.10 | 0.43 | 16.8 | 9.47 | 1.09 | 1* |
| 3918 | J015718.40+130745.8 | 0.0327 | 40 | 15 | 0.032759 | 138 35 | 127 | 0.12 0.02 | 0.21 | 8.7 | 8.75 | 1.62 | 1* |
| 4017 | J020517.54+133020.6 | 0.0258 | 5 | 13 | 0.025801 | 130 3 | 121 | 0.62 0.06 | 0.68 | 16.0 | 9.25 | 0.98 | 1 |
| 3977 | J020744.46+140453.7 | 0.0324 | 5 | 13 | 0.032482 | 294 1 | 278 | 0.70 0.11 | 0.73 | 11.1 | 9.51 | 0.75 | 1* |
| 4030 | J020939.47+135859.4 | 0.0491 | 5 | 16 | 0.049204 | 137 4 | 123 | 0.38 0.07 | 0.61 | 9.5 | 9.61 | 1.72 | 1* |
| 4038 | J021121.82+143015.5 | 0.0417 | 5 | 16 | 0.041729 | 445 29 | 419 | 1.14 0.11 | 0.58 | 15.8 | 9.94 | 0.78 | 1* |
| 4039 | J021131.43+141202.4 | 0.0254 | 10 | 12 | 0.025428 | 308 5 | 294 | 1.11 0.07 | 0.49 | 25.8 | 9.50 | 0.82 | 1* |
| 4048 | J021219.38+133645.6 | 0.0414 | 10 | 16 | 0.041399 | 359 8 | 337 | 0.71 0.08 | 0.46 | 14.6 | 9.73 | 0.82 | 1* |
| 3981 | J021404.39+131156.3 | 0.0416 | 35 | 16 | 0.041766 | 426 4 | 402 | 0.27 0.04 | 0.23 | 9.9 | 9.32 | 1.23 | 1* |
| 4057 | J021419.24+135611.2 | 0.0397 | 10 | 13 | 0.039734 | 350 14 | 330 | 1.13 0.09 | 0.57 | 21.0 | 9.90 | 0.62 | 1* |
| 56304 | J080534.10+102336.2 | 0.0340 | 4 | 13 | 0.034007 | 324 1 | 308 | 1.67 0.12 | 0.81 | 22.6 | 9.93 | 0.96 | 1* |
| 56632 | J090437.07+133314.7 | 0.0281 | 9 | 21 | 0.028390 | 744 10 | 713 | 0.68 0.10 | 0.34 | 8.4 | 9.38 | 1.62 | 2* |
| 16753 | J091828.43+062003.7 | 0.0335 | 40 | 13 | 0.033520 | 113 4 | 103 | 0.08 0.02 | 0.22 | 6.6 | 8.58 | 1.71 | 1 |
| 18702 | J095051.58+081340.7 | 0.0299 | 15 | 15 | 0.029881 | 348 4 | 330 | 0.48 0.07 | 0.41 | 11.1 | 9.27 | 0.93 | 1* |
| 18707 | J095150.14+082213.8 | 0.0405 | 8 | 13 | 0.040481 | 314 4 | 296 | 0.74 0.09 | 0.57 | 14.5 | 9.73 | 0.84 | 1* |
| 18673 | J095301.79+072736.4 | 0.0385 | 25 | 21 | 0.038467 | 374 2 | 350 | 0.33 0.05 | 0.24 | 11.0 | 9.33 | 1.05 | 1* |
| 18686 | J095302.62+075029.3 | 0.0411 | 5 | 13 | 0.041025 | 363 8 | 342 | 2.74 0.10 | 0.61 | 46.2 | 10.31 | 0.24 | 1* |
| 18681 | J095324.56+074956.2 | 0.0393 | 14 | 16 | 0.039384 | 443 8 | 419 | 0.73 0.08 | 0.39 | 15.1 | 9.70 | 0.97 | 1* |
| 20292 | J095349.23+091137.6 | 0.0299 | 13 | 15 | 0.029884 | 335 15 | 318 | 0.40 0.07 | 0.39 | 10.3 | 9.20 | 1.47 | 1* |
| 20448 | J095812.59+110635.5 | 0.0272 | 10 | 13 | 0.027312 | 281 3 | 267 | 0.71 0.06 | 0.46 | 18.4 | 9.37 | 0.69 | 1* |
| 5035 | J100152.69+030040.7 | 0.0441 | 15 | 21 | 0.044017 | 391 50 | 364 | 0.43 0.07 | 0.32 | 10.4 | 9.57 | 1.20 | 1* |
| 18830 | J101100.68+085920.7 | 0.0320 | 19 | 15 | 0.032102 | 308 2 | 291 | 0.27 0.05 | 0.29 | 9.5 | 9.08 | 1.19 | 1 |
| 18798 | J101329.66+075415.5 | 0.0458 | 10 | 21 | 0.045521 | 692 37 | 651 | 0.48 0.10 | 0.36 | 5.8 | 9.64 | 1.58 | 3* |
| 18877 | J102025.15+074037.8 | 0.0452 | 15 | 13 | 0.045315 | 501 1 | 473 | 0.45 0.08 | 0.42 | 8.5 | 9.61 | 1.36 | 1 |
| 18887 | J102055.54+081849.4 | 0.0458 | 15 | 16 | 0.045745 | 529 7 | 499 | 0.62 0.08 | 0.38 | 10.9 | 9.76 | 1.00 | 1 |
| 26320 | J102238.71+120517.8 | 0.0450 | 20 | 16 | 0.044981 | 538 2 | 508 | 0.42 0.07 | 0.32 | 8.7 | 9.58 | 1.13 | 1 |
| 18862 | J102241.20+082003.2 | 0.0446 | 15 | 16 | 0.044718 | 410 24 | 385 | 0.54 0.07 | 0.39 | 12.0 | 9.68 | 1.00 | 1* |
| 23026 | J102721.97+110447.9 | 0.0323 | 4 | 21 | 0.032379 | 616 4 | 587 | 0.96 0.16 | 0.58 | 8.3 | 9.65 | 1.51 | 1* |
| 26570 | J103905.90+132153.5 | 0.0325 | 30 | 15 | 0.032442 | 217 20 | 202 | 0.16 0.03 | 0.23 | 8.6 | 8.87 | 1.13 | 1 |
| 23227 | J103913.15+121130.9 | 0.0479 | 10 | 13 | 0.047943 | 592 3 | 559 | 1.10 0.11 | 0.52 | 13.8 | 10.05 | 1.13 | 1 |
| 15211 | J104024.66+065137.7 | 0.0303 | 5 | 13 | 0.030338 | 483 5 | 462 | 1.73 0.12 | 0.64 | 22.2 | 9.84 | 1.05 | 1* |
| 26639 | J104046.05+134659.9 | 0.0317 | 40 | 21 | 0.031915 | 428 22 | 405 | 0.15 0.04 | 0.19 | 5.7 | 8.82 | 1.42 | 3* |
| 15166 | J104121.14+061644.3 | 0.0339 | 8 | 13 | 0.033913 | 185 2 | 172 | 0.61 0.08 | 0.67 | 13.3 | 9.49 | 0.53 | 1* |
| 29555 | J104145.56+135352.9 | 0.0316 | 15 | 15 | 0.031649 | 322 8 | 304 | 0.40 0.05 | 0.32 | 12.5 | 9.24 | 1.14 | 1* |
| 57099 | J104221.91+152134.6 | 0.0490 | 10 | 16 | 0.049017 | 192 16 | 176 | 0.31 0.06 | 0.46 | 8.6 | 9.52 | 1.58 | 1* |
| 15151 | J104251.39+055135.5 | 0.0334 | 8 | 15 | 0.033316 | 459 11 | 437 | 0.94 0.11 | 0.57 | 12.9 | 9.66 | 1.33 | 1* |
| 29624 | J110050.33+133551.4 | 0.0340 | 9 | 15 | 0.034080 | 317 6 | 299 | 0.78 0.08 | 0.48 | 16.5 | 9.60 | 0.72 | 1 |
| 47896 | J110851.20+282832.5 | 0.0363 | 4 | 13 | 0.036432 | 480 13 | 457 | 3.17 0.15 | 0.82 | 32.0 | 10.27 | 0.85 | 1 |
| 12318 | J111443.35+040128.2 | 0.0417 | 8 | 21 | 0.041272 | 469 1 | 440 | 0.39 0.09 | 0.38 | 6.6 | 9.46 | 1.75 | 2* |
| 12293 | J112029.23+040742.1 | 0.0496 | 5 | 21 | 0.049618 | 553 3 | 516 | 0.53 0.14 | 0.54 | 5.4 | 9.76 | 1.56 | 2 |
| 29892 | J112946.35+152001.1 | 0.0366 | 5 | 21 | 0.036976 | 695 11 | 660 | 1.31 0.15 | 0.51 | 11.3 | 9.90 | 1.12 | 5* |
| 23757 | J113645.51+132009.9 | 0.0342 | 15 | 15 | 0.034140 | 394 26 | 374 | 0.40 0.06 | 0.34 | 10.7 | 9.32 | 1.19 | 1* |
| 18087 | J114940.66+094255.1 | 0.0352 | 30 | 15 | 0.035221 | 312 1 | 294 | 0.17 0.04 | 0.23 | 7.5 | 8.97 | 1.42 | 1* |
| 24168 | J121612.36+132615.4 | 0.0260 | 15 | 13 | 0.026108 | 459 8 | 442 | 0.89 0.07 | 0.38 | 20.3 | 9.42 | 1.02 | 1 |
| 28057 | J122532.62+080301.4 | 0.0381 | 10 | 13 | 0.038136 | 221 2 | 207 | 0.38 0.06 | 0.49 | 10.3 | 9.39 | 0.91 | 1 |
| 18576 | J123625.93+085639.7 | 0.0277 | 24 | 21 | 0.027709 | 328 4 | 309 | 0.18 0.05 | 0.24 | 6.2 | 8.77 | 1.49 | 1 |
| 24437 | J123949.27+133256.8 | 0.0466 | 10 | 13 | 0.046425 | 552 22 | 521 | 1.93 0.10 | 0.50 | 27.2 | 10.27 | 0.40 | 5* |
| 28482 | J124307.28+111243.1 | 0.0282 | 5 | 13 | 0.028183 | 357 3 | 341 | 1.70 0.11 | 0.70 | 25.8 | 9.77 | 0.46 | 5* |
| 25167 | J130256.89+125250.0 | 0.0362 | 10 | 13 | 0.036205 | 432 2 | 411 | 0.92 0.08 | 0.48 | 17.5 | 9.72 | 0.77 | 1 |
| 40425 | J130404.23+084820.6 | 0.0358 | 4 | 15 | 0.035708 | 316 11 | 297 | 0.72 0.11 | 0.69 | 10.5 | 9.61 | 0.56 | 1* |
| 13158 | J130454.21+034928.1 | 0.0410 | 10 | 10 | 0.040918 | 246 12 | 231 | 1.69 0.07 | 0.61 | 39.0 | 10.10 | 0.71 | 1* |
| 6749 | J130750.80+031140.7 | 0.0386 | 9 | 16 | 0.038443 | 462 5 | 438 | 1.03 0.11 | 0.56 | 14.3 | 9.83 | 1.29 | 1* |
| 25296 | J132357.45+120233.3 | 0.0390 | 8 | 21 | 0.039157 | 536 4 | 505 | 0.89 0.11 | 0.44 | 11.8 | 9.78 | 1.23 | 1* |
| 51190 | J134404.06+253948.6 | 0.0486 | 10 | 16 | 0.048554 | 515 26 | 484 | 1.07 0.09 | 0.41 | 18.1 | 10.05 | 0.98 | 1* |
| 13624 | J135152.41+032718.0 | 0.0296 | 5 | 13 | 0.029634 | 294 1 | 279 | 4.09 0.11 | 0.76 | 62.9 | 10.20 | 0.11 | 1 |
| 44846 | J135512.58+250117.1 | 0.0310 | 4 | 15 | 0.031065 | 339 3 | 321 | 0.72 0.12 | 0.70 | 10.2 | 9.49 | 1.51 | 1* |
| 40260 | J135827.10+132904.7 | 0.0388 | 25 | 21 | 0.039140 | 683 4 | 647 | 0.43 0.07 | 0.25 | 7.8 | 9.47 | 1.30 | 5* |
| 41303 | J140741.05+094835.8 | 0.0374 | 20 | 16 | 0.037573 | 184 6 | 170 | 0.15 0.04 | 0.29 | 6.7 | 8.96 | 1.27 | 5* |
| 38538 | J141119.35+113105.1 | 0.0385 | 45 | 16 | 0.038607 | 170 3 | 156 | 0.14 0.03 | 0.22 | 8.8 | 8.97 | 1.16 | 1* |
| 38546 | J141229.86+111425.9 | 0.0282 | 8 | 15 | 0.028260 | 529 19 | 507 | 0.83 0.11 | 0.53 | 10.8 | 9.47 | 1.56 | 1 |
| 30854 | J141833.16+071712.4 | 0.0257 | 15 | 13 | 0.025698 | 327 4 | 313 | 0.64 0.06 | 0.38 | 19.0 | 9.27 | 0.89 | 1* |
| 7520 | J143314.34+023909.6 | 0.0291 | 15 | 21 | 0.029100 | 462 40 | 438 | 0.64 0.08 | 0.36 | 12.0 | 9.37 | 1.43 | 1* |
| 9585 | J143419.01+033951.7 | 0.0336 | 8 | 21 | 0.033633 | 561 1 | 533 | 0.51 0.13 | 0.49 | 5.7 | 9.40 | 1.64 | 3* |
| 46068 | J143709.53+251503.0 | 0.0340 | 4 | 21 | 0.034030 | 705 9 | 672 | 0.93 0.17 | 0.58 | 7.1 | 9.68 | 1.72 | 1* |
| 41703 | J144119.18+085256.5 | 0.0294 | 28 | 21 | 0.029490 | 247 15 | 230 | 0.12 0.04 | 0.23 | 5.2 | 8.66 | 1.50 | 2 |
| 29205 | J144551.55+100910.4 | 0.0375 | 15 | 16 | 0.037553 | 326 5 | 307 | 0.45 0.06 | 0.34 | 13.0 | 9.44 | 0.67 | 1 |
| 38732 | J145033.16+093742.2 | 0.0499 | 18 | 21 | 0.050228 | 494 5 | 460 | 0.28 0.08 | 0.32 | 5.4 | 9.49 | 1.59 | 3* |
| 38706 | J145129.30+092005.9 | 0.0293 | 5 | 15 | 0.029310 | 173 51 | 160 | 0.57 0.10 | 0.67 | 11.9 | 9.33 | 1.63 | 5* |
| 41783 | J145730.93+082326.3 | 0.0371 | 10 | 21 | 0.037032 | 587 65 | 556 | 0.83 0.10 | 0.37 | 11.7 | 9.70 | 1.39 | 2* |
| 38923 | J145758.08+110027.4 | 0.0479 | 20 | 16 | 0.047967 | 429 3 | 402 | 0.47 0.07 | 0.34 | 11.3 | 9.68 | 1.36 | 1* |
| 41793 | J145841.32+075905.9 | 0.0376 | 4 | 27 | 0.037633 | 350 7 | 324 | 0.32 0.11 | 0.47 | 4.9 | 9.30 | 1.95 | 3* |
| 46678 | J153339.97+242416.8 | 0.0434 | 10 | 21 | 0.043497 | 249 2 | 229 | 0.26 0.08 | 0.44 | 5.7 | 9.33 | 1.86 | 2 |
| 42287 | J154245.88+245909.9 | 0.0336 | 4 | 21 | 0.033703 | 588 1 | 558 | 0.86 0.18 | 0.67 | 6.8 | 9.64 | 1.55 | 1* |
| 10831 | J220322.59+123857.6 | 0.0273 | 10 | 15 | 0.026895 | 700 41 | 675 | 2.51 0.13 | 0.52 | 25.0 | 9.90 | 0.56 | 5* |
| 10856 | J220330.28+123938.9 | 0.0264 | 5 | 13 | 0.026538 | 465 13 | 446 | 2.82 0.14 | 0.76 | 31.9 | 9.94 | 0.84 | 5* |
| 10850 | J220538.79+122521.3 | 0.0355 | 10 | 15 | 0.035461 | 298 18 | 281 | 0.54 0.08 | 0.48 | 11.7 | 9.48 | 0.80 | 1* |
| 10841 | J221111.69+114802.6 | 0.0270 | 5 | 15 | 0.027039 | 308 10 | 292 | 0.63 0.09 | 0.58 | 11.2 | 9.30 | 1.06 | 1 |
| 10885 | J221212.48+121218.6 | 0.0275 | 15 | 13 | 0.027579 | 208 3 | 196 | 0.39 0.05 | 0.42 | 12.9 | 9.11 | 0.93 | 1 |
| 10889 | J221236.07+140103.9 | 0.0266 | 10 | 15 | 0.026598 | 310 14 | 295 | 1.04 0.07 | 0.44 | 24.7 | 9.51 | 0.94 | 5* |
| 10844 | J221253.09+122158.7 | 0.0271 | 10 | 13 | 0.026999 | 146 8 | 137 | 0.33 0.05 | 0.48 | 11.2 | 9.02 | 1.14 | 5* |
| 10990 | J223137.59+130343.2 | 0.0367 | 10 | 13 | 0.036785 | 396 2 | 376 | 1.16 0.09 | 0.53 | 21.7 | 9.84 | 0.52 | 1 |
| 10985 | J223407.83+123415.9 | 0.0495 | 15 | 13 | 0.049508 | 408 7 | 383 | 0.98 0.07 | 0.42 | 22.3 | 10.03 | 0.76 | 1* |
| 11013 | J223650.63+143055.6 | 0.0358 | 10 | 15 | 0.035815 | 298 16 | 280 | 0.44 0.07 | 0.41 | 11.3 | 9.40 | 0.80 | 1* |
| 11015 | J223701.58+142417.4 | 0.0367 | 5 | 15 | 0.036475 | 528 4 | 502 | 1.24 0.13 | 0.62 | 13.6 | 9.86 | 0.90 | 5* |
| 11003 | J223715.17+141551.3 | 0.0367 | 25 | 16 | 0.037393 | 679 12 | 647 | 1.05 0.06 | 0.26 | 21.1 | 9.81 | 0.48 | 5* |
| 11019 | J223810.59+142626.1 | 0.0360 | 59 | 21 | 0.036002 | 299 14 | 279 | 0.12 0.03 | 0.16 | 6.8 | 8.83 | 1.22 | 2* |
| 11055 | J225026.03+145510.3 | 0.0275 | 14 | 15 | 0.027429 | 39 21 | 31 | 0.17 0.03 | 0.38 | 13.2 | 8.76 | 1.69 | 1* |
| 11071 | J225726.69+130005.9 | 0.0257 | 13 | 15 | 0.025744 | 254 15 | 240 | 0.36 0.05 | 0.36 | 11.2 | 9.01 | 1.55 | 1* |
| 11126 | J230111.07+130932.5 | 0.0484 | 14 | 16 | 0.048330 | 343 8 | 319 | 0.40 0.07 | 0.39 | 9.8 | 9.62 | 1.13 | 1* |
| 11231 | J230307.96+135327.4 | 0.0341 | 5 | 13 | 0.034084 | 262 3 | 247 | 0.78 0.10 | 0.70 | 13.6 | 9.60 | 0.46 | 1* |
| 11120 | J230343.06+135535.5 | 0.0271 | 19 | 21 | 0.027092 | 475 81 | 453 | 0.33 0.07 | 0.28 | 7.6 | 9.02 | 1.38 | 3* |
| 11250 | J230735.69+152754.1 | 0.0364 | 14 | 15 | 0.036288 | 434 4 | 412 | 0.38 0.07 | 0.38 | 8.2 | 9.34 | 0.96 | 1* |
| 11268 | J231138.88+150741.6 | 0.0418 | 20 | 16 | 0.041826 | 385 14 | 362 | 0.48 0.06 | 0.33 | 13.3 | 9.57 | 1.15 | 1* |
| 11314 | J231224.51+135704.5 | 0.0341 | 10 | 15 | 0.034174 | 480 17 | 457 | 1.09 0.10 | 0.48 | 17.0 | 9.75 | 0.79 | 5* |
| 11297 | J231331.44+141938.6 | 0.0392 | 89 | 21 | 0.039457 | 481 11 | 453 | 0.12 0.03 | 0.14 | 5.5 | 8.92 | 1.49 | 3 |
| 11303 | J231340.50+131331.8 | 0.0395 | 25 | 16 | 0.039544 | 325 23 | 305 | 0.35 0.05 | 0.32 | 10.7 | 9.38 | 0.97 | 1* |
| 11285 | J231516.82+133201.6 | 0.0395 | 90 | 21 | 0.039437 | 345 18 | 322 | 0.13 0.03 | 0.12 | 8.5 | 8.94 | 1.11 | 1* |
| 11462 | J231756.35+135352.1 | 0.0395 | 10 | 13 | 0.039694 | 472 2 | 448 | 0.92 0.08 | 0.46 | 16.7 | 9.81 | 1.09 | 1* |
| 11270 | J231816.95+133426.6 | 0.0395 | 90 | 21 | 0.039554 | 304 17 | 283 | 0.07 0.02 | 0.12 | 5.1 | 8.70 | 1.37 | 3* |
| 11349 | J231836.21+151758.7 | 0.0256 | 15 | 21 | 0.025684 | 251 10 | 235 | 0.39 0.06 | 0.35 | 11.1 | 9.06 | 1.07 | 1 |
| 11437 | J232215.37+140450.6 | 0.0264 | 5 | 13 | 0.026398 | 371 7 | 356 | 0.87 0.11 | 0.66 | 13.6 | 9.42 | 1.14 | 1 |
| 11513 | J232239.48+154405.3 | 0.0411 | 62 | 21 | 0.041302 | 216 11 | 197 | 0.07 0.03 | 0.16 | 4.7 | 8.75 | 1.87 | 3* |
| 11514 | J232326.53+152510.4 | 0.0428 | 90 | 21 | 0.042826 | 337 11 | 313 | 0.10 0.03 | 0.16 | 5.4 | 8.91 | 1.36 | 3* |
| 11494 | J232335.34+151148.8 | 0.0427 | 13 | 13 | 0.042806 | 324 3 | 304 | 0.48 0.06 | 0.40 | 13.2 | 9.59 | 1.03 | 1 |
| 11383 | J232548.27+140317.2 | 0.0377 | 18 | 16 | 0.037743 | 256 14 | 239 | 0.25 0.05 | 0.33 | 8.7 | 9.20 | 1.01 | 1* |
| 11687 | J232753.17+144239.5 | 0.0416 | 25 | 16 | 0.041692 | 588 4 | 557 | 0.28 0.06 | 0.27 | 6.5 | 9.34 | 1.58 | 1 |
| 11697 | J233113.42+151402.9 | 0.0312 | 15 | 13 | 0.031198 | 297 9 | 282 | 0.33 0.06 | 0.39 | 9.8 | 9.15 | 0.87 | 1 |
| 11727 | J233341.93+140429.8 | 0.0328 | 43 | 15 | 0.032893 | 271 1 | 254 | 0.10 0.03 | 0.21 | 5.3 | 8.68 | 1.72 | 3 |
| 11763 | J234157.75+151407.2 | 0.0256 | 13 | 12 | 0.025548 | 298 4 | 284 | 1.16 0.06 | 0.41 | 32.9 | 9.52 | 0.69 | 5* |
| 11808 | J235257.31+154244.8 | 0.0479 | 45 | 21 | 0.048033 | 421 11 | 392 | 0.19 0.05 | 0.21 | 6.6 | 9.29 | 1.49 | 3* |
| 11815 | J235308.28+160351.9 | 0.0491 | 13 | 21 | 0.048924 | 889 3 | 837 | 0.87 0.11 | 0.33 | 9.1 | 9.97 | 1.15 | 5* |
| 11845 | J235644.47+135435.4 | 0.0363 | 5 | 21 | 0.036522 | 288 22 | 268 | 1.20 0.10 | 0.54 | 20.2 | 9.85 | 0.75 | 5* |
| 11824 | J235747.57+153649.2 | 0.0380 | 9 | 16 | 0.037973 | 306 8 | 288 | 0.54 0.09 | 0.52 | 10.5 | 9.53 | 0.72 | 1* |
| rms | Log ,lim | ||||||
|---|---|---|---|---|---|---|---|
| GASS | SDSS ID | (min) | (mJy) | (M⊙) | Log ,lim/ | Note | |
| (1) | (2) | (3) | (4) | (5) | (6) | (7) | (8) |
| 12005 | J002420.72+144632.3 | 0.0309 | 35 | 0.21 | 8.62 | 1.44 | * |
| 12002 | J002504.00+145815.2 | 0.0367 | 65 | 0.17 | 8.68 | 1.80 | * |
| 3301 | J005915.31+133433.3 | 0.0404 | 16 | 0.33 | 9.07 | 1.85 | … |
| 3435 | J010832.07+150122.9 | 0.0414 | 33 | 0.25 | 8.97 | 1.79 | … |
| 3508 | J011900.04+143643.1 | 0.0365 | 64 | 0.17 | 8.69 | 1.68 | * |
| 3757 | J012227.97+153238.4 | 0.0376 | 65 | 0.21 | 8.80 | 1.72 | * |
| 3854 | J013854.76+150117.7 | 0.0279 | 4 | 0.63 | 9.02 | 1.89 | … |
| 3859 | J013901.89+145808.5 | 0.0285 | 24 | 0.26 | 8.65 | 1.53 | * |
| 3821 | J014042.68+133304.6 | 0.0447 | 27 | 0.26 | 9.05 | 1.82 | … |
| 4094 | J014326.66+131913.0 | 0.0276 | 15 | 0.35 | 8.76 | 1.79 | … |
| 4119 | J014629.79+135709.6 | 0.0444 | 5 | 0.55 | 9.37 | 1.82 | * |
| 4195 | J014906.09+142550.6 | 0.0445 | 85 | 0.18 | 8.89 | 1.73 | … |
| 4074 | J014911.62+125111.6 | 0.0262 | 4 | 0.64 | 8.96 | 2.21 | … |
| 4065 | J014941.82+124458.2 | 0.0490 | 80 | 0.16 | 8.91 | 1.26 | … |
| 3880 | J020519.88+131530.7 | 0.0270 | 16 | 0.36 | 8.74 | 1.78 | * |
| 4040 | J021139.06+140830.3 | 0.0269 | 19 | 0.33 | 8.70 | 1.62 | * |
| 3985 | J021412.12+132612.8 | 0.0411 | 29 | 0.24 | 8.94 | 1.82 | … |
| 51416 | J075559.95+125853.2 | 0.0445 | 4 | 0.70 | 9.48 | 1.79 | … |
| 56319 | J080322.76+095745.8 | 0.0345 | 55 | 0.18 | 8.66 | 1.48 | * |
| 25844 | J091959.74+100631.7 | 0.0326 | 40 | 0.20 | 8.66 | 1.59 | * |
| 8347 | J093858.50+040940.5 | 0.0463 | 75 | 0.19 | 8.95 | 1.73 | … |
| 20305 | J095243.86+100001.0 | 0.0303 | 30 | 0.24 | 8.67 | 1.63 | … |
| 20371 | J095402.22+103629.6 | 0.0399 | 4 | 0.75 | 9.41 | 1.83 | * |
| 18755 | J100057.16+073743.2 | 0.0489 | 4 | 0.75 | 9.59 | 1.72 | … |
| 14863 | J100134.25+065555.3 | 0.0489 | 4 | 0.79 | 9.61 | 1.78 | … |
| 18875 | J102004.22+074622.1 | 0.0451 | 9 | 0.49 | 9.34 | 1.77 | * |
| 18872 | J102039.65+075133.9 | 0.0451 | 8 | 0.46 | 9.31 | 1.82 | * |
| 54233 | J102157.80+243918.7 | 0.0402 | 5 | 0.61 | 9.32 | 1.82 | * |
| 26336 | J102316.17+130528.7 | 0.0320 | 4 | 0.77 | 9.22 | 1.78 | * |
| 26319 | J102339.36+130227.4 | 0.0322 | 40 | 0.21 | 8.67 | 1.62 | … |
| 23069 | J102742.61+104927.6 | 0.0316 | 35 | 0.26 | 8.74 | 1.48 | … |
| 23039 | J102756.01+111444.6 | 0.0325 | 12 | 0.37 | 8.92 | 1.86 | … |
| 54763 | J103721.85+272131.4 | 0.0421 | 8 | 0.51 | 9.29 | 1.82 | * |
| 23228 | J103920.02+114128.1 | 0.0479 | 15 | 0.37 | 9.26 | 1.78 | * |
| 26640 | J104028.50+133721.9 | 0.0317 | 4 | 0.65 | 9.15 | 1.84 | … |
| 29594 | J104639.64+140647.4 | 0.0336 | 45 | 0.24 | 8.76 | 1.27 | … |
| 15242 | J105016.92+060721.3 | 0.0422 | 75 | 0.17 | 8.81 | 1.80 | … |
| 23437 | J105147.93+115901.7 | 0.0465 | 28 | 0.23 | 9.04 | 1.87 | * |
| 54986 | J105739.31+272937.1 | 0.0454 | 8 | 0.49 | 9.34 | 1.85 | * |
| 17684 | J110037.27+102613.9 | 0.0361 | 4 | 0.70 | 9.29 | 1.79 | … |
| 23518 | J110103.65+120827.7 | 0.0342 | 50 | 0.20 | 8.70 | 1.73 | … |
| 23563 | J110741.70+130132.4 | 0.0350 | 4 | 0.71 | 9.27 | 1.99 | * |
| 17840 | J111254.48+093050.3 | 0.0291 | 25 | 0.26 | 8.66 | 1.53 | * |
| 15612 | J111341.33+074545.9 | 0.0291 | 24 | 0.25 | 8.65 | 1.88 | … |
| 23539 | J111447.94+114735.0 | 0.0379 | 76 | 0.17 | 8.73 | 1.46 | … |
| 12597 | J114309.53+055557.8 | 0.0315 | 34 | 0.24 | 8.70 | 1.61 | … |
| 18202 | J121134.94+092106.8 | 0.0269 | 20 | 0.30 | 8.67 | 1.58 | … |
| 30192 | J121418.23+142345.8 | 0.0251 | 15 | 0.35 | 8.67 | 1.76 | … |
| 18482 | J123053.16+090456.9 | 0.0393 | 88 | 0.17 | 8.75 | 1.68 | * |
| 12970 | J123553.79+054539.8 | 0.0418 | 18 | 0.34 | 9.11 | 1.78 | * |
| 24366 | J123938.86+122507.9 | 0.0411 | 20 | 0.33 | 9.08 | 1.78 | * |
| 28462 | J124618.26+115224.8 | 0.0449 | 50 | 0.22 | 8.97 | 1.76 | * |
| 28461 | J124622.67+115235.7 | 0.0443 | 4 | 0.63 | 9.43 | 1.93 | * |
| 13091 | J125451.85+035305.4 | 0.0483 | 4 | 0.86 | 9.64 | 1.80 | * |
| 28551 | J125657.07+122148.6 | 0.0496 | 10 | 0.49 | 9.42 | 1.76 | * |
| 25236 | J131357.26+123533.2 | 0.0256 | 15 | 0.32 | 8.64 | 1.60 | … |
| 25202 | J131415.99+120348.5 | 0.0343 | 45 | 0.23 | 8.76 | 1.76 | … |
| 26911 | J131621.43+133006.6 | 0.0304 | 4 | 0.70 | 9.14 | 1.84 | … |
| 34531 | J132939.26+294612.3 | 0.0472 | 5 | 0.75 | 9.56 | 1.71 | … |
| 13551 | J134505.90+034815.3 | 0.0331 | 44 | 0.21 | 8.70 | 1.35 | … |
| 25475 | J134807.60+112405.1 | 0.0360 | 60 | 0.18 | 8.71 | 1.63 | … |
| 25572 | J140700.00+130019.1 | 0.0274 | 20 | 0.28 | 8.65 | 1.80 | * |
| 41444 | J141547.01+085436.6 | 0.0287 | 12 | 0.35 | 8.78 | 1.95 | * |
| 45439 | J141722.70+250310.1 | 0.0299 | 5 | 0.67 | 9.11 | 1.79 | … |
| 30847 | J141835.33+072118.8 | 0.0250 | 14 | 0.42 | 8.74 | 1.55 | * |
| 28875 | J143041.62+115913.3 | 0.0271 | 19 | 0.33 | 8.71 | 1.68 | … |
| 9601 | J143351.42+034046.1 | 0.0288 | 5 | 0.69 | 9.08 | 1.75 | * |
| 29225 | J144636.62+115108.7 | 0.0294 | 29 | 0.28 | 8.72 | 1.68 | … |
| 38728 | J145055.60+093946.5 | 0.0386 | 84 | 0.15 | 8.67 | 1.41 | * |
| 10012 | J145243.07+031329.3 | 0.0279 | 8 | 0.50 | 8.91 | 1.85 | * |
| 10058 | J145413.13+045029.5 | 0.0347 | 4 | 0.71 | 9.26 | 1.80 | * |
| 39120 | J150935.51+102525.9 | 0.0276 | 25 | 0.34 | 8.74 | 1.52 | * |
| 38974 | J151133.48+092824.2 | 0.0353 | 4 | 0.70 | 9.27 | 1.90 | … |
| 10297 | J151252.96+043050.4 | 0.0370 | 4 | 0.64 | 9.27 | 1.87 | * |
| 39211 | J151435.92+082002.1 | 0.0334 | 8 | 0.56 | 9.13 | 1.90 | * |
| 42011 | J151615.35+064747.5 | 0.0343 | 13 | 0.44 | 9.05 | 1.73 | * |
| 42174 | J151817.19+070757.0 | 0.0320 | 65 | 0.18 | 8.60 | 1.74 | * |
| 46564 | J151925.35+254713.6 | 0.0323 | 4 | 0.59 | 9.12 | 1.93 | * |
| 39600 | J152750.23+094002.2 | 0.0436 | 49 | 0.21 | 8.93 | 1.79 | * |
| 10827 | J220147.39+131228.5 | 0.0301 | 30 | 0.26 | 8.69 | 1.42 | … |
| 10813 | J220358.03+115421.2 | 0.0268 | 14 | 0.39 | 8.77 | 1.78 | … |
| 10836 | J220419.41+125806.2 | 0.0274 | 8 | 0.53 | 8.92 | 1.77 | … |
| 10863 | J220848.81+132152.9 | 0.0275 | 20 | 0.35 | 8.75 | 1.73 | * |
| 10890 | J221241.31+140434.4 | 0.0252 | 14 | 0.39 | 8.72 | 1.63 | … |
| 10896 | J221336.49+134020.7 | 0.0278 | 20 | 0.30 | 8.69 | 1.44 | … |
| 10942 | J221530.28+134023.4 | 0.0251 | 14 | 0.42 | 8.75 | 1.29 | … |
| 10943 | J221540.59+133616.9 | 0.0275 | 20 | 0.28 | 8.66 | 1.57 | … |
| 10944 | J221543.66+134252.3 | 0.0262 | 25 | 0.31 | 8.66 | 1.39 | … |
| 10950 | J221559.51+132715.3 | 0.0254 | 14 | 0.44 | 8.78 | 1.43 | … |
| 10949 | J221600.51+130851.8 | 0.0262 | 19 | 0.33 | 8.68 | 1.65 | … |
| 10948 | J221636.89+131514.4 | 0.0258 | 40 | 0.24 | 8.53 | 1.49 | … |
| 10953 | J221652.39+132533.5 | 0.0256 | 16 | 0.34 | 8.67 | 1.54 | … |
| 10952 | J221657.95+133235.0 | 0.0262 | 19 | 0.31 | 8.65 | 1.82 | * |
| 10879 | J221750.25+125941.7 | 0.0360 | 59 | 0.19 | 8.72 | 1.33 | * |
| 10979 | J221859.40+131114.8 | 0.0268 | 18 | 0.31 | 8.68 | 1.65 | * |
| 11041 | J224237.97+132844.5 | 0.0373 | 72 | 0.18 | 8.73 | 1.30 | … |
| 11087 | J225525.96+125539.3 | 0.0376 | 14 | 0.45 | 9.13 | 1.75 | * |
| 11132 | J230146.58+133218.8 | 0.0341 | 29 | 0.27 | 8.83 | 1.79 | … |
| 11267 | J231142.06+150638.2 | 0.0400 | 8 | 0.49 | 9.23 | 1.84 | * |
| 11280 | J231530.93+134040.6 | 0.0400 | 10 | 0.40 | 9.14 | 1.85 | … |
| 11397 | J232447.10+142301.6 | 0.0395 | 90 | 0.14 | 8.67 | 1.79 | * |
| 11366 | J232621.83+141230.1 | 0.0430 | 23 | 0.30 | 9.08 | 1.79 | * |
| 11357 | J232624.38+135742.9 | 0.0433 | 24 | 0.26 | 9.03 | 1.84 | * |
| 11582 | J232748.74+142831.1 | 0.0411 | 20 | 0.35 | 9.10 | 1.76 | * |
| 11770 | J234646.15+160235.0 | 0.0416 | 4 | 0.66 | 9.39 | 1.92 | … |
| 11754 | J234823.35+143004.8 | 0.0409 | 28 | 0.28 | 9.01 | 1.76 | … |
| 11783 | J235224.35+143535.1 | 0.0270 | 19 | 0.31 | 8.68 | 1.65 | … |
Appendix B Notes on individual objects
We list here notes for galaxies marked with an asterisk in
the last column of Tables LABEL:t_det and LABEL:t_ndet.
The galaxies are ordered by increasing GASS number. In what follows,
AA2 is the abbreviation for ALFALFA detection code 2.
Detections (Table LABEL:t_det)
3189 – small blue smudge 20 arcsec NW, perhaps responsible for asymmetric Hi profile? AA2.
3439 – AA2.
3465 – AA2.
3509 – RFI spikes at 1350 and 1352.2 MHz (15100 and 15500 km/s); small galaxy
2 arcmin S has , no contamination problems.
3519 – superposed on early type galaxy without : galaxy pair or superposition effect?
Disk galaxy 1 arcmin E has , no contamination problems.
Stronger in polarization A but OK (polarization B has noisy baseline).
3918 – low frequency edge uncertain, systematic error.
3977 – AA2.
3981 – stronger in polarization A.
4030 – there seems to be a hint of signal from another galaxy at 1358-59 MHz (13700 km/s,
no RFI there). Perhaps the small red galaxy 1.5 arcmin SW? There are two other galaxies,
even smaller or farther away.
4038 – high frequency edge uncertain, systematic error.
4039 – blue companion 1.7 arcmin E (, 1384.41 MHz); another blue galaxy
1.5 arcmin SW has , no contamination problems; AA2.
4048 – boards centered at wrong frequency by mistake.
4057 – 275 mJy continuum source 1.5 arcmin away, standing waves; high frequency edge uncertain,
systematic error; AA2.
4137 – low frequency edge uncertain, systematic error. Small galaxy 1 arcmin S has ,
no contamination problems.
4145 – notice small blue galaxy attached to GASS 4145, no redshift from SDSS, perhaps partly responsible
for asymmetric profile (which is also not well centered on SDSS redshift). Companion galaxy
3 arcmin SW, SDSS J015509.55+125746.1 (, 1375.33 MHz) not detected on the side
away from GASS 4145, thus unlikely to contribute to the Hi signal.
4223 – several galaxies within 3 arcmin and with SDSS redshift, all with
except SDSS J015717.50+144327.2 (disk galaxy 1.5 arcmin SE, , 1382.93 MHz)
and SDSS J015705.49+144256.0 (small galaxy 2.5 arcmin SW, , 1385.35 MHz).
In both cases, no Hi emission is detected in the half side that is moving away from
GASS 4223, thus significant contamination is unlikely. Uncertain profile; AA2.
4233 – confused: two blue companions with the same redshift (SDSS J015710.06+145500.9, 1 arcmin SE
and SDSS J015708.74+145247.4, 3 arcmin S).
5035 – high frequency edge uncertain, systematic error.
6749 – small blue companion 40 arcsec SW, SDSS J130748.37+031057.1, (1368.67 MHz),
some contamination certain (notice that higher peak on the low velocity side is
centered on the companion).
7520 – high frequency edge uncertain, systematic error. Stronger in polarization A. Small blue
companion 3 arcmin N (SDSS J143318.34+024205.0, , 1381.58 MHz).
9585 – two very small companions within 1.5 arcmin, one has the same (0.0336), the other has
(1379.30 MHz) and is not detected.
10831 – galaxy group: there are five galaxies within 3 arcmin E of GASS 10831,
three of which with redshift , one with redshift and the largest one without
redshift from SDSS. Very broad Hi profile is likely blend of emission of gas
from and/or between these galaxies. Uncertain profile.
10844 – most Hi likely coming from very blue companion 1 arcmin NE, same (0.0270);
other galaxy 1 arcmin SE has .
10850 – RFI spikes above 1374 MHz (10000 km/s).
10856 – blend with GASS 10831 (SDSS J220322.59+123857.6, ), 2 arcmin SW.
10889 – confused with UGC 11948? UGC 11948 is 3.5 arcmin W, no SDSS spectroscopy, but is in
the S05 archive ( km s-1, observed flux of 2.63 Jy km s-1, km s-1).
10985 – RFI at 1350 MHz (15600 km s-1).
11003 – blend with GASS 11004 (SDSS J223707.71+141355.0, , detected by ALFALFA and in
the S05 archive), 2.5 arcmin SW. Notice also blue companion 1 arcmin SW
without SDSS redshift.
11013 – high frequency edge uncertain, systematic error.
11015 – most of the signal likely comes from SDSS J223654.54+142452.0, a large, blue disk
2 arcmin W, (1370.39 MHz).
11019 – stronger in polarization B.
11055 – high frequency edge uncertain, systematic error; clear detection but uncertain Hi parameters.
11071 – low frequency edge uncertain, systematic error.
11120 – high frequency edge uncertain, systematic error; stronger in polarization B.
11126 – RFI at 1358.3 MHz (13700 km/s).
11231 – AA2.
11250 – AA2.
11268 – 5 other galaxies within 3 arcmin, most at slightly smaller redshift; the largest is GASS 11267,
1 arcmin SE (, 1365.75 MHz, i.e. 2.3 MHz higher than GASS 11268), not clearly
detected here (also targeted separately and listed as a non-detection). The bump in the baseline
next to the Hi profile, on the low velocity side, is most likely due to these companions, but
the Hi signal does not seem significantly affected.
11270 – low frequency edge uncertain, systematic error; much clearer in polarization B.
11285 – high frequency edge uncertain, systematic error.
11303 – low frequency edge uncertain, systematic error.
11314 – blend with GASS 11311 (SDSS J231229.22+135632.1, , ALFALFA detection), 1.5 arcmin E. Notice also GASS 11312 (SDSS J231225.99+135450.1, ), 2 arcmin S.
Low frequency edge uncertain, systematic error.
11383 – strong detection at 1375.5 MHz in boards 3 and 4, perhaps the blue galaxy
30 arcsec SW (SDSS J232547.39+140245.2, no redshift)? The negative peak in the
baseline at 1374 MHz (10100 km/s) is present in 4-minute pairs only, most likely
due to a galaxy in the off scan (there is small blue galaxy at that position without
SDSS redshift). AA2.
11462 – companion 2 arcmin E (SDSS J231803.74+135400.8, ) possibly responsible for
the enhanced peak at 12100 km s-1.
11513 – uncertain profile, marginal detection.
11514 – uncertain profile; marginal detection, stronger in polarization B. Small galaxy 20 arcsec SW,
no optical redshift.
11763 – blend with blue companion, SDSS J234155.60+151345.9 (), 30 arcsec SW.
11808 – low frequency edge uncertain, systematic error.
11815 – Blue companion 2 arcmin SE, SDSS J235313.68+160228.3 (, 1354.20 MHz);
notice also blue galaxy 1 arcmin SE, no SDSS redshift. Confused. RFI double
spike at 1351 MHz (outside galaxy profile), eight channels replaced by interpolation.
11824 – RFI spike at 1374.2 MHz (10000 km/s).
11834 – RFI at 1366-68 MHz (11600-11900 km s-1). Blue disk 1 arcmin S, no redshift,
contamination possible. AA2.
11845 – RFI spike at 1375 MHz (9800 km/s); blend, profile peaks uncertain.
Blue companion, SDSS J235645.33+135216.4, 2 arcmin S with
the same redshift, some contamination certain; notice that the companion is GASS 11774
(AGC 331022), detected in both ALFALFA and S05 archive (observed flux of 1.96 Jy km s-1,
km s-1, km s-1).
11917 – blend with blue companion, SDSS J000744.11+151013.3 (), 1 arcmin S.
12318 – very likely blended with SDSS J111440.82+040039.8 1 arcmin SW, (1364.89 MHz);
perhaps hint of Hi from another companion 1 arcmin SE, SDSS J111447.92+040058.6, with
(1367.89 MHz, 11600 km/s).
13158 – profile peaks uncertain. Three small galaxies within 1.5 arcmin: two with redshifts close
to that of GASS 13158 ( and 0.0401, which are displaced enough from the target that
should be visible if detected), and one without optical ; AA2.
15151 – AA2.
15166 – 1.4 Jy continuum source at 6.5 arcmin and 26 mJy at 1 arcmin, standing waves, poor baseline fit.
15211 – early-type companion 2 arcmin E, strong contamination unlikely.
18087 – Three galaxies within 4 arcmin and with SDSS redshifts are in the background.
18673 – two small blue galaxies within 1 arcmin, no SDSS redshift; two galaxies at 2.5 arcmin S
and SW have .
18681 – detected blue companion in board 4, 1395.3 MHz: UGC 5308, 2 arcmin N,
from NED (1395.47 MHz). Small disk galaxy 1 arcmin N, SDSS J095323.73+075113.7
(), unlikely to contaminate Hi signal.
18686 – UGC 5304, blue galaxy pair, 2 arcmin NE (one of the two galaxies, SDSS J095310.37+075224.8,
has , the other has no redshift in SDSS), some contamination certain.
18702 – the galaxy 1.5 arcmin W has . A few small galaxies without SDSS redshift within 1 arcmin,
one of which is likely responsible for the narrow spike within the Hi profile.
18707 – AA2.
18798 – high frequency edge uncertain, systematic error.
Marginal detection. Small galaxy 80 arcsec E, SDSS J101334.44+075423.7, (1358.82 MHz).
Notice asymmetric light distribution of GASS 18798 opposite to companion. Two other small galaxies
within 2 arcmin have . Clearer in polarization B.
18862 – blue companion 1.5 arcmin S, offset by 0.8 MHz in frequency (SDSS J102241.78+081833.0,
, 1358.98 MHz), does not appear to contaminate the Hi signal significantly;
also notice companion 3 arcmin N (SDSS J102236.67+082237.8, , 1360.18 MHz).
20292 – AA2.
20448 – detected also blue companion, 2 arcmin NW (SDSS J095808.05+110832.2, ).
23026 – two companions (SDSS J102726.74+110543.9, 1.5 arcmin NE,
and SDSS J102714.26+110340.0, 2 arcmin SW, ), some contamination possible.
Detected another companion centered at 8700 km s-1 and without SDSS redshift,
perhaps SDSS J102715.87+110518.0 (small and blue, strong UV emission, 1.5 arcmin NW)?
23757 – profile edges uncertain, systematic error.
24437 – blend with blue companion, SDSS J123946.66+133159.8 (), 1 arcmin SW.
High frequency edge uncertain, systematic error.
25296 – profile peaks uncertain.
26639 – high frequency edge uncertain, systematic error. Signal present in both polarizations, but with
different shape. Blue companion 2.5 arcmin NE, SDSS J104055.84+134823.1
(, 1376.01 MHz), does not appear to be detected.
27167 – profile peaks uncertain. Galaxy 1 arcmin SE has , no contamination
problems.
28482 – blend: blue companion 2.5 arcmin E, SDSS J124317.30+111241.5
(, 1382.19 MHz), and small blue satellite connected to GASS 28482 certainly
contributing to the Hi signal.
29555 – small blobs around without SDSS redshift.
29892 – blend with SDSS J112941.76+151851.3, very blue companion 1.5 arcmin SW (,
1368.58 MHz). Notice two other galaxies at 3.5 arcmin with very similar redshift. AA2.
30854 – small, almost face-on blue companion 2.5 arcmin SW (, 1386.35 MHz) not detected.
38538 – RFI spike at 1372 MHz (10500 km s-1).
38706 – galaxy pair (UGC 9561/Arp 173), both galaxies are blue and morphologically disturbed; blend;
profile edges uncertain.
38732 – high frequency edge uncertain, systematic error. Marginal detection.
Companion galaxy 1.5 arcmin SSW, SDSS J145030.45+093626.5 (, 1352.52 MHz), has a
warped disk. Some contamination almost certain. Notice another two, smaller galaxies 3 arcmin
from GASS 38732 with approximately the same redshift.
38923 – detected companion? The feature at 1358 MHz (13800 km s-1) is real, and could be part
of the Hi profile of the blue galaxy 4 arcmin SE (SDSS J145806.23+105716.3,
, 1358.65 MHz); there is also a small blue galaxy 2 arcmin SW,
(SDSS J145751.90+105917.8, without redshift.
40260 – RFI spike at 1372 MHz (10500 km s-1). Likely blend with SDSS J135836.27+132858.6, a
large disk galaxy 2.5 arcmin E, (1365.84 MHz; but SDSS fiber is not centered
on the galaxy). Stronger in polarization A.
40425 – AA2.
41303 – confused/blend with blue companion, SDSS J140749.05+094919.2 (, 1369.22 MHz),
a distorted spiral 2 arcmin E.
41783 – uncertain profile, systematic error; AA2.
41793 – marginal detection but well centered on SDSS redshift. Possible contamination from small companion
2 arcmin N (SDSS J145843.76+080057.6, , 1368.57 MHz); also small galaxy
25 arcsec N, SDSS J145840.87+075926.9, might be merging with GASS 41793.
42287 – Small companion 1.5 arcmin SE (SDSS J154251.89+245826.3, ), marginal
contamination possible; blue galaxy 1.5 arcmin NW has .
44846 – companion 2 arcmin N () is an elliptical galaxy, contamination unlikely; blue
disk 2.5 arcmin NE (, 1380.40 MHz) not detected. AA2.
46068 – tiny companion 2 arcmin N, SDSS J143709.19+251658.5, .
51190 – high frequency edge uncertain, systematic error. Small blue galaxy 1 arcmin E, no
SDSS redshift, perhaps responsible for this very asymmetric Hi profile? Three galaxies
2 arcmin W of GASS 51190 all have .
56304 – AA2.
56632 – uncertain profile; companion galaxy 3 arcmin E, SDSS J090450.16+133342.8 (,
1381.25 MHz), might contribute some signal.
57099 – RFI spike at 1352.2 MHz (15100 km s-1). Disturbed optical appearance, likely merging;
blue companion 2.5 arcmin W, SDSS J104210.89+152136.1 (, 1354.28 MHz),
unlikely to contaminate signal significantly.
Non-detections (Table LABEL:t_ndet)
3508 – detected companion, SDSS J011907.98+143555.6, 2 arcmin E (, 1368.74 MHz).
3757 – RFI spikes above 1373.5 MHz (below 10300 km s-1).
3859 – 20 arcsec from a spiral galaxy, no redshift in SDSS. Perhaps hint of signal centered
at 1380.2 MHz.
3880 – early type galaxy 1 arcmin E, similar redshift ().
4040 – detected companion (group?), 7900 km s-1. There are a few small galaxies within
2 arcmin without SDSS redshift. Notice that NED lists a galaxy group (USGC U109) 2.7 arcmin away,
whose redshift is compatible with the detection (, 1384.34 MHz).
4119 – the feature at 13000 km s-1 is well centered on the blue companion 2 arcmin S
(SDSS J014632.27+135530.2, , 1361.21 MHz), but the galaxy is clearly detected
only in polarization A.
9601 – group: two companions with (1375.03 MHz; 20 arcsec N, blue disk) and
(1378.10 MHz; 1 arcmin SW) also not detected. Blue spiral 2 arcmin SE has .
10012 – marginal detection? Signal most likely dominated by edge-on disk 2.5 arcmin E,
(1381.45 MHz; GASS 10012 has ).
10058 – galaxy pair.
10297 – negative feature at 1365 MHz (12100 km s-1) is not RFI and is present in both polarizations.
10863 – marginal detection? Notice also blue companion 3 arcmin NE, SDSS J220857.85+132404.0
(, 1382.76 MHz) that might contribute to marginal signal.
10879 – RFI spike at 1375 MHz (far from galaxy), four channels replaced by interpolation.
10952 – near bright star.
10979 – detected blue companion, SDSS J221900.09+131019.1, 1 arcmin S (, 1381.82 MHz).
11087 – RFI spikes above 1374 MHz (below 10100 km s-1).
11267 – companion of GASS 11268 (see detections), marginally detected here (between 12300 and 12700 km/s);
four additional companions within 3 arcmin, one of which is connected to 11267 by a stellar bridge.
The peak at 12150 km s-1 might be due to SDSS J231137.64+150443.8, a galaxy 2 arcmin SW
with (1364.77 MHz).
11357 – detected blue, irregular companion 1 arcmin NW, SDSS J232620.87+135857.0
(, 1360.58 MHz).
11366 – detected blue companion 1 arcmin SW, SDSS J232618.72+141150.5
(, 1363.48 MHz).
11397 – near bright star; detected blue companion 2.5’ SE, SDSS J232453.13+142059.5
(, 1364.61 MHz).
11582 – detected companion in board 4, 1377.5 MHz: perhaps SDSS J232751.00+142820.8, very
blue gal. 40 arcsec E without redshift?
12002 – RFI spike at 1375 MHz (9900 km s-1).
12005 – blue companion 2 arcmin SW (SDSS J002416.73+144505.9, , 1377.78 MHz)
also not detected.
12970 – galaxy group; GASS 12967 is 2 arcmin N, same redshift; marginally detected companion
1 arcmin SE, (1364.20 MHz)?
13091 – blue galaxy 80 arcsec W has , well away from GASS 13091.
17840 – detected blue companion in board 4, 1391.5 MHz: SDSS J111250.15+093139.1, 1 arcmin W,
(1391.36 MHz).
18482 – detected blue companion, SDSS J123056.18+090548.9 (, 1367.15 MHz), 1 arcmin NE.
18872 – red companion (SDSS J102034.04+075106.5, 1.5 arcmin W, ) also not detected.
18875 – three small companions within 2-4 arcmin also not detected.
20371 – detected blue companion 1.5 arcmin E (SDSS J095407.95+103625.6, ).
23228 – companion 1.5 arcmin SE, same redshift.
23437 – detected blue, irregular companion 2 arcmin SW, SDSS J105144.24+115735.4
(, 1357.88 MHz), but stronger in polarization B.
23563 – small companion 2.5 arcmin S.
24366 – hint of detection? It would be a 3.1 sigma detection, dubious.
Companion galaxy 1.5 arcmin NW (GASS 24364, SDSS J123936.04+122619.9, ) has a
very disturbed morphology. Notice another galaxy 4 arcmin NE
with similar redshift (SDSS J123951.16+122646.8, ).
25572 – detected blue, asymmetric companion 80 arcsec E, SDSS J140705.05+130013.3
(, 1382.05 MHz). The small peak at 8000 km s-1 is present in polarization A only.
25844 – marginally detected companion, SDSS J091951.55+100812.9 2.5 arcmin NW
(, 1374.32 MHz).
26336 – RFI spike at 1372 MHz (10500 km s-1). Two companions within 3 arcmin.
28461 – galaxy pair: the companion is GASS 28462, 1 arcmin W, also not detected.
28462 – galaxy pair: the companion is GASS 28461, 1 arcmin E, also not detected.
28551 – RFI spike at 1352.2 MHz (15100 km s-1). Small companion 1 arcmin SW, same redshift.
30847 – hint of detection? It would be a 3.8 sigma detection, dubious. Large galaxy 1.5 arcmin NE
(SDSS J141838.81+072238.4, , 1384.86 MHz) not detected.
38728 – detected companion without SDSS redshift? Optical counterpart not obvious, perhaps
SDSS J145052.31+094028.0 (1 arcmin NW)?
39120 – hint of detection?
39211 – hint of detection?
39600 – GASS 39567, detected in DR1, is 2.5 arcmin S, different redshift (); blue galaxy
2 arcmin NW is in the foreground ().
41444 – marginally detected companion, a spiral galaxy 2 arcmin SW, SDSS J141541.05+085318.4
(, 1379.81 MHz), but signal is visible in polarization B only; notice also two
early-type galaxies within 2 arcmin, no redshifts.
42011 – detected companion, perhaps SDSS J151618.38+064812.9 (1 arcmin NE) or SDSS J151609.56+064741.7
(small and blue, 1.5 arcmin W), both without SDSS redshifts. Two other galaxies within 3 arcmin
have redshifts that do not match the Hi detection (SDSS J151610.69+064640.8,
and SDSS J151618.58+064517.6, ).
42174 – edge-on disk 2.5 arcmin NE (, 1374.30 MHz) also not detected.
46564 – it looks like a marginal detection, but the signal is in polarization A only, and is not well
centered on the SDSS redshift; also galaxy has a low inclination, not consistent with wide profile.
54233 – companion 2 arcmin N.
54763 – small galaxy 2 arcmin SE (, 1358.16 MHz) also not detected; small galaxies without
SDSS redshift nearby.
54986 – companion (SDSS J105734.98+273020.4, , 1358.01 MHz) 1 arcmin NW also not detected.
56319 – near bright star.