Orbital and physical parameters of eclipsing binaries from the ASAS catalogue — IV. A 0.61 + 0.45 M⊙ binary in a multiple system.
Abstract
We present the orbital and physical parameters of a newly discovered low-mass detached eclipsing binary from the All-Sky Automated Survey (ASAS) database: ASAS J011328-3821.1 A – a member of a visual binary system with the secondary component separated by about 1.4 seconds of arc. The radial velocities were calculated from the high-resolution spectra obtained with the 1.9-m Radcliffe/GIRAFFE, 3.9-m AAT/UCLES and 3.0-m Shane/HamSpec telescopes/spectrographs on the basis of the todcor technique and positions of emission lines. For the analysis we used and band photometry obtained with the 1.0-m Elizabeth and robotic 0.41-m PROMPT telescopes, supplemented with the publicly available ASAS light curve of the system.
We found that ASAS J011328-3821.1 A is composed of two late-type dwarfs having masses of M⊙, M⊙ and radii of R⊙, R⊙, both show a substantial level of activity, which manifests in strong and emission and the presence of cool spots. The influence of the third light on the eclipsing pair properties was also evaluated and the photometric properties of the component B were derived. Comparison with several popular stellar evolution models shows that the system is on its main sequence evolution stage and probably is more metal rich than the Sun. We also found several clues which suggest that the component B itself is a binary composed of two nearly identical M⊙ stars.
keywords:
binaries: eclipsing – binaries: spectroscopic – binaries: visual – stars: fundamental parameters – stars: individual (ASAS J010538-3821.1) – stars: low-mass1 Introduction
In the last decade there has been a stunning increase in our knowledge of the structure and evolution of eclipsing binaries. The number of known and well studied detached low-mass eclipsing systems, which are the main source of absolute parameter measurements, increased by almost an order of magnitude after the year 2000. This increase helped several authors make conclusions about a 30-year old problem: the discrepancy between observed and theoretically predicted radii and temperatures during the evolution of low-mass stars (Lacy, 1977). The prevailing idea is that this discrepancy is caused by the stellar magnetic field, amplified by the fast rotation due to tidal locking in close binaries, which inhibits the efficiency of convection in the envelope and manifests itself in a higher level of activity than for single stars (Chabrier et al., 2007). However, the number of known well-characterized systems is too low to reliably test this hypothesis. This is especially true amoung the long-period systems, which normally exhibit lower levels of activity, so the observed radii and temperatures are closer to the theoretically predicted values. In a very recent paper, Irwin et al. (2011) described an eclipsing pair of M dwarfs on a 41 d orbit which, despite slow asynchronous rotation and a probable age over 120 Myr, still show cold spots, and radii are inflated by 5% with respect to theoretical predictions. This system is evidence against the theory mentioned above and may again bring wider interest to the need to revisit the equation of state for low mass stars, which was suggested to explain the inflated radii before the activity hypothesis (e.g. Torres & Ribas, 2002).
To be useful for testing the evolutionary models, the parameters of the system, especially masses and radii, should be known with a precision of at least 3%, considered now as a canonical level (Blake et al., 2008; Clausen et al., 2008). There are two other criteria which can make a system more interesting: (1) additional multiplicity – by deriving properties of the third body one can put additional constraints on the nature of the whole system; (2) low mass ratio – in general it is harder to fit a single isochrone to data points that are well separated in parameter space; these are usually stars of different masses. Twin stars commonly have data points that lie close together and are less difficult to fit. In this paper we present our analysis together with orbital and physical parameters of a newly discovered low-mass detached eclipsing binary which meets the two mentioned criteria. The data we gathered fell short of the 3% precision level goal, but the system is still highly valuable for our understanding of the nature of low-mass stars.
2 The ASAS J011328-3821.1 system
The eclipsing system ASAS J011328-3821.1 (2MASS J01132817-3821024, 1RXS J011328.8-382059; hereafter ASAS-01) has the shortest orbital period from all objects in our sample of low-mass detached eclipsing binaries (LMDEBs; see: Hełminiak & Konacki, 2011; Hełminiak et al., 2011) found in the ASAS Catalogue of Variable Stars (ACVS; Pojmański, 2002)111http://www.astrouw.edu.pl/asas/?page=acvs, and one of the shortest among the LMDEBs known to date – d. In the ACVS the ASAS-01 is classified as eclipsing detached (ED) with a maximum brightness of mag and amplitude of brightness variation of 0.33 mag. The ASAS light curve clearly shows that there is a significant difference in the eclipse depths which implies that the eclipsing pair is composed of two vastly different stars.
Before the ACVS the object was not reported to be a binary or multiple but was noted as an X-ray source in the Einstein (Gioia et al., 1990; Stocke et al., 1991) and ROSAT (Voges et al., 1999) catalogues. Later Beers et al. (1996) noted emission in calcium H and K lines, which they described in their catalogue as “moderate to strong”. More recently Riaz et al. (2006) identified ASAS-01 as an M0.5 dwarf, gave values of spectral indexes CaH1, CaH2, CaH3 and TiO5, reported emission line with equivalent width of 2.5 Å, and estimated the distance to be about 37 pc. This determination is significantly different from the value of 26.6 pc obtained by Szczygieł et al. (2008), who derived it on the basis of a bolometric correction derived from the ASAS colour, but the object was treated as a single star, explaining the discrepancy.
The emission in was recently confirmed by Parihar et al. (2009) who estimated the spectral types of components to be M1V + M3V. Their study, however, did not reflect the possibility of the system being composed of 3 or more stars.
Finally, in their lucky-imaging survey of southern M dwarfs, Bergfors et al. (2010) obtained high-angular-resolution images of the system in and bands. They clearly separated two components, with the secondary located 1.405(3) seconds of arc at the position angle of 29.0(3) degrees. They estimated the spectral types to be M0 + M1, not taking into account the eclipsing nature of one of the stars.
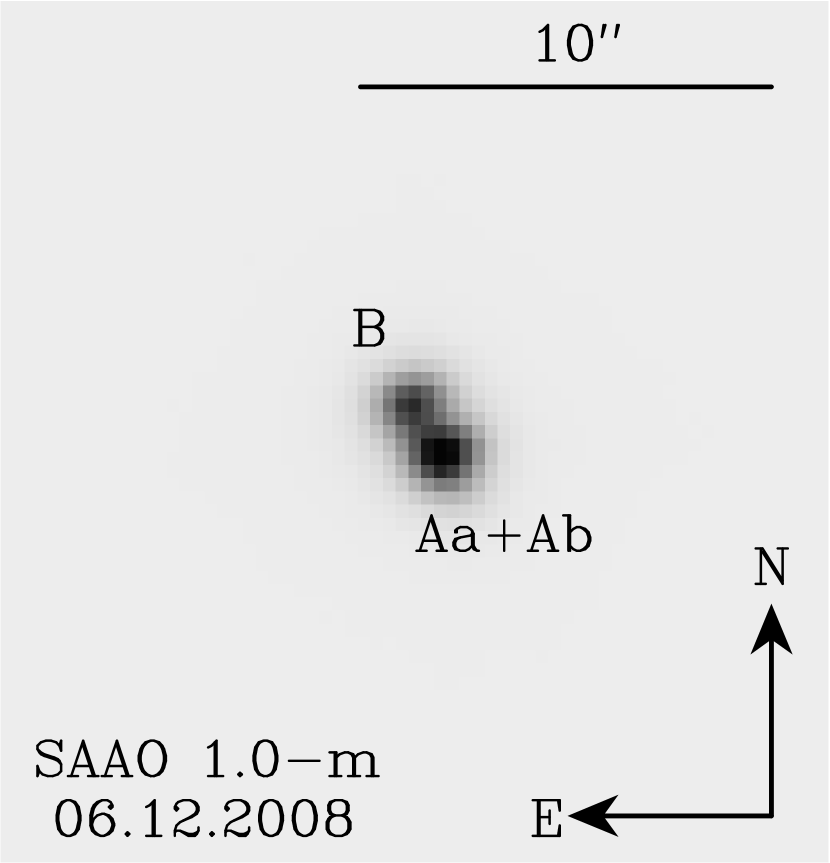
We deduced the multiple nature of ASAS-01 in two ways. Firstly we noted that in the spectrum taken with the Shane telescope in 2007 (Sect. 3) the emission line profile was found to be triple. The same feature was found in a spectrum obtained in 2008 with the Anglo-Australian Telescope but not in data obtained in 2006 with the Radcliffe telescope in South Africa. Shortly thereafter and independent of Bergfors et al. (2010) we found the two components clearly separated on the CCD images obtained with the Elizabeth telescope in South Africa (Sect. 4) in good seeing conditions. A part of our image is shown in Fig. 1. The fainter B component is located about 1.25 arcseconds from the brighter A in the NE direction, which is consistent with the more precise result obtained by Bergfors et al. (2010). A series of images taken in different orbital phases (with respect to the photometric 0.44559 d period) allowed us to deduce that eclipses occur in the component A.
3 Spectroscopy and radial velocities
3.1 Observations
To directly derive masses of ASAS-01 components we obtained a series of high-resolution spectra in order to measure their radial velocities (RV). Most of the spectroscopic observations come from the 1.9-m Radcliffe telescope and its Grating Instrument for Radiation Analysis with a Fiber-Fed Echelle (GIRAFFE) spectrograph at the South African Astronomical Observatory (SAAO), with settings the same as described in previous papers of this series (Hełminiak et al., 2009, 2011). Five spectra of , were obtained during three consecutive nights in September 2006. After 3600 s of exposure and binning to we obtained at Å between 25 and 40. At that time we were not aware that the system is also a visual binary, and the quality of the image from the aquisition camera was not enough to demonstrate that. Due to a relatively high seeing (about 2 asec and more) our spectra were contaminated by the companion B.
One additional spectrum was obtained in October 2007 with the 3.0-m Shane telescope and its Hamilton Spectrograph (HamSpec) at the Lick Observatory. The target was observed very low over the horizon for 2100 seconds. After binning from the original resolution of 60000 to 30000 we reached the level around 25 at Å. Due to the low , fringing, telluric lines and limited extent of available templates we did not use all 96 rows of the spectrum, but only used 21 that covered the wavelength range from 5150 to 6500 Å. This spectrum was also contaminated by the light from the component B.
The last spectrum was obtained in September 2008 with the 3.9-m Anglo-Australian Telescope and its University College London Echelle Spectrograph (UCLES) at the Siding Spring Observatory, with the same settings as described in Hełminiak et al. (2009, 2011). This spectrum was not binned and after 900 s of exposure we reached at Å. We tried to keep the slit on component A only, by rotating it by deg from the position angle of the AB pair, but due to the high seeing (over 2 asec) we could not avoid a significant contamination from star B.
3.2 Radial velocities derivation.
The CCD reduction, spectrum extraction and wavelength calibration were done in every case with standard iraf procedures222iraf is written and supported by the iraf programming group at the National Optical Astronomy Observatories (NOAO) in Tucson, AZ. NOAO is operated by the Association of Universities for Research in Astronomy (AURA), Inc. under cooperative agreement with the National Science Foundation. http://iraf.noao.edu/. For the wavelength calibration we used exposures of ThAr lamps taken before and after the science exposure. Initially the RV’s were measured with our implementation of the two dimensional cross-correlation technique (todcor; Zucker & Mazeh, 1994) using a spectrum of an M2V standard star HIP 93101 broadened to km s-1 that was taken as a template. The formal RV measurement errors were computed from the bootstrap analysis of todcor maps created by adding randomly selected single-order todcor maps.
In the todcor maps, the location of the maximum of the cross-correlation function in the plane refers to radial velocities of the two components of the system. We could easily phase-fold our measurements of the primary with the photometric period of 0.44559 d, but we failed when trying to do this for (putative secondary). Thus to obtain the RV curve of the eclipsing secondary we decided to measure positions of the emission lines. In all GIRAFFE spectra we could easily recognize two well-separated components of that line and measure their positions despite that the line was close to the edge of an échelle order. To measure the positions we used the deblend procedure in the iraf/echelle package and fitted a double-gaussian function. The fit was performed about 20 times with different initial wavelength range selections, initial peak positions and smoothing factors. Results were then averaged and the standard deviation was taken as the measurement error. A similar procedure was applied to the HamSpec and UCLES spectra but with a triple-gaussian function, since the triple character of the line was obvious. We did not normalize the spectra to the continuum before this procedure.
To check whether the RV’s obtained from lines can be trustful we tried to phase-fold them separately with the photometric period. For the primary we found a good agreement with the todcor measurements, and for the secondary we succeeded to find a fit with the desired period, systemic velocity close to the one found for the primary, and amplitude significantly higher than the primary’s . This is expected for two distinctive late-type dwarfs, considering the difference in the depths of the eclipses in the ASAS light curve. For the final orbital fit we used all measurements simultaneously. We used the spectroscopic orbit fitting procedure described in our previous papers (Hełminiak et al., 2009; Hełminiak & Konacki, 2011; Hełminiak et al., 2011). This simple code uses a Levenberg-Marquardt minimalization algorithm to find a keplerian orbit of a spectroscopic binary. It also allows for estimation of systematic contributions to the error budget by Monte-Carlo and bootstrap analysis.
| JD | T/S | |||
| (km s-1) | (km s-1) | (km s-1) | ||
| Component Aa velocities from todcor | ||||
| 4006.50332 | -86.882 | 4.360 | 3.502 | R/G |
| 4007.52761 | 98.787 | 7.240 | 3.361 | R/G |
| 4007.57128 | 140.808 | 7.037 | 7.444 | R/G |
| 4008.47697 | 140.128 | 4.695 | 3.230 | R/G |
| 4008.52042 | 112.337 | 4.540 | -6.065 | R/G |
| 4375.87729 | -100.752 | 8.175 | -1.146 | S/H |
| 4727.14578 | 68.250 | 1.247 | 0.076 | A/U |
| Component Aa velocities from lines | ||||
| 4006.50332 | -90.330 | 6.971 | 0.054 | R/G |
| 4007.52761 | 96.905 | 7.435 | 1.479 | R/G |
| 4007.57128 | 132.301 | 6.895 | -1.063 | R/G |
| 4008.47697 | 122.606 | 7.232 | — | R/G |
| 4008.52042 | 107.616 | 6.577 | -10.786 | R/G |
| 4375.87729 | -110.900 | 6.563 | -11.295 | S/H |
| 4727.14578 | 94.415 | 6.540 | — | A/U |
| Component Ab velocities from lines | ||||
| 4006.50332 | 161.590 | 7.509 | -7.093 | R/G |
| 4007.52761 | -85.570 | 7.401 | 1.556 | R/G |
| 4007.57128 | -144.540 | 7.134 | -5.276 | R/G |
| 4008.47271 | -136.700 | 7.866 | 6.691 | R/G |
| 4008.52042 | -113.824 | 7.176 | 4.881 | R/G |
| 4375.87729 | 191.210 | 6.655 | 9.812 | S/H |
| 4727.14578 | -68.139 | 6.525 | — | A/U |
| Component B velocities from todcor | ||||
| 4006.50332 | 116.254 | 6.240 | 3.502 | R/G |
| 4007.52761 | 28.122 | 1.500 | 3.361 | R/G |
| 4007.57128 | -21.130 | 6.076 | 7.444 | R/G |
| 4008.47697 | 19.200 | 3.690 | 3.230 | R/G |
| 4008.52042 | -24.688 | 9.086 | -6.065 | R/G |
| 4375.87729 | -12.785 | 5.925 | -1.147 | S/H |
| 4727.14578 | 21.381 | 0.482 | 0.076 | A/U |
| Component B velocities from lines | ||||
| 4375.87729 | 13.147 | 6.587 | — | S/H |
| 4727.14578 | 6.799 | 6.633 | — | A/U |
3.3 ASAS-01 A orbital fit

Before obtaining the orbital fit we used our photometric measurements (Sect. 4) to correct the ASAS ephemeris. Using the jktebop and phoebe codes (see Sect. 5) we found a new value of the orbital period d and incorporated it to the orbital fit. We have also found (from the photometry and radial velocities) that the eccentricity agrees with zero well within formal errors, so we held it fixed later. We found the same for the difference between systemic velocities of the primary and secondary , and for any possible systematic shifts between measurements from todcor and lines. However, the reduced of the best-fitting solutions made separately for measurements of either the primary or the secondary were not close to 1. This means that the measurement errors were underestimated, so we added in quadrature a systematic term of 6.5 km s-1 to the formally derived measurement errors. This operation was not necessary for the todcor results. We also excluded one measurement of the primary from the GIRAFFE spectrum at JD2454008.477 and both from the UCLES spectrum, due to their very large formal uncertainties. The measurements from the UCLES spectrum probably also suffered from the line blending. For this exposure the velocity difference was the smallest in the whole sample and the emission from the B component is strongest. However, we believe that the todcor measurement is secure because the peak was very high and well separated from other smaller maxima.
All the RV mesurements for all components of the ASAS-01 multiple system are listed in Table 1. For ASAS-01 A we show only the measurements which were taken to produce the orbital fit and the final model of the system, together with their final errors and residuals. For the component B we show all the todcor values and two velocities derived from HamSpec and UCLES spectra. In the “T/S” column “R/G” denotes Radcliffe/GIRAFFE, “S/H” denotes Shane/HamSpec and “A/U” denotes AAT/UCLES telecope/spectrograph.
| Parameter | Value | |
|---|---|---|
| [d] | 0.44559604 | 1.8e-7 |
| [JD-2450000] | 1868.83933 | 3.1e-4 |
| [km s-1] | 118.4 | 2.0 |
| [km s-1] | 162.9 | 3.3 |
| [km s-1] | 18.6 | 2.3 |
| 0.727 | 0.018 | |
| [R | 2.478 | 0.034 |
| 0.0 | (fix) | |
| [M | 0.595 | 0.027 |
| [M | 0.432 | 0.017 |
In the left panel of Fig. 2 we present all the measurements together with the best fitting orbital solution obtained for the ASAS-01 A eclipsing pair. We found the solution with a fast procedure which fits a double-keplerian orbit by minimizing the function with a Levenberg-Marquard method. The of the fit was 5.8 km s-1 for the primary and 7.0 km s-1 for the secondary. The final reduced was 0.988, thus we believe that the parameter uncertainties are well estimated. To ensure the accuracy of the estimates we also performed an additional Monte-Carlo simulation to estimate the systematic errors of derived parameters. The resulting systematic terms were an order of magnitude smaller than the formal ones, but were added in quadrature to the errors from the least-squares fit.
The orbital parameters derived from the fit are listed in Table 2. One can see that and todcor measurements are complementary and, when combined, allow us to reach about 2% level of precision in the velocity amplitudes and about 4% in . We would like to emphasize the low value of the mass ratio , which makes ASAS-01 A quite unique. With this ASAS-01 A resides in the mass-ratio distribution of spectroscopic binaries well outside both the narrow peak at (the “strong” twin hypothesis; Lucy, 2006) and the wide one at (the “weak” twin hypothesis; Halbwachs et al., 2003). This makes ASAS-01 A particularly interesting for testing the evolutionary models.
3.4 The component B
The positions of the third emission peak in the HamSpec and UCLES spectra were close to (however not in good agreement with) the corresponding measurements of from todcor . This led to a conclusion that the coordinate of the todcor maxima may be related to the B component, not the secondary component of the eclipsing Aa+Ab pair. If so, the B component itself must be a spectroscopic binary, since the values change significantly by about 150 km s-1. The third emission peak is however not clearly visible in the GIRAFFE spectra so we can’t fully support that hypothesis by comparing all todcor and measurements. Nevertheless it is worth noticing that during two consecutive nights when two R/G observations were taken with roughly one hour time span (JD2454007.5 and 2454008.5) the position of the peak on the todcor map changed by about 45 km s-1. The remaining R/G spectrum (JD2454006.5) – from which the highest value of was derived (116 km s-1) – had the highest signal to noise ratio.
| Parameter | Value | |
|---|---|---|
| [d] | 0.4750 | 0.0009 |
| [JD-2450000] | 4806.950a | 0.022 |
| [km s-1] | 104.7 | 5.7 |
| [km s-1] | 13.6 | 2.9 |
| 0.0 | (fix) | |
| [R | 0.983 | 0.053 |
| [M | 0.0565 | 0.0092 |
From the todcor measurements of the B component’s RVs we derived an acceptable orbital solution with the of measurements of 7.1 km s-1 and reduced of the fit nearly 3. The parameters of this solution are listed in Table 3 and the model RV curve, together with the single measurements and residua (listed in Table 1), are plotted on the right panel of the Fig. 2. In this orbital fit we did not include the measurements derived from the lines, because the resulting parameters were not very different from the ones given, and the quality of the fit (in terms of and ) was substantially worse. One can see that the systemic velocity differs from the value by less than the sum of their errorbars, which is expected in case of gravitational bounding. This is an argument for the correctness of this fit and thus the binary nature of ASAS-01 B, but considering the amount and quality of the available data, we are far from making any conclusive statements about this hypothesis. The binarity of ASAS-01 B will be discussed in a later part of the paper.
3.5 line profiles
The existence of strong emission is a manifestation of a substantial stellar activity in all components of the ASAS-01 system. The closer inspection of the lines reveals their probable variability. In Fig. 3 we present profiles from all of our spectra. On the spectra from HamSpec and UCLES all three components are clearly visible and marked. One has to remember that for the GIRAFFE setting the line was close to the edge of the echelle order, so the around the line was lower. For every spectrum we measured the equivalent width and collected them in Table 4.
| JD | T/S | |||
|---|---|---|---|---|
| -2450000 | [Å] | [Å] | [Å] | |
| 4006.50332 | 0.74 | 0.54 | 0.18 | R/G |
| 4007.52761 | 1.38 | 0.71 | 0.15 | R/G |
| 4007.57128 | 1.39 | 0.40 | 0.13 | R/G |
| 4008.47697 | 1.69 | 0.65 | 0.10 | R/G |
| 4008.52042 | 2.04 | 0.58 | R/G | |
| 4375.87729 | 1.60 | 0.67 | 0.60 | S/H |
| 4727.14578 | 0.60 | 0.25 | 0.87 | A/U |
The Aa component seems to be particularly strong on both GIRAFFE spectra from Sept. 30 (JD2454008.5). This may be due eithe to the real increase of the line intensity or to blending with the B component. However, in the latter case the velocity of B calculated from the line position would differ by 50-70 km s-1 from the maximum on the coresponding todcor map. In the case of GIRAFFE data the intensity and even the existence of the third peak is highly dependent on how the spectrum was normalized to the continuum. The low of the GIRAFFE spectra and the high rotational broadening of the stellar lines make this operation quite challenging and its results unreliable, especially at the orders’ edges (i.e. around the line).
The measurements, given in the Table 4, were made under assumption of three emission components for all spectra, but we stress that for R/G observation this assumption may be wrong due to low SNR. This data set however shows a systematic decrease of the measurements for the B component (by a factor of ), and a rising trend for the Aa (by a factor of nearly 3). The values seem to be randomly oscillating around a constant value. Nevertheless these measurements are unsecure and should be treated with caution.
In the HamSpec and UCLES observations the B component is obviously stronger than in those performed with GIRAFFE. The Aa component shows values substantially different between the two spectra. The for the HamSpec spectrum is within the oscillations seen in the GIRAFFE data, but in the UCLES spectrum it reaches the smallest value of all data sets. This may however be due to the blending with the component B. Given the activity of the system, we expect the observed variability of to be real, however the quality of the data does not allow for a firm statement.

We also want to note that in three of five GIRAFFE spectra, as well as in HamSpec and UCLES observations, we have found signatures of emission lines. Especially in the UCLES spectrum the emission from all three components is clear and the measurements were possible. The shape of the profile is very similar to the line. We found ’s to be 0.70, 0.17 and 0.62 Å for the Aa, Ab and B components respectively, with the uncertainty of 0.1 Å. The line from the UCLES spectrum is also shown in Fig. 3.
4 Photometric observations
The photometric observations of ASAS-01 were carried out in and bands with the 1.0-m Elizabeth telescope, located in SAAO, and the 0.41-m Prompt-4 and Prompt-5 robotic telescopes333Panchromatic Robotic Optical Monitoring and Polarimetry Telescopes. PROMPT is operated by SKYNET – a distributed network of robotic telescopes located around the world, dedicated for continues GRB afterglows observations. http://skynet.unc.edu, located in the Cerro Tololo Inter-American Observatory in Chile. A more detailed description of the observational settings, reduction procedure and calibration to standard photometric system can be found in Hełminiak & Konacki (2011) and Hełminiak et al. (2011).
The majority of the SAAO observations were done in December 2008. Most of the orbital phases were covered, however without the primary minimum in and with only few points in . A clear out-of-eclipse modulation, probably originated by a presence of a cold spot, was noticed.
The PROMPT observations were carried out mostly in July 2009, with two additional nights at the ends of August and September the same year. This time several primary minima were covered, however more points were collected around the secondary minimum. Again we noticed an out-of-eclipse modulation which was bascially the same as for the former SAAO data in regards to its shape.
The last small part of the data, mostly in , comes from SAAO observations conducted in October 2009. Again a wide range of the orbital phases was covered, including both minima, and an out-of-eclipse modulation was noticed to be of the same shape as for previous data sets. This led to a conclusion that if the modulation comes from the cold spots, the spot pattern did not change much between December 2008 and October 2009.
In total we gathered 598 brightness measurements in and 586 in , some under quite challenging conditions, which gave us a full phase coverage. Several primary and secondary minima as well as an out-of-eclipse variation were recorded, which allowed us to perform a detailed modeling of the system, starting from an update of the ephemeris and ending with spot and third light properties. For the last purpose especially useful were SAAO observations from December 2008, where in good seeing conditions we were able to distinguish A and B components on the CCD images (Fig. 1). From a number of images where the components were well detached, we estimated their brightness ratio in both bands. In this way we deduced that eclipses occur in the brighter component A, and obtained reasonable starting values for the third-light contribution, which were later incorporated in the model.
5 The physical model
The modeling procedure was in many aspects identical to the ones described in the three previous papers of this series. We used the jktebop code (Southworth et al., 2004a, b), which is based on the Eclipsing Binaries Orbit Program (ebop; Popper & Etzel, 1981; Etzel, 1981), and phoebe (Prša & Zwitter, 2005) – an implementation of the wd code (Wilson & Devinney, 1971). The jktebop was used on the ASAS light curve and served mainly to correct the ASAS ephemeris and check for marks of a non-zero eccentricity. We did not use it extensively since it does not allow for spots or work on RV curves. We should also note that PROMPT and SAAO light curves are almost indistinguishable and initial fits performed separately gave similar results, thus we decided to use all photometric data sets simultaneously in the whole fitting process. Photometric data points were weighted by their formal errors. Absolute values of several physical parameters, like radii, bolomeric magnitudes and distance, were obtained with the jktabsdim code, available with jktebop, in the same way as decribed in previous papers.
We improved the ephemeris from jktebop with phoebe using all available data, and used them to create a final orbital fit (Sect. 3) and later the full solution. We set the third light level in both bands to the values obtained from the CCD images and let them be fitted for in later stages of the process. We consider the uncertainty in the third light level as the main source of errors of physical parameters such as radii, temperatures and component magnitudes in both bands (see also ASAS-08 in: Hełminiak & Konacki, 2011). The third light uncertainty may possibly have its origin in the intrinsic photometric variability of component B, which is expected for such an active star.
The starting values of effective temperatures were deduced from the empirical colour–temperature relations by Worthey & Lee (2011) on the basis of dereddened values for every component. For the dereddening we used value from Schlegel et al. (1998). In general phoebe allows for calculating fluxes in every passband separately for every star. If one has at least two light curves in various bands, the program also allows for fitting both effective temperatures simultaneously using the concept of a “binary effective temperature” (Prša & Zwitter, 2005). The treatment of limb darkening and reflection albedos was the same as in our previous papers, as well as the way of finding parameters of cold spots. We tested several different configurations and found the best solution is when a large cold spot is located on the secondary and is obscured during the secondary eclipse, and a second small spot with maximum appearance around phase on the primary. Because the light curves do not contain much information about the latitude of spots, we decided to locate spots near the stars’ equators and keep this location fixed. Moving towards other latitudes did not change the final model significantly – the difference in inferred values of stellar parameters was smaller than uncertainties coming from other sources.
| ASAS-01 A | Primary | Secondary | ||
| Parameter | Value | Value | ||
| [∘] | ||||
| [R⊙] | ||||
| [M | 0.612 | 0.030 | 0.445 | 0.019 |
| 4.93 | 0.13 | 5.21 | 0.19 | |
| [R | 0.596 | 0.020 | 0.445 | 0.024 |
| 4.68 | 0.31 | 4.79 | 0.45 | |
| [km s-1]a | 67.3 | 2.5 | 50.5 | 2.8 |
| [mag]b | 1.84 | 0.14 | 2.17 | 0.14 |
| [K] | 3750 | 250 | 3085 | 300 |
| [mag] | 7.76 | 0.30 | 9.23 | 0.45 |
| [mag] | 9.18 | 0.31 | 10.65 | 0.89 |
| [pc] | ||||
| Parameters of spots | ||||
| Longitude [rad]c | 0.20 | 0.05 | 4.71 | 0.07 |
| Radius [rad] | 0.7 | 0.1 | 0.3 | 0.08 |
| Contrast | 0.9 | 0.1 | 0.9 | 0.1 |

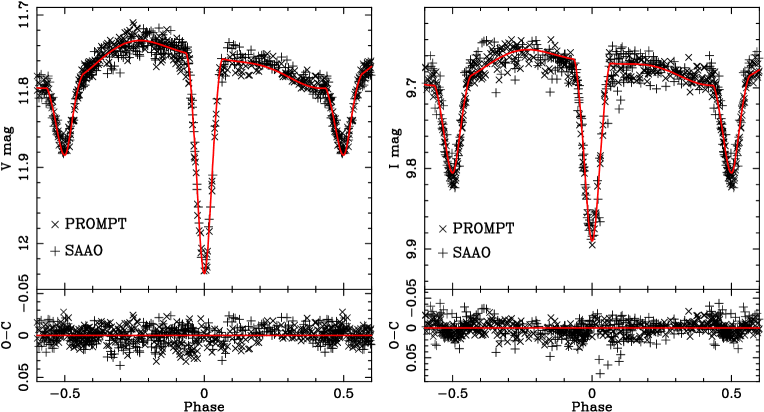
The final absolute values of derived physical parameters of ASAS-01 A are collected in Table 5. In Fig. 4 we present the observational and modeled light curves in (left) and (right) bands. One can see that the data taken with two different instruments and within almost a year overlap quite well, so it was justified to use them simultaneously. As was mentioned before, the pattern of the spots did not change significantly during this time, and no short-scale evolution occurred, as was found for two other low-mass systems – ASAS-09 and ASAS-21 (Hełminiak et al., 2011). The 3D reconstruction of the eclipsing pair in three orbital phases – 0.04 (primary eclipse), 0.25 (quadrature), and 0.46 (secondary eclipse) – is presented in Fig. 5 (top and middle), together with the influence of spots on the light curve (bottom left) and radial velocities (bottom right). On the RV plot we also present RV residuals in the same form as in Fig. 2. One can see that the influence of spots on the RV curves is much smaller than the spread of measurements, which allows us to conclude that the uncertainty of the mass is not underestimated. We did not succeed in reaching a 3% level of precision in mass and radius determination but we were close (3.4 – 5.4%).
One can also note that our distance determination – 39(6) pc – is in very good agreement with the result obtained by Riaz et al. (2006). Assuming the angular separation of 1.405(3) asec (Bergfors et al., 2010), the projected physical separation of the A and B components is thus = 55(8) AU. This corresponds to an orbital period yr, assuming a circular orbit and the total mass of component B M⊙ (similar to because of almost exactly the same value of ), or 292 yr for M⊙ (see Sect. 6.2 for a discussion). The gravitational influence of B on the pair A would not be detected with eclipse timing or precise RV measurements; however the orbital motion of B should be detectable with adaptive optics or various interferometric techniques.
6 Discusion
6.1 Evolutionary status
We compare our results with three sets of theoretical isochrones: Yonsei-Yale (Y2; Yi et al., 2001; Demarque et al., 2004), Dartmouth (Dotter et al., 2007), and Padova (Girardi et al., 2000; Marigo et al., 2008).
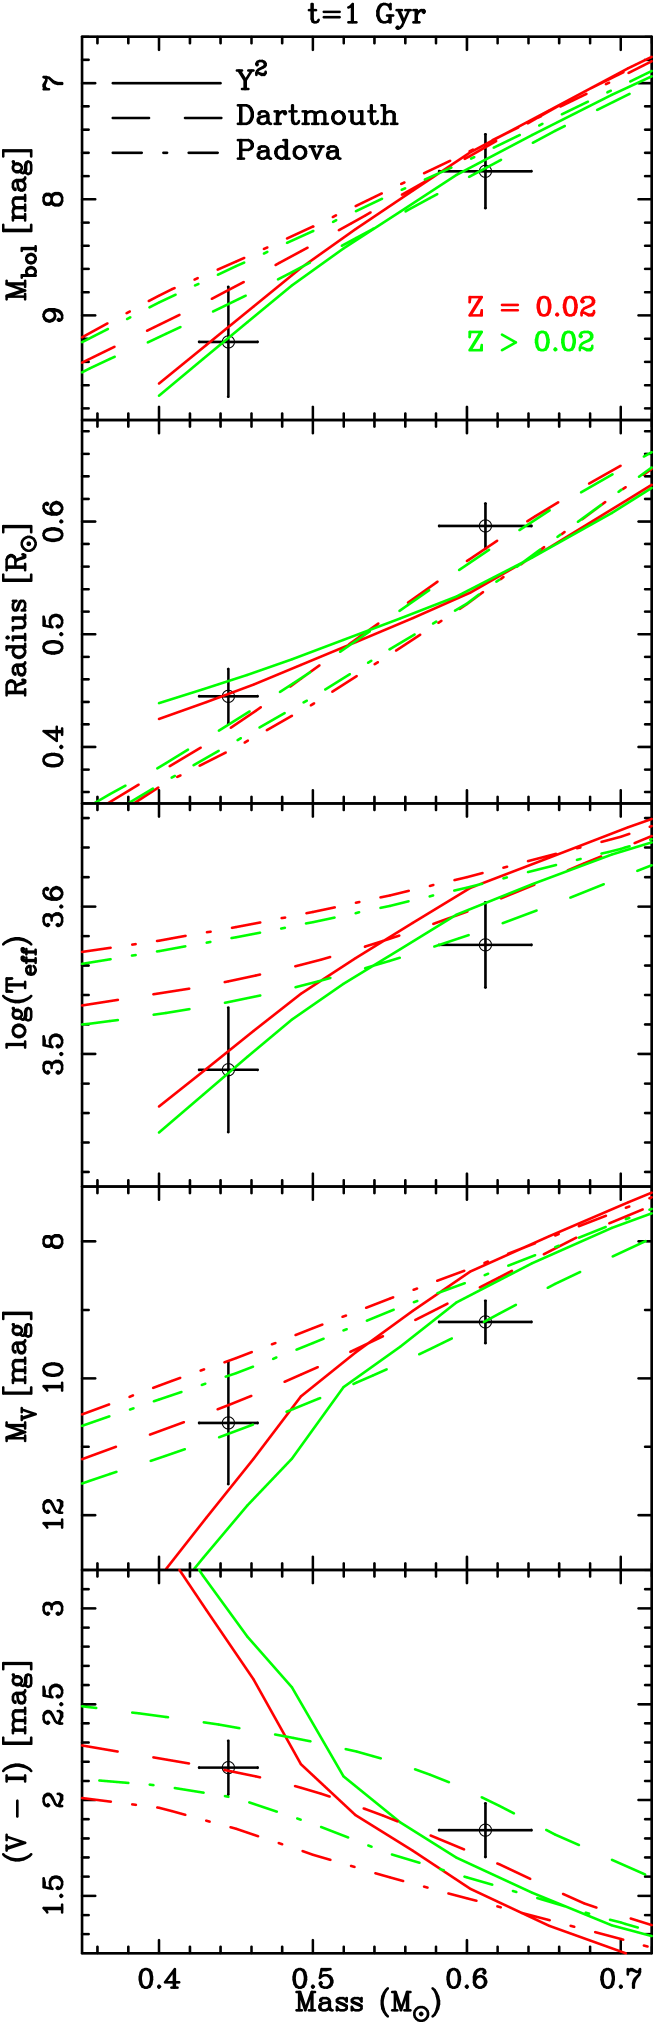
The comparison is shown in Figure 6. We present the bolometric magnitude, radius, effective temperature, absolute magnitude and the colour as a function of stellar mass. We compare our results with isochrones for an age of 1 Gyr and two cases of metallicities: (1) solar, (red lines), and (2) above solar (green lines), however different for every set: for Y2, 0.035 for Dartmouth, and 0.03 for Padova. Since the accuracy of our measurements is worse than the canonical 3%, the isochrones are shown only for comparison, i.e. we do not attempt to determine the age of the system. It is however enough to conclude that ASAS-01 is probably a main sequence object. The metallicity determination is even more insecure, however from the Fig. 6 one can claim that metallicities higher than solar are prefered – on the vs. and planes the isochrones fit significantly better to the data points.
The main sequence evolutionary stage of ASAS-01 is confirmed by its galactic kinematics. We used our determinations of the systemic velocity and distance together with the position and proper motion from the PPMXL catalogue: mas yr-1, mas yr-1 (Roeser et al., 2010). The obtained values of km s-1, km s-1 and km s-1 put ASAS-01 in the galactic thin disk, and only marginally in one of the young moving groups recently reported by Zhao et al. (2009, ID=15 therein).
It is worth noticing that on the plane the measurements agree within errors with the Y2 and Dartmouth models. The second one especially seems to reproduce the physical properties of ASAS-01 A components. It is in a somewhat contrary to many recent results of low-mass detached eclipsing binaries studies (see: Kraus et al., 2011). The usually, but not always, observed characteristic of low-mass stars in close binaries is that theoretically predicted radii are smaller and temperatures larger with respect to what is observed (Ribas et al., 2008), and this situation is seen for the Padova models. The Dartmouth models also seem to follow that trend, but only by a few per cent. Within our uncertainties they correctly predict the observed radii, and, in the case of , also temperatures. The deviation is smaller for the larger component, which presumably rotates faster, thus it does not support the possible radius-rotation relation for M⊙ stars (Kraus et al., 2011). At the same time the properties of the secondary are very well reproduced by the Y2 models (except for the colour) but for the primary we see the “typical” underestimation of the radius and overestimation of the temperature. From this short discussion we can only conclude that the Dartmouth models may be the best to reproduce the properties of low-mass stars (see also: Thompson et al., 2010) although discrepancies at the level of 3% are present. This is however significantly smaller than for the majority of previous studies where 5-15% difference in radii were claimed.
6.2 The companion B
Having the two components separated on and band images (Fig. 1), and the physical model created with phoebe with the third light included, we were able to estimate the photometric properties of component B. We present the fractional fluxes in both bands, the dereddened colour, and the absolute magnitude in Table 6.
| Parameter | Value | |
|---|---|---|
| [%]a | 34.8 | 1.5 |
| [%]a | 42.9 | 3.2 |
| [mag]b | 2.15 | 0.13 |
| [mag] | 10.82 | 0.70 |
| [M⊙] | [M⊙] | [∘] | [∘] | |
| 1.00 | 0.226 | 0.226 | 53 | 50 |
| 0.95 | 0.251 | 0.238 | 55 | 53 |
| 0.90 | 0.280 | 0.252 | 59 | 56 |
| 0.85 | 0.315 | 0.268 | 63 | 59 |
| 0.80 | 0.358 | 0.286 | 68 | 63 |
| … | ||||
| 0.718 | 0.45 | 0.323 | 90 | 75 |
| 0.684 | 0.5 | 0.342 | — | 90 |
| M⊙ | ||||
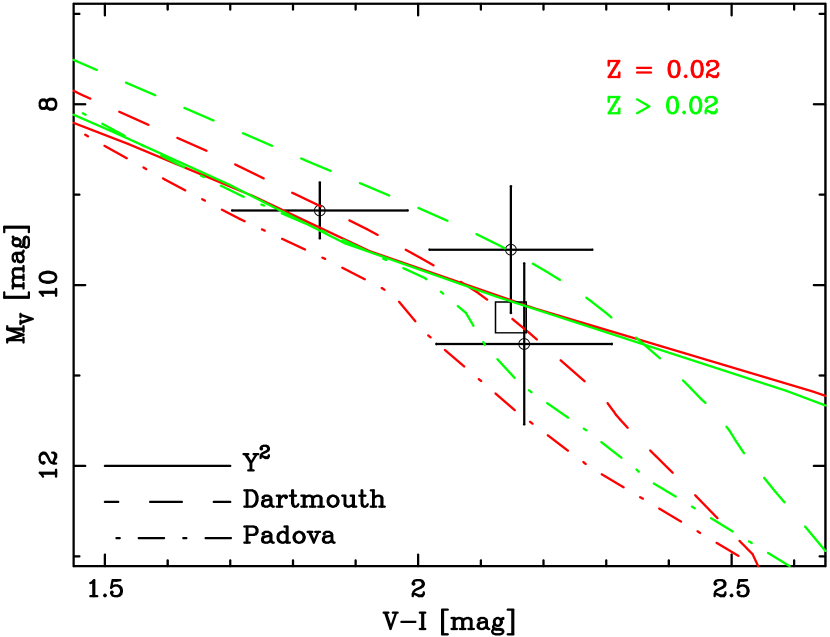
In Figure 7 we present our measurements on the plane. Data from Tables 5 and 6, and the same isochrones as in Fig. 6 are used. We see that again the Dartmouth set for gives the best match for the eclipsing pair A. Component B is about 0.7 mag brighter but has almost the same colour as Ab ( = 2.14 mag). Due to relatively large errorbars (magnified mainly by the uncertainty in the third light parameter in our model) one can formally find magnitudes of B and Ab almost equal and still rather consistent with the considered Dartmouth and both Y2 isochrones. However, if assuming that component B is composed of two nearly-twin stars with masses 0.45-0.5 M⊙, which would thus have the colour around 2.15 mag, i.e. almost the same as the value observed for B, those putative Ba and Bb components would be located in Fig. 7 on the position marked by the empty square (lowering the flux by a factor of 2 increases the magnitude by 0.7). In such a situation, the Darthmouth and Y2 isochrones would reproduce the observed properties of the system much better. We consider this fact as a support for the hypothesis of the binarity of ASAS-01 B.
The binarity of component B, with a mass ratio close to 1 and component colours close to the value observed, is consistent with the fact that no marks of additional eclipses are found in our and band light curves. From the orbital fit for component B radial velocities, presented in Table 3, we can estimate the orbital inclination for various values of the mass-ratio and the desired mass of the more massive component . We present those calculations in Table 7.
For a number of different values of , we present values of for Ba and Bb, and values of inclination angles, for which or 0.5 M⊙. From this Table one can see, that if ASAS-01 B is a binary, to explain all the observed properties one needs the inclination angle to be between 50 and 70 degrees, which corresponds to . For these values of masses of Ba and Bb we can expect the observed colour to be around the value given in Tab. 6. Assuming lower values of we would end up in a situation where additional eclipses occur and the Bb component is significantly fainter. In such a case the total brightness of ASAS-01 B would be lower than it is observed, however still within relatively large error bars.
If ASAS-01 is a double-double system, it would join a small group of this kind of interesting objects. To date only two other low-mass detached eclipsing binaries are known to be in similar configuration: BD -22 5866 – a system with K7+K7 eclipsing pair and M1+M2 non-eclipsing binary (Shkolnik et al., 2008), and YY Gem – the faintest member of a sextuple system composed of three spectroscopic binaries – Castor A, B and C ( Gem ABC; Vinter Hansen, Neubauer & Roosen-Raad, 1940; Kron, 1952; Bopp, 1974). There are also few examples of LMDEBs known to have a single additional companion, like LP 133-373 (Vaccaro et al., 2007), HIP 96515444No RV curve is published for this system. (Huélamo et al., 2009), MR Del (Pribulla et al., 2009; Djurašević et al., 2011), NLTT 41135 (Irwin et al., 2010), ASAS-08 (Montes et al., 2007; Hełminiak & Konacki, 2011) or the triply-eclipsing KOI-126 (Carter et al., 2011). Such systems not only allow more rigid constrains on the evolutionary models than in the cases of “lonely” eclipsing binaries, but also play important role in testing star-formation theories, stellar population codes and dynamical interactions in multiple stellar systems. The relative brightness and small distance to ASAS-01 make it a valuable object for further studies.
7 Summary
As a result of our analysis of the components of ASAS J01328-3821.1, an M-type multiple system, we obtained a complete set of orbital and physical parameters of the detached eclipsing pair A, and photometric and spectroscopic properties of component B. Due to a number of difficulties our results are of an accuracy of 3-6 %, which is not enough for performing reliable estimation of the evolutionary status of the system. Within the errorbars we may however reproduce our results with main sequence theoretical models. The observed spectroscopic and photometric properties of component B of the system suggest that this is a binary composed of nearly identical stars. However the eventual orbital solution is quite uncertain, and and errors are quite large, thus we can not make any final conclusions on this topic. ASAS-01, as a member of a rare class of late-type multiples with eclipsing detached components, should be considered as a potential testbed for stellar formation and evolution theories and definitely deserves more attention and investigation, especially considering the system’s spectroscopy and photometric properties of component B.
Acknowledgments
We would like to thank David Laney, John Menzies and Hannah Worters from the South African Astronomical Observatory for their support during our observations at SAAO, and Stephen Marsden and the Anglo-Australian Observatory astronomers for their help during our observing runs on the AAT. We thank Samba Fall and Chelsea Harrison for careful proofreading and corrections of this manuscript.
This research was co-financed by the European Social Fund and the national budget of the Republic of Poland within the framework of the Integrated Regional Operational Programme, Measure 2.6. Regional innovation strategies and transfer of knowledge - an individual project of the Kuyavian-Pomeranian Voivodship “Scholarships for Ph.D. students 2008/2009 - IROP”. This work is supported by by the Polish National Science Center grant 5813/B/H03/2011/40, by the Foundation for Polish Science through a FOCUS grant and fellowship and by the Polish Ministry of Science and Higher Education through grants N203 005 32/0449, N203 3020 35, and N203 379936. K.G.H. acknowledges support provided by the Proyecto FONDECYT Postdoctoral No. 3120153, the Centro de Astrofísica FONDAP Proyecto 15010003, Comité Mixto ESO-Chile and by the Ministry for the Economy, Development, and Tourism’s Programa Iniciativa Científica Milenio through grant P07-021-F, awarded to The Milky Way Millennium Nucleus. M.W.M. acknowledges support from the Townes Fellowship Program, an internal UC Berkeley SSL grant, and the State of Tennessee Centers of Excellence program. This research was supported in part by the National Science Foundation under Grant No PHY05-51164 and through Grants 0959447, 0836187, 0707634 and 0449001. The observations on the AAT/UCLES have been funded by the Optical Infrared Coordination network (OPTICON), a major international collaboration supported by the Research Infrastructures Programme of the European Commissions Sixth Framework Programme.
This research has made use of the Simbad database, operated at CDS, Strasbourg, France.
References
- Batten & Hardie (1965) Batten A. H., Hardie R. H., 1965, AJ, 70, 666
- Batten & Lu (1985) Batten A. H., Lu W., 1986, PASP, 98, 92
- Beers et al. (1996) Beers T. C., Rossi S., Ulrich D., Wilelm R., 1996, AJ, 112, 1188
- Bergfors et al. (2010) Bergfors C. et al., 2010, A&A, 520, A54
- Blake et al. (2008) Blake C. H., Torres G., Bloom J. S., Gaudi B. S., 2008, ApJ, 684, 635
- Bopp (1974) Bopp B. W., 1974, ApJ, 193, 389
- Carter et al. (2011) Carter J. A. et al., 2011, Sci, 331, 562
- Chabrier et al. (2007) Chabrier G., Gallardo J., Baraffe I., 2007, A&A, L17
- Clausen et al. (2008) Clausen J. V., Torres G., Bruntt H., Andersen J., Nordström B., Stefanik R. P., Latham D. W., Southworth J., 2008, A&A, 487, 1095
- Demarque et al. (2004) Demarque P., Woo J.-H., Kim Y.-C., Yi S. K., 2004, ApJS, 155, 667
- Djurašević et al. (2011) Djurašević G., Yılmaz M., Baştürk Ö., Kılıçoǧlu T., Latković O., Çalışkan Ş., 2011, A&A, 525, A66
- Dotter et al. (2007) Dotter A., Chaboyer B., Jevremović D., Baron E., Ferguson J. W., Sarajedini A., Anderson J., 2007, AJ, 134, 376
- Etzel (1981) Etzel P. B., 1981, Photometric and Spectroscopic Binary Systems, 111
- Gioia et al. (1990) Gioia I. M., Maccacaro T., Schild R. E., Wolter A., Stocke J. T., Morris S. L., Henry J. P., 1999, ApJS, 72, 567
- Girardi et al. (2000) Girardi L., Bressan A., Bertelli G., Chiosi C., 2000, A&AS, 141, 371
- González et al (2006) González J. F., Hubrig S., Nesvacil N., North P., 2006, A&A, 449, 327
- Halbwachs et al. (2003) Halbwachs J. L., Mayor M., Udry S., Arenou F., 2003, A&A, 397, 159
- Hełminiak et al. (2009) Hełminiak K. G., Konacki M., Muterspaugh M. W., Ratajczak M., 2009, MNRAS, 400, 969
- Hełminiak & Konacki (2011) Hełminiak K. G., Konacki M., 2011, A&A, 526, A29
- Hełminiak et al. (2011) Hełminiak K. G. et al., 2011, A&A, 527, A14
- Huélamo et al. (2009) Huélamo N. et al., 2009, A&A, 503, 873
- Irwin et al. (2010) Irwin J. et al., 2010, ApJ, 718, 1353
- Irwin et al. (2011) Irwin J. et al., 2011, ApJ, 742, 123
- Kraus et al. (2011) Kraus A. L., Tucker R. A., Thompson M. I., Craine E. R., Hillenbrand L. A., 2011, ApJ, 728, 48
- Kron (1952) Kron G. E., 1952, ApJ, 115, 301
- Lacy (1977) Lacy C., 1977, ApJ, 218, 444
- Lee et al. (2008) Lee C.-U., Kim S.-L., Lee J. W., Kim C.-H., Jeon Y.-B., Kim H.-I., Yoon J.-N., Humphrey A., 2008, MNRAS, 389, 1630
- Lucy (2006) Lucy L.B., 2006, A&A, 457, 629
- Marigo et al. (2008) Marigo P., Girardi L., Bressan A., Grönewegen M. A. T., Silva L., Granato G. L., 2008, A&A, 482, 883
- Montes et al. (2007) Montes D., Crespo-Chacón I., Gálvez M. C., Fernández-Figueroa M. J., 2007, in Hartkopf W. I., Guinan E. F., Harmanec P, eds, Proc. IAU Symp. 240, Binary Stars as Critical Tools & Tests in Contemporary Astrophysics. Cambridge University Press, Camridge, p.690
- Parihar et al. (2009) Parihar P., Messina S., Bama P., Medhi B. J., Muneer S., Velu C., Ahmad A., 2009, MNRAS, 395, 593
- Pojmański (2002) Pojmański G. 2002, AcA, 52, 397
- Popper & Etzel (1981) Popper D. M., Etzel P. B., 1981, AJ, 86, 102
- Pribulla et al. (2009) Pribulla T. et al., 2009, AJ, 137, 3655
- Prša & Zwitter (2005) Prša A., Zwitter T., 2005, ApJ, 628, 426
- Riaz et al. (2006) Riaz B., Gizis J. E., Harvin J., 2006, AJ, 132, 866
- Ribas et al. (2008) Ribas, I., Morales J. C., Jordi C., Baraffe I., Chabrier G., Gallardo J., 2008, MmSAI, 79, 562
- Roeser et al. (2010) Roeser S., Demleitner M., Schilbach E., 2010, AJ, 139, 2440
- Schlegel et al. (1998) Schlegel D., Finkbeiner D., Davis M., 1998, ApJ, 500, 525
- Shkolnik et al. (2008) Shkolnik E., Liu M. C., Reid I. N., Hebb L., Cameron A. C., Torres C. A., Wilson D. M., 2008, ApJ, 682, 1248
- Southworth et al. (2004a) Southworth J., Maxted P. F. L., Smalley B., 2004a, MNRAS, 351, 1277
- Southworth et al. (2004b) Southworth J., Zucker S., Maxted P. F. L., Smalley B., 2004b, MNRAS, 355, 986
- Stocke et al. (1991) Stocke J. T., Morris S. L., Gioia I. M., Maccacaro T., Schild R., Wolter A., Fleming T. A., Henry J. P. J., 1991, ApJS, 76, 813
- Szczygieł et al. (2008) Szczygieł D., Socrates A., Paczyński B., Pojmański G., Pilecki B., 2008, AcA, 58, 405
- Thompson et al. (2010) Thompson I. B., Kałużny J., Ruciński S. M. Krzemiński W., Pych W., Dotter A., Burley G. S., 2010, AJ, 139, 329
- Torres & Ribas (2002) Torres G., Ribas I., 2002, ApJ, 567, 1140
- Vaccaro et al. (2007) Vaccaro T. R., Rudkin M., Kawka A., Vennes S., Oswalt T. D., Silver I., Wood M., Allyn Smith J., 2007, ApJ, 661, 1112
- Voges et al. (1999) Voges W. et al., 1999, A&A, 349, 389
- Vinter Hansen, Neubauer & Roosen-Raad (1940) Vinter Hansen J. M., Neubauer F. J., Roosen-Raad, D., 1940, LicOB, 19, 89
- Wilson & Devinney (1971) Wilson R. E., Devinney, E. J., 1971, ApJ, 166, 605
- Worthey & Lee (2011) Worthey G., Lee H.-c., 2011, ApJS, 193, 1
- Yi et al. (2001) Yi S. K., Demarque P., Kim Y.-C., Lee Y.-W., Ree C. H., Lejeune T., Barnes S., 2001, ApJS, 136, 417
- Zhao et al. (2009) Zhao J., Zhao G., Chen Y., 2009, ApJ, 692, L113
- Zucker & Mazeh (1994) Zucker S., Mazeh T., 1994, ApJ, 420, 806