Fresh Activity in Old Systems:
Radio AGN in Fossil Groups of Galaxies
Abstract
We present the first systematic 1.4 GHz Very Large Array radio continuum survey of fossil galaxy group candidates. These are virialized systems believed to have assembled over a gigayear in the past through the merging of galaxy group members into a single, isolated, massive elliptical galaxy and featuring an extended hot X-ray halo. We use new photometric and spectroscopic data from SDSS Data Release 7 to determine that three of the candidates are clearly not fossil groups. Of the remaining 30 candidates, 67% contain a radio-loud (L W Hz-1) active galactic nucleus (AGN) at the center of their dominant elliptical galaxy. We find a weak correlation between the radio luminosity of the AGN and the X-ray luminosity of the halo suggesting that the AGN contributes to energy deposition into the intragroup medium. We only find a correlation between the radio and optical luminosity of the central elliptical galaxy when we include X-ray selected, elliptically dominated non-fossil groups, indicating a weak relationship between AGN strength and the mass assembly history of the groups. The dominant elliptical galaxy of fossil groups is on average roughly an order of magnitude more luminous than normal group elliptical galaxies in optical, X-ray, and radio luminosities and our findings are consistent with previous results that the radio-loud fraction in elliptical galaxies is linked to the stellar mass of a population. The current level of activity in fossil groups suggests that AGN fueling continues long after the last major merger. We discuss several possibilities for fueling the AGN at the present epoch.
1 Introduction
A “fossil galaxy group” is believed to be the merger remnant of a galaxy group whose most massive members have succumbed to dynamical friction. The low velocity dispersion of the group environment results in a high interaction rate between galaxies, such that the most massive members eventually coalesce to form a single giant elliptical. What remains is the faint dwarf galaxy population, and an extended, hot gaseous halo that fills the dark matter potential of the former group. As the dynamical end point of groups, fossil groups appear to be undisturbed, virialized systems. They are identified observationally by two criteria: fossil groups are dominated by a single elliptical galaxy, typically brighter than L∗, where the next brightest companion is fainter by at least two magnitudes in R-band; and an extended, hot X-ray halo, typically brighter than L ergs s-1 (Jones et al., 2003).
The first fossil group system, RX J13040.6+4018, was identified by comparing ROSAT extended deep survey images with Palomar sky survey plates (Ponman et al., 1994). In the last decade, several authors have contributed to a growing list of known fossil groups (e.g. 3, Vikhlinin et al. 1999; 5, Jones et al. 2003; 3, Yoshioka et al. 2004; 1, Khosroshahi et al. 2004; 1, Sun et al. 2004; 1, Ulmer et al. 2005). Recently, Santos et al. (2007) used the Sloan Digital Sky Survey (SDSS) Data Release 5 (DR5) and the ROSAT All-Sky Survey (RASS) to catalog 34 fossil group candidates allowing for the beginning of statistical investigations into the nature of such objects. Since the undertaking of our radio survey, Eigenthaler & Zeilinger (2009) reported 34 new fossil groups, and La Barbera et al. (2009a) identified an additional 25 fossil group candidates in SDSS DR4 and RASS.
The formation of fossil groups is inferred from the comparison of the optical luminosity of the central elliptical galaxy and the X-ray luminosity of the halo with observations of systems in a range of similar or intermediate evolutionary states. The optical and X-ray values of fossil groups are comparable to compact galaxy groups—systems believed to be in the most advanced stages of merging (Mendes de Oliveira & Carrasco, 2007). Further, they are more numerous than compact groups suggesting that the merging occurs on short timescales compared to the lifetime of the group (e.g. Mamon 1987). The end result is the largest galaxies in compact groups succumb to dynamical friction to coalesce into a single, massive elliptical galaxy (Mendes de Oliveira et al., 2006; Mendes de Oliveira & Carrasco, 2007).
Cosmological N-body simulations suggest that fossil groups formed early in the lifetime of the Universe, assembling half their mass by redshift of (D’Onghia et al., 2005), or by (von Benda-Beckmann et al., 2008). Observationally, the luminosity function, the large magnitude gap between the first and second ranked galaxies, and the large virialized X-ray halo are believed to be indicative of this early formation (Ponman et al., 1994; Jones et al., 2003; Mendes de Oliveira et al., 2006). However, simulations also show that fossil groups may only be a phase of hierarchical structure evolution which ends with the fresh infall of massive galaxies from the surrounding environment (von Benda-Beckmann et al., 2008; Dariush et al., 2010). It has been noted that the dominant elliptical galaxy in fossil groups frequently resembles that of the brightest cluster galaxies (e.g. Vikhlinin et al. 1999; Mendes de Oliveira et al. 2006), and because fossil groups have a similar space density to galaxy clusters ( Mpc-3; Jones et al. 2003; Santos et al. 2007), it has been suggested that may be the early seeds around which present-day clusters form (Jones et al., 2003).
Fossil groups are most well studied at optical and X-ray wavelengths, and it has been demonstrated that a strong relationship exists between the X-ray and R-band luminosities of the hot halo and the central dominant elliptical galaxy, respectively. This relationship indicates that the conditions of the group environment are linked to the mass assembly history of the fossil group (Jones et al., 2003). However, it is unclear what mechanism is responsible for elevating the X-ray temperature in fossil groups.
Clusters and elliptically dominated non-fossil groups follow the well known X-ray luminosity-temperature relationship (e.g. White et al. 1997; Jones et al. 2000) and the temperatures of these systems imply the presence of non-gravitational heating in the intracluster and intragroup medium (ICM/IGM). Radio active galactic nuclei (AGN) commonly occur in these systems and their detailed morphology frequently corresponds to cavities in the X-ray halo, thus they are invoked to account for excess energy in the ICM/IGM (e.g. Bîrzan et al. 2004; Wise et al. 2007). Fossil group X-ray halos for which the temperature has been measured appear to follow a similar relation although they are more luminous relative to non-fossils implying that if the X-ray luminosity is boosted, so is the temperature (Khosroshahi et al., 2007). Among non-fossil groups, evidence shows that radio-loud groups are hotter in X-rays than radio-quiet groups, indicating that on-going nuclear activity contributes to heating the IGM (Croston et al., 2005). Simulations show that radio jets from AGN may deposit significant amounts of energy in the IGM (e.g. Nath & Roychowdhury 2002; Heinz et al. 2006), and both simulations and observations of clusters support the theory that radio AGN can provide a sufficiently distributed heating mechanism to account for the excess energy (Brüggen & Kaiser 2002; Fabian et al. 2003). However, simulations by Rowley et al. (2004) suggest that major mergers can also elevate the X-ray temperature and luminosity in clusters of a few M⊙ and that this may last for up to a Gyr after the stellar merger signatures have faded, decreasing the necessity of AGN to account for excess energy in the IGM.
A radio investigation is therefore important for understanding the role of radio AGN in heating the IGM in fossil groups. A multi-wavelength investigation will allow us to link the properties of the radio AGN (or lack thereof) to the group environment as traced by the X-ray halo, and mass assembly of the central galaxy as indicated by the -band stellar luminosity. Further, if radio AGN are common in fossil groups, what physical mechanism is responsible for maintaining or triggering them long after the majority of mass assembly has taken place in these systems? There is some evidence that optical AGN activity is the result of major mergers at late times (Alonso et al., 2007), however observations and simulations suggest the last major merger in fossil groups occurred well over 1 Gyr in the past (D’Onghia et al., 2005; von Benda-Beckmann et al., 2008; Jones et al., 2000; Khosroshahi et al., 2006). Additionally, radio AGN activity, or indeed any AGN activity, appears to be well removed from merger activity, particularly since a redshift of (Schawinski et al., 2010; Cisternas et al., 2011). The thermodynamic properties of the X-ray halo gas, undisturbed by recent mergers, exhibited by the smooth, symmetric distribution of the X-ray contours, make the fossil group an ideal observational laboratory in which to test theories of AGN feedback for regulating the temperature of group and cluster sized halos (Jetha et al., 2009).
In this paper, we present the first systematic radio study of fossil group candidates taken from the Santos et al. (2007) ROSAT/SDSS DR5 catalog, with a modestly deep 1.4 GHz Very Large Array (VLA) survey, and use our results to conduct a multi-wavelength investigation of fossil groups. We measure the radio flux as a tracer of AGN activity and our results reveal the degree to which radio AGN are currently contributing to the energy deposition of the IGM. We calculate the fraction of radio-loud AGN and compare the population of radio sources with those in elliptically dominated groups and clusters which represent the continuum of hierarchical structures. The presence of radio AGN indicate that physical mechanisms such as cooling flows, minor mergers, or late-time accretion, are important for sustaining an AGN late in the evolution of fossil group systems, long after the majority of mass assembly has taken place. Thus, our radio survey is strongly motivated by outstanding questions in the evolution of galaxies, gas accretion, and the hierarchical formation of large scale structure.
The rest of the paper is organized as follows: in Section 2 we describe our VLA 1.4 GHz radio observations and the data reduction, and describe the acquisition of optical data from SDSS DR7. In Section 3 we compare published X-ray data based on the Santos et al. (2007) sample, with SDSS DR7 r-band photometry and with our 1.4 GHz radio results. In Section 4 we discuss the possibilities for fueling a radio source long after the last major merger with the central, dominant elliptical galaxy. Finally, we conclude in Section5.
2 Sample Selection, Observations, and Data Reduction
Our radio survey is derived from the catalog of 34 fossil group candidates identified by Santos et al. (2007). The catalog was constructed by comparing r-band photometry from Sloan Digital Sky Survey (SDSS) Data Release 5 (DR5) with X-ray observations from the ROSAT All-Sky Survey. Santos et al. (2007) followed the traditional definition of a fossil group, but loosened the X-ray criterion. In this catalog a system qualified as a fossil group candidate when (1) the optical image consists of an elliptical galaxy where the difference in brightness between it and the next brightest galaxy is greater than 2 magnitudes in -band, and (2) the candidate system is detected as an extended X-ray source. The search volume was fixed to a radius of Mpc from the dominant elliptical galaxy and a equivalent to the SDSS photometric redshift uncertainty. (For more discussion see Section 2 and 3.3 of Santos et al. 2007). Unlike previous searches for fossil groups, Santos et al. (2007) do not impose a lower limit on the X-ray luminosity and do not assume a lower limit for the number of companion galaxies. Nonetheless, they only find one system which lies below the typical X-ray cutoff of L ergs s-1 and they find no systems of isolated ellipticals.
2.1 Radio Observations
We observed 33 of the 34 fossil groups with the Very Large Array (VLA) in B- or BnC-configuration in Spring 2009 (Project Code AH0988). Observations were conducted with a standard VLA L-band continuum mode of 8 channels and 25 MHz bandwidth. We spent 50-60 minutes of total integration time centered on the dominant elliptical galaxy in each fossil group. We observed a bright flux calibrator once at the beginning or end of each observing run and then alternated between our target and a phase calibrator every 20-25 minutes. The fossil groups span an average of arcminutes on the sky, the largest spanning 13 arcminutes, which fits well within the 30 arcminute primary beam of the VLA at 1.4 GHz.
The observations were reduced in the standard way using AIPS. In imaging and deconvolution, we were careful to box and clean every source we could identify in the field in order to minimize flux contamination from sidelobes and we used faceting techniques to image bright sources far from the pointing center. The resolution of the synthesized beam at 1.4 GHz in B-array ranges from 30 kpc at z = 0.489 to 2.5 kpc at z = 0.032, which allowed us to resolve structure in some of the sources. In all fossil group detections, the radio source is associated with the central, dominant elliptical galaxy. In one case, J104302.57+005418.2, a radio source detected near the pointing center is associated with a background galaxy.
We attain an rms noise of Jy beam-1 for each detection. For undetected sources we reach a mean rms of Jy beam-1, 5.2 times deeper than NVSS (Condon et al., 1998) and 1.7 times deeper than FIRST (Becker et al., 1995). The rms of our observations were in some cases limited by the presence of a nearby strong continuum source.
2.2 Update of Optical Data
To put our 1.4 GHz results in the context of previously published observations and simulations, we sought to calculate the difference in -band magnitude between the first- and second-ranked galaxies of each fossil group (mag). To find this quantity, we repeated the neighboring galaxy query described in Appendix A of Santos et al. (2007) in the SDSS query database, CasJobs, on DR7. The initial DR5 based catalog relied on photometric redshifts to identify fossil group candidates; in DR7 all first-ranked galaxies now have spectroscopic redshifts although the majority of neighbors are still photometric.
The DR7 magnitudes reveal that six candidates no longer qualify as fossil groups, as they fail the optical criteria of having mag . Three of these candidates fail the criteria dramatically by having a mag between the first- and second-ranked galaxies. The remaining three candidates are on the cusp of the fossil group criteria having mag . However, as several studies have pointed out, mag is an arbitrary distinction by which to identify fossil groups. In fact, fossil groups may be a short lived phase of evolution that is terminated with renewed infall from the surrounding environment (von Benda-Beckmann et al., 2008). Simulations demonstrate that alternate criteria may select older systems that are longer lived fossil groups (Dariush et al., 2010), however there is clearly a continuum of structures. As a result, we choose to include fossil group candidates with mag in our subsequent analysis, while dropping those with mag . Finally, we visually inspected the SDSS images and find that even with complete spectroscopic coverage it is unlikely any other candidates would further fail the optical fossil group criteria. The results from DR7 brings our sample to 30 remaining fossil groups for which we presently drop the “candidate” status.
3 Results
We detect 20 (67%) of the fossil groups in our VLA observations above the 3 level. All but one of these sources are radio-loud (L W Hz-1) within their error bars. The definition of “radio-loud” varies throughout the literature, however we chose this cutoff based on the findings of Sadler et al. (2002) that above this luminosity the radio source population is dominated by AGN, while below it radio sources are primarily starbursting galaxies.
In Figures 1 & 2 we present the 1.4 GHz radio contours overlaid on SDSS r-band images. We believe these detections are unambiguous. Given the color, morphology, and DR7 spectra of the central elliptical galaxies, we confirm that all of our radio sources are associated with AGN activity. Roughly half of the radio detections are unresolved point sources while half show extended emission and sometimes detailed structure ranging from fuzzy, extended halos to dramatic bipolar jets with large lobes. In the sole case of an off-center extended radio source, J104302.57+005418.2, it is clearly associated with a background galaxy (panel 6 of Figure 1). In the case of J114803.81+565425.6 the brightest radio source is located south of the pointing center and is associated with a background quasar at a redshift of (panel 11 of Figure 1). Therefore, we only consider emission located at the position of the central elliptical galaxy and extending continuously to the northwest as emission associated with the fossil group. Only five of the Santos et al. (2007) candidates were previously detected in NVSS or FIRST demonstrating the necessity of deeper radio observations for multi-wavelength studies of fossil group candidate systems.
Table 1 summarizes our multi-wavelength data set. All 33 fossil group candidates which were observed with the VLA are included; the three candidates which fail the optical criteria with mag are indicated by an asterisk. In the following subsections we present the results of our multi-wavelength comparison between radio, optical, and X-ray characteristics of the central elliptical galaxy. We investigate scaling relations which may provide insight into the evolution of fossil groups (e.g. Khosroshahi et al. 2007). To understand the radio emission in the context of group evolution and mass assembly we compare our results with a radio investigation of the dominant central elliptical galaxy in X-ray bright, non-fossil groups from the Group Evolution Multiwavelength (GEMS) survey (Osmond & Ponman, 2004) reported by Croston et al. (2005).
3.1 : A Consistency Check
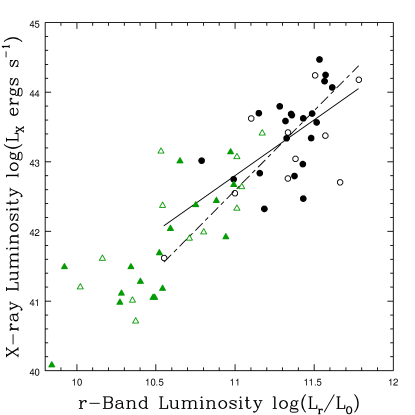
Jones et al. (2003) and Khosroshahi et al. (2007) quantified a relationship between the bolometric X-ray luminosity of the extended hot gaseous halo and the optical R-band luminosity of the central dominant elliptical galaxy of fossil groups. This correlation is considered indirect evidence that the isolated elliptical galaxy is the result of group merger activity. In Figure 3, we plot the keV luminosity of the extended X-ray halo reported in Santos et al. (2007), versus the SDSS DR7 r-band luminosity of the central dominant elliptical galaxy reported in this work. Filled black circles indicate fossil groups that are detected in our radio survey; open black circles represent fossil groups for which no radio source is detected. Green symbols are non-fossil, elliptically dominated groups from the GEMS survey (Croston et al., 2005). Interestingly, both detections and non-dections are well distributed over the full range of optical and X-ray luminosities from the brightest to the faintest central elliptical galaxy and fossil group halo.
We conduct a least-squares fit to the fossil group sample and find fits the data best. This is difficult to directly compare with previous studies which use the bolometric X-ray luminosity of fossil groups, however we have plotted the slope of the best fit line from Jones et al. (2003), with a slope of , in our figure for a relative comparison. The degree of scatter in the plot is such that either line could be argued to fit the data. Our “best fit” line is also shallower than that found for a sample of elliptical galaxies ranging from individual elliptical galaxies with erg s-1 to cluster galaxies with erg s-1 (; Beuing et al. 1999). Nonetheless, we believe that our sample of fossil groups follows a similar “scaling relation” to that of Jones et al. (2003) and Khosroshahi et al. (2007) and therefore consists of similar systems to fossil groups previously presented in the literature. Additionally, the central elliptical galaxies are consistent with those in other fossil group samples which are an order of magnitude more luminous in both X-ray and optical luminosities than normal elliptical galaxies, for example compared to the GEMS groups. Figure 3 also shows that the trend between X-ray and optical works for non-fossil groups, extending to dominant elliptical galaxies of lower stellar mass, consistent with previous work (e.g. Helsdon & Ponman 2003).
3.2 and : Multi-wavelength Comparisons
The 1.4 GHz radio emission is dominated by synchrotron emission from nuclear activity in the central elliptical galaxy, with little to no contribution of free-free emission from star formation. The presence of radio emission suggests that radio AGN contribute to heating the intragroup medium (IGM) long after the central dominant elliptical galaxy has assembled the majority of its mass. Two possibilities exist: the AGN may be long-lived or it may be recently rejuvenated. By connecting the radio properties of the AGN with the X-ray properties of the halo and the optical properties of the central galaxy, we attempt to understand AGN activity within the evolutionary framework of fossil groups.
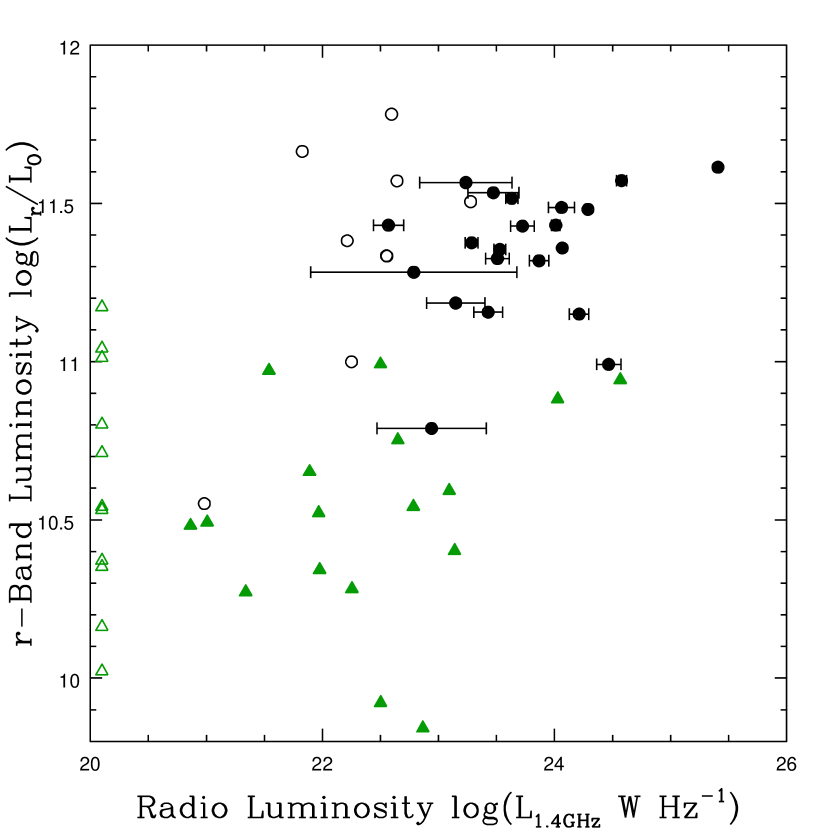
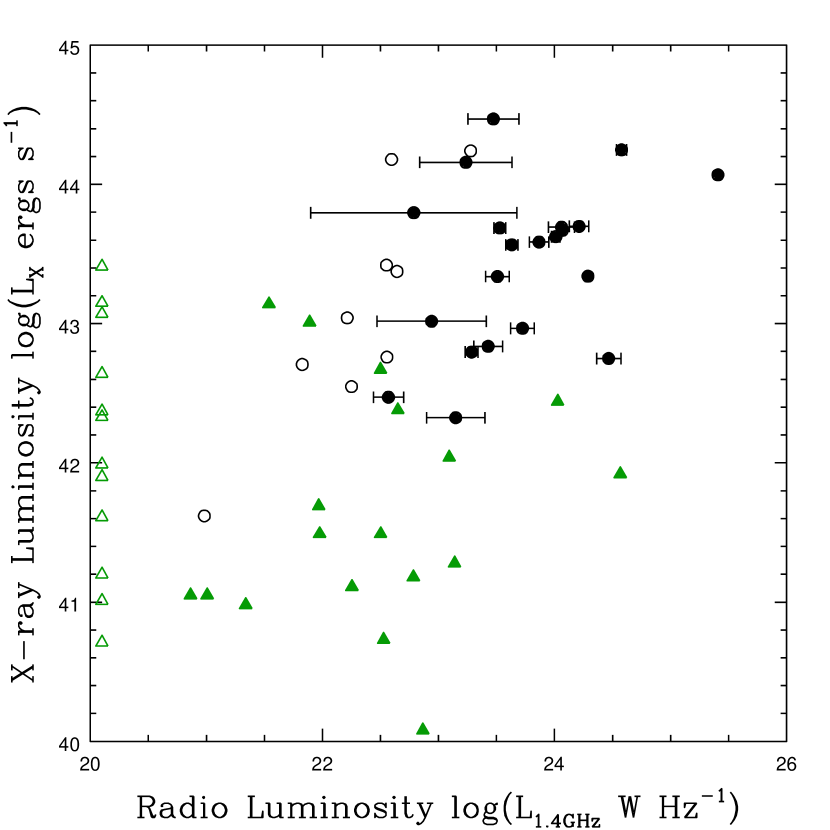
Figure 4a shows the plot of -band versus radio luminosities. Figure 4b shows the plot of X-ray versus radio luminosities. Black points represent our fossil group sample. Open circles indicate 3 upper limits for non-detections. Green points represent the sample of elliptically dominated non-fossil groups from Croston et al. (2005). Non-detections are plotted as open circles to the left to demonstrate their range of optical and X-ray luminosities, respectively.
We find that, within the fossil group population, there is no trend between radio and optical luminosities. However, when we include the dominant elliptical galaxies in non-fossil groups we find that, in general, the radio emission is an order of magnitude greater in fossil than non-fossil groups.
When we similarly break down the radio–X-ray plot, there is a weak trend among fossil groups that more X-ray luminous objects are also more radio-loud. This trend is strengthened when we include non-fossil groups. Both fossil and non-fossil groups that are more luminous in X-rays also tend to be more luminous at radio wavelengths. This is consistent with the finding of Croston et al. (2005) that radio-loud, non-fossil groups are hotter in X-rays than radio-quiet groups, which suggests radio AGN contribute to heating the IGM.
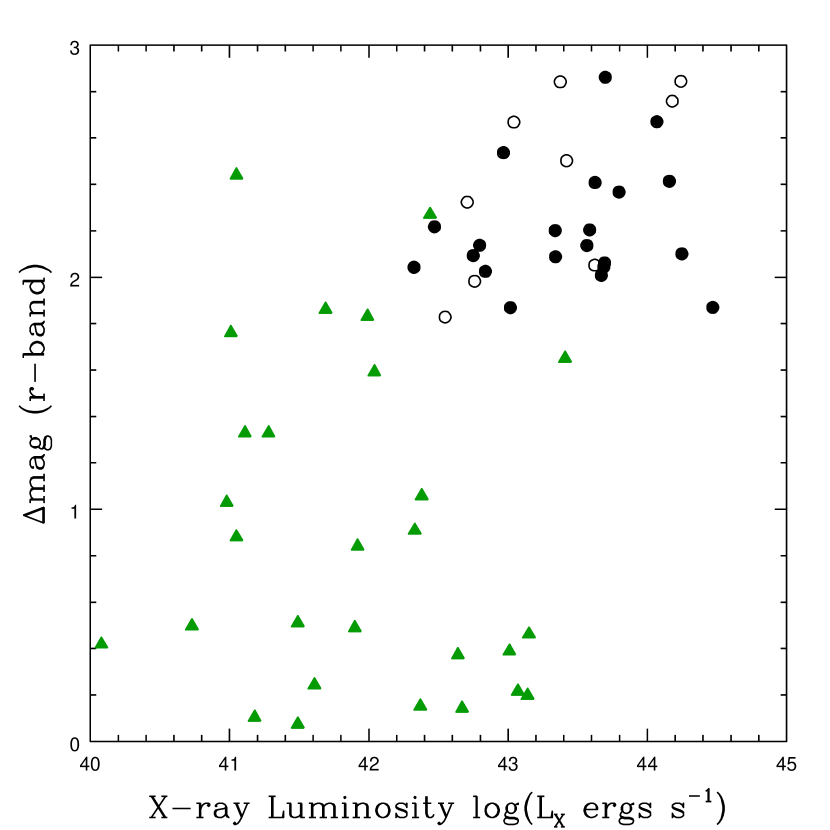
3.3 mag : AGN Activity Since Fossil Group Formation
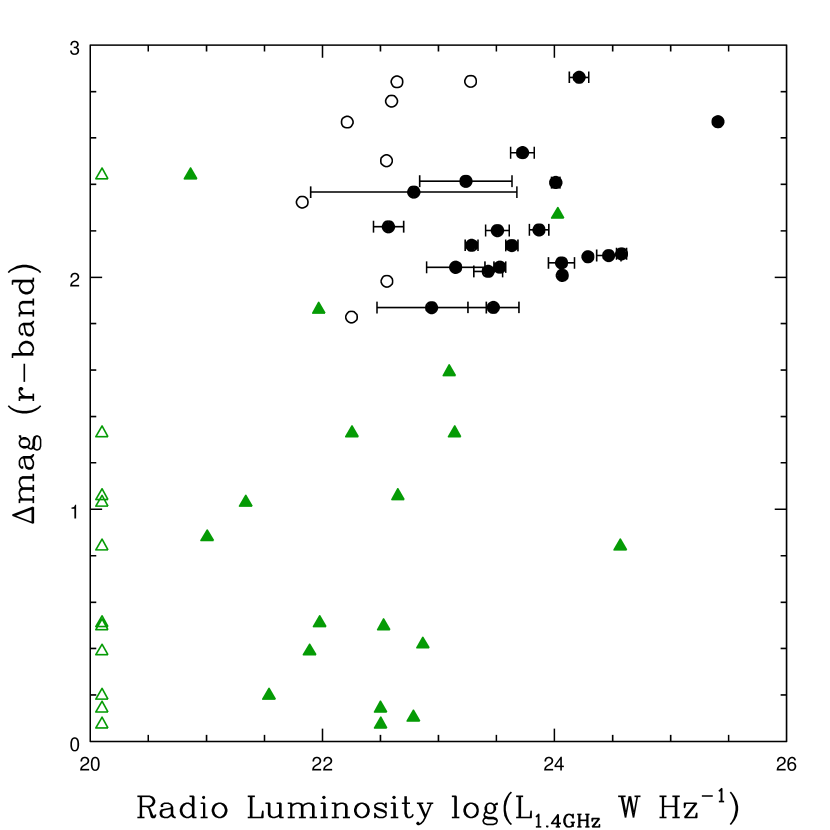
Fossil groups may only be a phase in the build up of hierarchical structure, however simulations suggest a relationship between the formation time of the fossil group and the difference in optical magnitude between the two brightest group member galaxies (mag; D’Onghia et al. 2005; von Benda-Beckmann et al. 2008). The formation time is defined as the epoch at which 50% of the system’s virial mass has been assembled, and the relationship shows that the earlier a fossil group formed, the larger the magnitude gap (Figure 2 of D’Onghia et al. 2005).
We plot mag against the radio and X-ray luminosities to investigate a connection between the proxy for the fossil group formation time and the strength of the AGN (Figure 5a) or the luminosity/temperature of the hot X-ray halo (Figure 5b). Again, when we only consider the fossil groups, there is no correlation between the mag and the radio/X-ray luminosities of the central elliptical galaxy. However, when we include non-fossil groups, we find that groups below the mag criterion tend to be fainter in terms of both their radio and X-ray luminosities. In Figures 5a and 5b the green points are the same galaxy groups studied by Croston et al. (2005), but the difference in magnitude between the first- and second-ranked galaxies are reported in Osmond & Ponman (2004). We note that the trend between mag and formation time reported by D’Onghia et al. (2005) is really brought out by the groups with mag . Similarly, any trend between mag and radio/X-ray luminosities is only evident when we include non-fossil groups in the comparison.
4 Discussion
Best (2004) demonstrated that the preferred environment of radio galaxies is the centers of elliptically dominated groups and poor-to-intermediate richness clusters. Nonetheless, it is remarkable that we detect the majority of fossil groups as not only radio sources, but as radio-loud AGN. One can no longer consider the otherwise dynamically old systems of fossil groups to be passively or quiescently evolving. The short lifetime for radio synchrotron emission at 1.4 GHz (a couple hundred Myr after a source has turned off; Jones & Preston 2001) compared to the formation timescale of fossil groups inferred from simulations (several Gyr), or the cooling time of X-ray emitting hot gas suggests that a long-lived or recurring process is driving the AGN activity.
We argue that the radio luminosity is related to the properties of the group/cluster environment, as measured by the hot X-ray halo, and, less directly, to the mass assembly of the dominant elliptical galaxy, as measured by the optical stellar luminosity. Indeed, the fact that multi-wavelength trends exist even while some sources remain undetected at 1.4 GHz favors a recurring process which drives AGN activity. Further, the strength of the radio AGN when it “turns on” seems to know something about the physical state of the group/cluster environment and the history of mass assembly: stronger AGN reside in more X-ray luminous halos and more massive central elliptical galaxies. Finally, the consistency between our results and those of Croston et al. (2005) suggest that current AGN activity is linked to the heating of the IGM in fossil groups just as it is in non-fossil groups.
It is not clear to what degree these properties are related to the formation time scale of the fossil group (mag). This is, first, because the trends seen in Figure 5 are weak, and second, because recent simulations suggest that fossil groups are not as simple as an end point for group evolution. These structures may continue to undergo mass assembly with the fresh infall of massive galaxies (Dariush et al., 2010). To get an observational handle on this aspect of fossil group evolution, we seek a control sample of non-fossil groups with the same X-ray luminosity and stellar mass distributions as the Santos et al. (2007) fossil groups, but spanning the full range of mag. The challenge in finding an established sample in the literature comes from the requirement of complete multi-wavelength coverage and from the fact that fossil groups occupy the high end of the optical luminosity function (Díaz-Giménez et al., 2008; Dariush et al., 2010; Méndez-Abreu et al., 2012). Nonetheless, in this section we elaborate on the elliptically dominated subset of the GEMS sample, as well as examine two additional samples from the literature of X-ray bright elliptical and early-type galaxies. The environment of these galaxies range from loose groups to poor clusters. In addition, we discuss possibilities for fueling radio AGN activity in fossil groups long after the last major merger has taken place.
4.1 Comparison Samples
Croston et al. (2005) studied the radio properties of the elliptically dominated galaxy groups selected from the GEMS survey (Osmond & Ponman, 2004). All of these groups contain diffuse X-ray emission measured by ROSAT. Of these non-fossil groups, 63% contain radio sources of which 26% are radio-loud using the definition. We converted the B-band luminosities of the dominant elliptical galaxies to SDSS r-band, assuming (Fukugita et al., 1995), and found that they are, on average, an order of magnitude fainter than our fossil groups (e.g. Figure 3). The distribution of X-ray luminosities is similarly fainter in magnitude compared to the X-ray halos of the fossil groups, making this an interesting comparison sample, but not suitable as a control sample.
Dunn et al. (2010) investigated a complete sample of very nearby massive, X-ray bright elliptical and S0 galaxies (all but one galaxy are at distances less than 70 Mpc) across a range of environments. They find 94% are detected in radio at some level, and 11% of their sources are radio-loud. Again, we converted the B-band luminosities (from Beuing et al. 1999) and find that they reside an order of magnitude down the luminosity function compared to our fossil groups.
Finally, we compared the optical luminosities of our fossil groups with those of MKW/AWM poor clusters (Morgan et al., 1975; Albert et al., 1977). We converted V-band magnitudes reported by Yamagata & Maehara (1986) and find that they have the same distribution to our fossil group sample in both optical and X-ray luminosities (Kriss et al., 1983). AWM/MKW poor clusters have a broad range of mag, as great as 1.8, and Ledlow et al. (1996) suggests that they may be a precursor to fossil groups. Thus, MKW/AWM poor clusters may be an excellent comparison sample to represent the non-fossil environment, across a range of mag. A fraction of these poor clusters was observed at 1.4 GHz by Burns et al. (1980, 1981), first with single dish observations and followed up with the VLA. They find that 8% of the poor clusters are detected above 400 mJy. This is similar to the fraction of fossil group candidates detected in the NVSS and FIRST surveys (mean rms of 450 and 150 mJy, respectively) before our pointed observations. The AWM/MKW clusters have a closer redshift distribution than our sample of fossil groups. Nonetheless, the similarity of the brightest cluster/group galaxy between poor clusters and fossil groups suggests that deep radio observations, a complete multi-wavelength investigation, and a comparison with cosmological simulations of galaxy and structure formation may reveal interesting results about their evolutionary state.
We conclude that the radio/x-ray/stellar mass correlations for galaxies identified as fossil groups are no different than those for non-fossil or poor cluster ellipticals with extended x-ray emission. More speculatively, our results reinforce the notion that fossil groups are just a phase in the dynamical evolution of groups. In addition to being an order of magnitude brighter in both -band and X-ray emission, we show that fossil group central elliptical galaxies are also brighter at 1.4 GHz than non-fossil dominant elliptical galaxies. Our results, combined with those samples above, are consistent with those of Best et al. (2005) who find that the fraction of galaxies with a radio-loud AGN increases with increasing stellar mass of the host galaxy. Even within this small sample of fossil groups, if we bin them by -band stellar luminosity, the fraction of fossil groups detected as radio-loud increases with increasing luminosity. Although we ignore the complexities of converting -band luminosity to stellar mass, it is interesting to note that the fraction of radio-loud fossil groups as a function of luminosity is comparable at the highest luminosity bin (60-75% at ) to the fraction of radio-loud brightest cluster galaxies in the highest mass () bin observed by Best et al. (2007).
4.2 Fueling AGN in fossil groups
The question pertaining to radio AGN in fossil groups then becomes what is the fueling mechanism which drives AGN activity in these dynamically old systems? Although optical AGN activity in nearby, predominantly late-type galaxies may be the result of major mergers at late times (Alonso et al., 2007; Schawinski et al., 2010), the nature by which fossil groups formed and their age inferred through simulations rule out major mergers. The lack of obvious stellar signatures in SDSS images such as shells, tidal tails, arcs, or multiple nuclei in the elliptical isophotes of the central early-type galaxy confirm that they have not undergone a major merger in the last gigayear or more (Schneider & Gunn, 1982; Thomson & Wright, 1990). Further, we have examined the SDSS spectra of the dominant elliptical galaxies and found that they are exclusively absorption line spectra, indicating that they do not show signs of optical AGN activity and they have likely not experienced a strong burst of star formation in the last 20 million years. In this section we discuss alternative possibilities for fueling radio AGN activity, including cooling flows such as have been invoked in so-called cooling core clusters, minor mergers as may be important in Seyferts, and H I accretion from the surrounding environment as viewed in absorption associated with early-type radio galaxies.
The presence of an AGN may be intricately tied to the thermal state of the IGM in a complex feedback loop with a cooling flow at the center of the group potential. Modeling of deep X-ray observations of non-fossil groups (e.g. Ponman & Bertram 1993; David et al. 1994) and clusters (e.g. Fabian et al. 2001) show some evidence for cooling flows, however, the temperature of these systems is not observed to reach the level required for gas to cool to the center of the galaxies harboring cool cores. Modeling spectroscopic X-ray observations of clusters show that cooling flows only appear to deposit mass at roughly 10% of the rate expected from simple cooling flow models (e.g. David et al. 2001; Peterson et al. 2001). Nonetheless, cooling flows may be the best candidate for providing fuel to a supermassive blackhole and regulating AGN activity (e.g. Fabian (1994) and references therein).
Fossil groups for which the temperature has been measured range from 0.66-4 keV (Khosroshahi et al., 2007; Yoshioka et al., 2004). Assuming a density of cm-3 (Fabian, 1994) and using the cooling function of Tozzi & Norman (2001), the cooling time of fossil groups is a few gigayears. The densities are still higher at the center of the group potential, leading to faster cooling times, less than the formation time of simulated fossil groups. There is evidence in at least one fossil group of a decrease in temperature towards the center of the X-ray profile (Vikhlinin et al., 1999), although this could also be evidence of cooler gas originating from the interstellar medium of the central galaxy (Mulchaey & Zabludoff, 1998). We note that Jetha et al. (2009) are investigating the role of cooling flows in a similar sample of fossil group candidates.
We cannot rule out other possibilities for sustaining an AGN including minor mergers. It is inconclusive whether minor mergers with dwarf galaxies may be substantial to fuel the central engine in other active galaxies such as Seyferts (e.g. De Robertis et al. 1998; Corbin 2000) and they have yet to be investigated as a fuel source in radio-loud AGN. This is worth investigating in fossil groups as (1) although Seyferts are identified in the optical, they harbor low luminosity radio AGN and (2) fossil groups are known to have a reservoir of nearby dwarf galaxies as shown by their luminosity functions (Mendes de Oliveira et al., 2006; La Barbera et al., 2009a). The conclusions of Santos et al. (2007) and von Benda-Beckmann et al. (2008) are that at recent times, the dominant elliptical galaxy in a fossil group grows only through minor mergers.
Alternatively, if H I from primordial origins or past gas rich mergers can exist in the group environment for a long time, accretion of these clouds on to the supermassive blackhole may account for long lived radio AGN activity. H I has been detected in absorption against the radio continuum of compact central objects in a number of early type radio galaxies (e.g. Jackson et al. 2003; Morganti et al. 2009 and references therein). Further, H I may be present in emission in up to 50-75% of all early-type galaxies (van Gorkom & Schiminovich, 1997; Morganti, 2006), and in more than 25% of nearby radio galaxies (Emonts et al., 2006). These systems may have undergone a major merger several gigayears ago, such that the current episode of radio AGN activity is significantly delayed having started very late in the lifetime of the merger, or else is unrelated to merger completely.
5 Conclusions
We present the first systematic survey of fossil galaxy group candidates at radio wavelengths using one of the largest collection of uniformly identified sources in the literature (Santos et al., 2007). With updated photometric and spectroscopic optical data from SDSS DR7, we find 30 of these 33 candidates are fossil groups and that 67% of them are detected at 1.4 GHz down to an average rms noise of 80 Jy. All but one fossil group detection are radio-loud sources. This is a large fraction considering fossil groups were believed a priori to be old, quiescently evolving galaxy systems. However, it is consistent with previous studies that correlate a rise in the fraction of radio-loud AGN with a rise in the stellar mass of the host galaxy (Best et al., 2005). We find that MKW/AWM poor clusters (Morgan et al., 1975; Albert et al., 1977) may be an excellent sample, spanning a range of mag between the first- and second-ranked galaxies, against which to compare fossil groups to further understand the history of their mass assembly.
The high AGN frequency in fossil groups is most likely not directly related to their unique formation history given the prevalence of radio sources among X-ray selected samples of elliptical galaxies and non-fossil groups (Croston et al., 2005; Dunn et al., 2010) and the short radiative lifetime of synchrotron emission at 1.4 GHz compared to the simulated formation time scale of fossil groups (D’Onghia et al., 2005; von Benda-Beckmann et al., 2008). We find a weak trend between the radio and X-ray luminosities of fossil groups, but no trend between the radio and optical properties of the central elliptical galaxy. However, when we include the brightest group galaxy from a sample of X-ray selected elliptically dominated groups, we find both radio–X-ray and radio–optical correlations such that fossil groups are more luminous at all three wavelengths than non-fossil groups. Thus, if optical luminosity represents the mass assembly history, and the X-ray halo represents the group-sized dark matter halo in which the galaxy resides, then when an AGN is “on”, its radio strength is related to the environment in which it resides.
The dominant elliptical galaxy in a fossil group resides at the center of group gravitational potential revealed by the presence of an extended X-ray halo. In such an environment, the nuclear activity may tied to the thermodynamic state of the hot IGM gas and a cooling flow may both fuel and be regulated by the AGN. However, there is not yet direct evidence of a cooling flow in these systems. Deep follow-up imaging of the central galaxies at optical and radio wavelengths is required to exclude the possibility of recent mergers or the existence of nearby cold gas reservoirs that can fuel the central engine. Finally, fossil groups by definition harbor a population of nearby dwarf galaxies; it is unknown to what degree minor mergers contribute to feeding the black hole and the signatures may be difficult to detect. It is clear that fossil groups are not only an interesting study of mass assembly in the early Universe, but also as a source of accretion and feedback with the IGM in the present day: their isolation provides a relatively simplified environment in which to study these processes.
References
- Albert et al. (1977) Albert, C. E., White, R. A., & Morgan, W. W. 1977, ApJ, 211, 309
- Alonso et al. (2007) Alonso, M. S., Lambas, D. G., Tissera, P., & Coldwell, G. 2007, MNRAS, 375, 1017
- Becker et al. (1995) Becker, R. H., White, R. L., & Helfand, D. J. 1995, ApJ, 450, 559
- Beuing et al. (1999) Beuing, J., Dobereiner, S., Bohringer, H., & Bender, R. 1999, MNRAS, 302, 209
- Best (2004) Best, P. N. 2004, MNRAS, 351, 70
- Best et al. (2005) Best, P. N., Kauffmann, G., Heckman, T. M., et al. 2005, MNRAS, 362, 25
- Best et al. (2007) Best, P. N., von der Linden, A., Kauffmann, G., Heckman, T. M., & Kaiser, C. R. 2007, MNRAS, 379, 894
- Bîrzan et al. (2004) Bîrzan, L., Rafferty, D. A., McNamara, B. R., Wise, M. W., & Nulsen, P. E. J. 2004, ApJ, 607, 800
- Brüggen & Kaiser (2002) Brüggen, M., & Kaiser, C. R. 2002, Nature, 418, 301
- Burns et al. (1980) Burns, J. O., White, R. A., & Hanisch, R. J. 1980, AJ, 85, 191
- Burns et al. (1981) Burns, J. O., White, R. A., & Hough, D. H. 1981, AJ, 86, 1
- Cisternas et al. (2011) Cisternas, M., Jahnke, K., Inskip, K. J., et al. 2011, ApJ, 726, 57
- Condon et al. (1998) Condon, J. J., Cotton, W. D., Greisen, E. W., Yin, Q. F., Perley, R. A., Taylor, G. B., & Broderick, J. J. 1998, AJ, 115, 1693
- Corbin (2000) Corbin, M. R. 2000, ApJ, 536, L73
- Croston et al. (2005) Croston, J. H., Hardcastle, M. J., & Birkinshaw, M. 2005, MNRAS, 357, 279
- Dariush et al. (2010) Dariush, A. A., Raychaudhury, S., Ponman, T. J., Khosroshahi, H. G., Benson, A. J., Bower, R. G., & Pearce, F. 2010, MNRAS, 405, 1873
- David et al. (1994) David, L. P., Jones, C., Forman, W., & Daines, S. 1994, ApJ, 428, 544
- David et al. (2001) David, L. P., Nulsen, P. E. J., McNamara, B. R., et al. 2001, ApJ, 557, 546
- De Robertis et al. (1998) De Robertis, M. M., Yee, H. K. C., & Hayhoe, K. 1998, ApJ, 496, 93
- Díaz-Giménez et al. (2008) Díaz-Giménez, E., Muriel, H., & Mendes de Oliveira, C. 2008, A&A, 490, 965
- D’Onghia et al. (2005) D’Onghia, E., Sommer-Larsen, J., Romeo, A. D., Burkert, A., Pedersen, K., Portinari, L., & Rasmussen, J. 2005, ApJ, 630, L109
- Dunn et al. (2010) Dunn, R. J. H., Allen, S. W., Taylor, G. B., Shurkin, K. F., Gentile, G., Fabian, A. C., & Reynolds, C. S. 2010, MNRAS, 404, 180
- Eigenthaler & Zeilinger (2009) Eigenthaler, P., & Zeilinger, W. W. 2009, Astronomische Nachrichten, 330, 978
- Emonts et al. (2006) Emonts, B. H. C., Morganti, R., Oosterloo, T. A., van der Hulst, J. M., Tadhunter, C. N., van Moorsel, G., & Holt, J. 2006, Astronomische Nachrichten, 327, 139
- Fabian (1994) Fabian, A. C. 1994, ARA&A, 32, 277
- Fabian et al. (2001) Fabian, A. C., Sanders, J. S., Ettori, S., et al. 2001, MNRAS, 321, L33
- Fabian et al. (2003) Fabian, A. C., Sanders, J. S., Allen, S. W., Crawford, C. S., Iwasawa, K., Johnstone, R. M., Schmidt, R. W., & Taylor, G. B. 2003, MNRAS, 344, L43
- Fukugita et al. (1995) Fukugita, M., Shimasaku, K., & Ichikawa, T. 1995, PASP, 107, 945
- Heinz et al. (2006) Heinz, S., Brüggen, M., Young, A., & Levesque, E. 2006, MNRAS, 373, L65
- Helsdon & Ponman (2003) Helsdon, S. F., & Ponman, T. J. 2003, MNRAS, 340, 485
- Jackson et al. (2003) Jackson, N., Beswick, R., Pedlar, A., Cole, G. H., Sparks, W. B., Leahy, J. P., Axon, D. J., & Holloway, A. J. 2003, MNRAS, 338, 643
- Jetha et al. (2009) Jetha, N. N., Khosroshahi, H., Raychaudhury, S., Sengupta, C., & Hardcastle, M. 2009, American Institute of Physics Conference Series, 1201, 305
- Jones et al. (2000) Jones, L. R., Ponman, T. J., & Forbes, D. A. 2000, MNRAS, 312, 139
- Jones & Preston (2001) Jones, D. L., & Preston, R. A. 2001, AJ, 122, 2940
- Jones et al. (2003) Jones, L. R., Ponman, T. J., Horton, A., Babul, A., Ebeling, H., & Burke, D. J. 2003, MNRAS, 343, 627
- Khosroshahi et al. (2004) Khosroshahi, H. G., Jones, L. R., & Ponman, T. J. 2004, MNRAS, 349, 1240
- Khosroshahi et al. (2006) Khosroshahi, H. G., Ponman, T. J., & Jones, L. R. 2006, MNRAS, 372, L68
- Khosroshahi et al. (2007) Khosroshahi, H. G., Ponman, T. J., & Jones, L. R. 2007, MNRAS, 377, 595
- Kriss et al. (1983) Kriss, G. A., Cioffi, D. F., & Canizares, C. R. 1983, ApJ, 272, 439
- La Barbera et al. (2009a) La Barbera, F., de Carvalho, R. R., de la Rosa, I. G., Sorrentino, G., Gal, R. R., & Kohl-Moreira, J. L. 2009, AJ, 137, 3942
- Ledlow et al. (1996) Ledlow, M. J., Loken, C., Burns, J. O., Hill, J. M., & White, R. A. 1996, AJ, 112, 388
- Mamon (1987) Mamon, G. A. 1987, ApJ, 321, 622
- Marcum et al. (2004) Marcum, P. M., Aars, C. E., & Fanelli, M. N. 2004, AJ, 127, 3213
- Mendes de Oliveira et al. (2006) Mendes de Oliveira, C. L., Cypriano, E. S., & Sodré, L., Jr. 2006, AJ, 131, 158
- Mendes de Oliveira & Carrasco (2007) Mendes de Oliveira, C. L., & Carrasco, E. R. 2007, ApJ, 670, L93
- Méndez-Abreu et al. (2012) Méndez-Abreu, J., Aguerri, J. A. L., Barrena, R., et al. 2012, A&A, 537, A25
- Morgan et al. (1975) Morgan, W. W., Kayser, S., & White, R. A. 1975, ApJ, 199, 545
- Morganti (2006) Morganti, R. 2006, Astronomische Nachrichten, 327, 127
- Morganti et al. (2009) Morganti, R., Peck, A. B., Oosterloo, T. A., van Moorsel, G., Capetti, A., Fanti, R., Parma, P., & de Ruiter, H. R. 2009, A&A, 505, 559
- Mulchaey & Zabludoff (1998) Mulchaey, J. S., & Zabludoff, A. I. 1998, ApJ, 496, 73
- Nath & Roychowdhury (2002) Nath, B. B., & Roychowdhury, S. 2002, MNRAS, 333, 145
- Osmond & Ponman (2004) Osmond, J. P. F., & Ponman, T. J. 2004, MNRAS, 350, 1511
- Peterson et al. (2001) Peterson, J. R., Paerels, F. B. S., Kaastra, J. S., et al. 2001, A&A, 365, L104
- Ponman & Bertram (1993) Ponman, T. J., & Bertram, D. 1993, Nature, 363, 51
- Ponman et al. (1994) Ponman, T. J., Allan, D. J., Jones, L. R., Merrifield, M., McHardy, I. M., Lehto, H. J., & Luppino, G. A. 1994, Nature, 369, 462
- Rowley et al. (2004) Rowley, D. R., Thomas, P. A., & Kay, S. T. 2004, MNRAS, 352, 508
- Sadler et al. (2002) Sadler, E. M., Jackson, C. A., Cannon, R. D., et al. 2002, MNRAS, 329, 227
- Santos et al. (2007) Santos, W. A., Mendes de Oliveira, C., & Sodré, L., Jr. 2007, AJ, 134, 1551
- Schneider & Gunn (1982) Schneider, D. P., & Gunn, J. E. 1982, ApJ, 263, 14
- Schawinski et al. (2010) Schawinski, K., et al. 2010, ApJ, 711, 284
- Sun et al. (2004) Sun, M., Forman, W., Vikhlinin, A., Hornstrup, A., Jones, C., & Murray, S. S. 2004, ApJ, 612, 805
- Thomson & Wright (1990) Thomson, R. C., & Wright, A. E. 1990, MNRAS, 247, 122
- Ulmer et al. (2005) Ulmer, M. P., et al. 2005, ApJ, 624, 124
- Tozzi & Norman (2001) Tozzi, P., & Norman, C. 2001, ApJ, 546, 63
- Vikhlinin et al. (1999) Vikhlinin, A., McNamara, B. R., Hornstrup, A., Quintana, H., Forman, W., Jones, C., & Way, M. 1999, ApJ, 520, L1
- van Gorkom & Schiminovich (1997) van Gorkom, J., & Schiminovich, D. 1997, The Nature of Elliptical Galaxies; 2nd Stromlo Symposium, 116, 310
- von Benda-Beckmann et al. (2008) von Benda-Beckmann, A. M., D’Onghia, E., Gottlöber, S., Hoeft, M., Khalatyan, A., Klypin, A., Müller, V. 2008, MNRAS, 386, 2345
- Wise et al. (2007) Wise, M. W., McNamara, B. R., Nulsen, P. E. J., Houck, J. C., & David, L. P. 2007, ApJ, 659, 1153
- White et al. (1997) White, D. A., Jones, C., & Forman, W. 1997, MNRAS, 292, 419
- Yamagata & Maehara (1986) Yamagata, T., & Maehara, H. 1986, PASJ, 38, 661
- Yoshioka et al. (2004) Yoshioka, T., Furuzawa, A., Takahashi, S., Tawara, Y., Sato, S., Yamashita, K., & Kumai, Y. 2004, Advances in Space Research, 34, 2525
| Group | r-Band | r-Band | LX (0.5-2 keV) | L1.4GHz | 1.4 GHz rms | Radio Extent | ||||
|---|---|---|---|---|---|---|---|---|---|---|
| IDaaFrom Santos et al. (2007) | NameaaFrom Santos et al. (2007) | z | Mag | Abs Mag | mag | ( ergs s-1)aaFrom Santos et al. (2007) | (W Hz-1) | (Jy beam-1) | (arcsec) | Notes |
| 1 | J015021.27-100530.5 | 0.365 | 17.26 | -24.85 | 2.41 | 1.44E+44 | 2.61E+23 | 87 | 7.8 | 1; point source |
| 2 | J015241.95+010025.5 | 0.230 | 15.72 | -24.95 | 2.76 | 1.51E+44 | (5.96e+22) | 74 | ||
| 3 | J075244.19+455657.3 | 0.052 | 14.46 | -22.64 | 2.09 | 5.62E+42 | 4.43E+24 | 177 | 57.0 | 2; large bipolar jets |
| 4 | J080730.75+340041.6 | 0.208 | 16.38 | -24.05 | 2.41 | 4.21E+43 | 1.55E+24 | 59 | 6.9 | 3; bipolar jets |
| 5 | J084257.55+362159.2 | 0.282 | 16.79 | -24.52 | 1.87 | 2.95E+44 | 4.50E+23 | 72 | 8.1 | 4; extended pt src |
| 6 | J084449.07+425642.1 | 0.054 | 14.08 | -22.97 | 2.04 | 2.11E+42 | 2.13E+23 | 420 | 21.0 | 5; asymmetric fuzzy |
| 7 | J090303.18+273929.3 | 0.489 | 18.06 | -25.19 | 2.84 | 1.74E+44 | (2.87e+23) | 79 | ||
| 8 | J094829.04+495506.7 | 0.409 | 18.21 | -24.22 | 2.36 | 6.26E+43 | 9.28E+22 | 48 | ||
| 9 | J104302.57+005418.2 | 0.125 | 15.98 | -23.16 | 2.86 | 4.99E+43 | 2.47E+24 | 120 | 21 | 6; background galaxy |
| 10 | J105452.03+552112.5 | 0.468 | 17.69 | -25.30 | 2.67 | 1.17E+44 | 3.88E+25 | 65 | 9.3 | 7; point source |
| 12 | J112155.27+104923.2 | 0.240 | 16.97 | -23.84 | 2.20 | 3.85E+43 | 1.11E+24 | 57 | 11.0 | 8; elongated pt src |
| 13 | J114128.29+055829.5 | 0.188 | 16.03 | -24.11 | 2.09 | 2.19E+43 | 2.94E+24 | 119 | 9.1 | 9; extended pt src |
| 14 | J114647.57+095228.1 | 0.221 | 16.36 | -24.24 | 2.06 | 4.93E+43 | 1.74E+24 | 78 | 22.0 | 10; two fuzzy sources |
| 15 | J114803.81+565425.6 | 0.105 | 16.49 | -22.08 | 1.87 | 1.04E+43 | 1.32E+23 | 29 | 11.7 | 11; asym jet & bkgrd QSO |
| 16 | J114915.02+481104.9 | 0.283 | 17.60 | -23.66 | 1.03 | 6.10E+43 | (3.89e+22) | 32 | ||
| 17 | J124742.07+413137.6 | 0.155 | 15.88 | -23.70 | 2.13 | 6.25E+42 | 2.92E+23 | 58 | 6.0 | 12; point source |
| 18 | J130009.36+444301.3 | 0.233 | 16.88 | -23.80 | 2.50 | 2.63E+43 | (5.39e+22) | 65 | ||
| 19 | J133559.98-033129.1 | 0.177 | 15.84 | -24.14 | 2.14 | 3.68E+43 | 6.48E+23 | 64 | 8.7 | 13; point source |
| 20 | J141004.19+414520.8 | 0.094 | 14.66 | -23.64 | 2.22 | 2.96E+42 | 5.61E+22 | 58 | 7.0 | 14; point source |
| 21 | J144516.86+003934.2 | 0.306 | 17.94 | -23.65 | 0.14 | 7.21E+43 | 3.32E+24 | 151 | 6.8 | 15; point source |
| 22 | J145359.01+482417.1 | 0.146 | 15.87 | -23.58 | 1.98 | 5.75E+42 | (5.44e+22) | 169 | ||
| 23 | J152946.28+440804.2 | 0.148 | 15.77 | -23.71 | 2.67 | 1.10E+43 | (2.48e+22) | 74 | ||
| 24 | J153344.13+033657.5 | 0.293 | 17.23 | -24.21 | 2.00 | 6.00E+43 | (7.29e+22) | 56 | ||
| 25 | J153950.78+304303.9 | 0.097 | 14.93 | -23.50 | 2.04 | 4.86E+43 | 5.12E+23 | 86 | 10.0 | 16; extended pt src |
| 26 | J154855.85+085044.3 | 0.072 | 13.50 | -24.25 | 1.26 | 5.09E+42 | (1.02e+22) | 129 | ||
| 27 | J161431.10+264350.3 | 0.184 | 15.76 | -24.36 | 2.84 | 2.37E+43 | (6.65e+22) | 130 | ||
| 28 | J163720.51+411120.2 | 0.032 | 14.51 | -21.25 | 4.10 | 4.16E+41 | (1.45e+21) | 93 | ||
| 29 | J164702.07+385004.2 | 0.135 | 16.13 | -23.09 | 2.02 | 6.87E+42 | 4.06E+23 | 87 | 12.0 | 17; extended fuzzy |
| 30 | J171811.93+563956.1 | 0.114 | 15.27 | -23.55 | 2.01 | 4.67E+43 | 1.77E+24 | 81 | 11.0 | 18; extended pt src |
| 31 | J172010.03+263732.0 | 0.159 | 15.44 | -24.33 | 2.10 | 1.77E+44 | 5.73E+24 | 69 | 35.0 | 19; extended halo |
| 32 | J172852.16+551640.8 | 0.148 | 16.72 | -22.81 | 1.83 | 3.53E+42 | (2.69e+22) | 81 | ||
| 33 | J225630.04-003210.8 | 0.224 | 16.81 | -23.91 | 2.20 | 2.18E+43 | 4.88E+23 | 74 | 11.0 | 20; extended pt src |
| 34 | J235815.10+150543.5 | 0.178 | 16.08 | -23.98 | 2.53 | 9.26E+42 | 8.02E+23 | 85 | 16.0 | 21; small bipolar jets |
Note. — †Sources previously detected in NVSS or FIRST. ∗Candidates fail optical criteria of fossil groups and are not considered in the analysis. Column (1) is the group ID number assigned by Santos et al. (2007). Column (2) is the SDSS name of the dominant elliptical galaxy (and follows the J2000 coordinates). Column (3) is the spectroscopic redshift. Column (4) is the SDSS r-band apparent magnitude retrieved from SDSS DR7. Column (5) is the SDSS r-band absolute magnitude, assuming , , and . Column (6) is the difference in magnitude between the first and second ranked galaxies. Column (7) is the X-ray 0.5-2 keV luminosity from ROSAT (Santos et al., 2007). Column (8) is the 1.4 GHz radio luminosity, when detected. Values in parenthesis are the 3 upper limits for non-detections. Column (9) is the rms noise achieved in the individually targeted 1.4 GHz observations presented in this paper. Column (10) includes notes on the radio detections and the corresponding panel in Figures 1 and 2.