A Spectroscopic Study of Type Ibc Supernova Host Galaxies
from Untargeted Surveys
Abstract
We present the first spectroscopic study of the host environments of Type Ibc supernovae (SN Ibc) discovered exclusively by untargeted SN searches. Past studies of SN Ibc host environments have been biased towards high-mass, high-metallicity galaxies by focusing on SNe discovered in galaxy-targeted SN searches. Our new observations more than double the total number of spectroscopic stellar population age and metallicity measurements published for untargeted SN Ibc host environments. For the 12 SNe Ib and 21 SNe Ic in our metallicity sample, we find median metallicities of and , respectively, but determine that the discrepancy in the full distribution of metallicities is not statistically significant. This median difference would correspond to only a small difference in the mass loss via metal-line driven winds (), suggesting this does not play the dominant role in distinguishing SN Ib and Ic progenitors. However, the median metallicity of the 7 broad-lined SN Ic (SN Ic-BL) in our sample is significantly lower, . The age of the young stellar population of SN Ic-BL host environments also seems to be lower than for SN Ib and Ic, but our age sample is small. Combining all SN Ibc host environment spectroscopy from the literature to date does not reveal a significant difference in SN Ib and Ic metallicities, but reinforces the significance of the lower metallicities for SN Ic-BL. This combined sample demonstrates that galaxy-targeted SN searches introduce a significant bias for studies seeking to infer the metallicity distribution of SN progenitors, and we identify and discuss other systematic effects that play smaller roles. We discuss the path forward for making progress on SN Ibc progenitor studies in the LSST era.
This paper includes data gathered with the 6.5 m Magellan Telescopes located at Las Campanas Observatory, Chile.
Subject headings:
supernovae: general — galaxies: abundances — surveys1. INTRODUCTION
Core-collapse supernovae show a diversity of absorption features in their spectra near maximum light, reflecting a diversity in the composition of the outer envelope of their massive star progenitors at the ends of their lives (Filippenko, 1997; Woosley et al., 2002). In particular, some SNe show no evidence of hydrogen (Type Ib) or no evidence for either hydrogen or helium (Type Ic), suggesting extensive mass loss in the progenitor star sufficient to complete stripping of the H and He layers of its outer envelope (Elias et al., 1985; Filippenko & Sargent, 1985; Wheeler & Levreault, 1985; Uomoto & Kirshner, 1985; Clocchiatti et al., 1996; Hachinger et al., 2012, but see also Dessart et al. 2012). Stellar evolutionary considerations point to two likely channels for these stripped-envelope core-collapse supernovae (Type Ibc supernovae).111Hereafter we use “SN Ibc” to refer to the class of stripped-envelope core-collapse supernovae generally. We define SN Ibc to include SNe of subtypes Ib, IIb, Ic, and Ic-BL. We use “SN Ib/c” to refer to supernovae whose spectroscopic type is uncertain, but likely to be one of the SN Ibc subtypes. These channels are: (i) high-mass Wolf-Rayet (WR) stars with strong metal line-driven winds with rotation likely playing an important role (Woosley et al., 1995; Georgy et al., 2012), and (ii) lower-mass helium-stars in close-binary systems who lose their envelopes via Roche lobe overflow or common envelope evolution (Podsiadlowski et al., 1992; Yoon et al., 2010; Dessart et al., 2011). Searches for the progenitor stars of SN Ibc in pre-explosion imaging have yet to yield a progenitor detection, but have provided upper limits that challenge the hypothesis that their progenitors are massive WR stars like those seen in the Local Group (Smartt, 2009).
By measuring the metallicity of the host environments of Type Ibc SNe as a proxy for the metallicity of the progenitor stars, we may be able to distinguish between these two progenitor models. Mass loss in WR stars is enhanced at high metallicity (Vink & de Koter, 2005). If the primary SN Ibc progenitor channel is single WR stars, then the rate of SN Ibc relative to SNe that show H features (SN II) would be enhanced at high metallicity (see e.g. Prantzos & Boissier 2003) and the ratio of SN Ic to Ib should similarly be higher. In binary progenitor systems, massive primary stars may still strip their envelopes primarily via WR winds, but there exists an additional channel for SN Ic to be produced by relatively low mass () stars which may dominate at low metallicity. This channel calls for the mass transfer to occur while the star is in the core helium burning or later phases (Yoon et al., 2010). Because either channel calls for massive, short-lived stars to produce the explosions, the metallicity of the SN host environment should be an appropriate proxy for the metallicity of the progenitor star.
Additionally, a connection has emerged between long-duration Gamma Ray Bursts (long GRBs) and one particular subtype of SN Ibc: broad-lined Type Ic SNe (Ic-BL; Kulkarni et al. 1998; see Woosley & Bloom 2006 for a review). The broad and highly blueshifted absorption features of SNe Ic-BL indicate high photospheric expansion velocities, km s-1 (Iwamoto et al., 1998). This GRB-SN connection can be explained by the gravitational collapse of a massive () progenitor star that produces a rapidly rotating and accreting compact object (central engine) that powers a relativistic outflow (the collapsar model, MacFadyen et al., 2001). However, radio observations demonstrate that only a small fraction () of SNe Ic-BL harbor relativistic outflows (Soderberg et al., 2006, 2010a). Because angular momentum loss due to metal line-driven winds could prevent the compact remnant from rotating fast enough to produce a relativistic outflow, a metallicity threshold () has been proposed for collapsars (Woosley & Heger, 2006).
Recent observations fundamentally challenge the role of metallicity in GRB production (Fryer et al., 2007). SN 2009bb provides an example of a SN Ic-BL produced in a super-solar metallicity environment and harboring a central engine (Levesque et al., 2010c; Soderberg et al., 2010a), and LGRBs with relatively high-metallicity host environments have now been identified (Levesque et al., 2010b; Graham et al., 2009). In contrast, SN 2010ay was a SN Ic-BL with extreme explosion properties that occurred in a sub-solar metallicity environment and without evidence for a central engine (Sanders et al. 2011; see also SN 2007bg, Young et al. 2010).
In the past few years, several observational studies have sought to measure the characteristics of the host environments of SN Ibc. Prieto et al. (2008) used SDSS spectroscopy to study the metallicity distribution of 115 SNe (19 SN Ibc) and found that SN Ibc host environments are metal-enriched compared to those of SN II. Extending the work of Prantzos & Boissier (2003), Boissier & Prantzos (2009) reach a similar result using SDSS photometry to estimate metallicities for 701 SN (98 SN Ibc) host galaxies. Arcavi et al. (2010) examine the host galaxies of core-collapse SNe discovered by the Palomar Transient Factory (PTF) and find that SN Ic are more common in high-metallicity environments (“giant” host galaxies, mag), while SN Ib, IIb and Ic-BL dominate in low-metallicity environments (“dwarf” host galaxies). Anderson et al. (2010) and Leloudas et al. (2011) perform spectroscopy to measure the metallicity of the host environments of 28 and 20 SN Ibc, respectively, finding no statistically significant difference between the metallicity distribution of SN Ib and Ic. Extending the work of Modjaz et al. (2008), Modjaz et al. (2011) performed a similar spectroscopy study of 35 SN Ibc host environments, finding that SN Ic come from significantly higher-metallicity host environments than SN Ib, with SN Ic-BL falling in between. Following Kelly et al. (2008), Kelly & Kirshner (2011) have examined SDSS spectroscopy of 519 SNe (67 SN Ibc), finding that SN Ic-BL preferentially occur in low-mass, low-metallicity host galaxies relative to other core-collapse SNe.
However, there is a prominent observational bias that affects the progenitor metallicity distribution inferred from observations of most known SN host galaxies. The well-known relation between the luminosity and global-metallicity of star-forming galaxies (the relation, see e.g. Tremonti et al., 2004) indicates that a metallicity distribution measured only from objects found in targeted SN searches, which look for transients in fields centered on nearby and luminous galaxies, will be biased towards high metallicities.
Here we describe a new spectroscopic study of SN Ibc host galaxy metallicities unbiased with respect to the relation. We have obtained spectra of 60 host environments of SN Ibc discovered only by untargeted transient searches (13 SNe Ib, 10 SNe IIb, 24 SNe Ic, 8 SNe Ic-BL, 3 of indeterminate type SN Ib/c, and 2 with AGN-dominated host environments, Section 2.3). Previous spectroscopic studies of SN Ibc host environments have included relatively few SNe discovered by untargeted searches, totaling objects. Our study doubles the existing sample of host environment spectroscopy for untargeted SN Ibc, offering considerable constraining power for inferring the metallicity distribution of the parent population.
In Section 2 we describe the characteristics of this sample, our optical observations, and our spectroscopic methodology. We present and analyze the host galaxy metallicities and other physical properties derived from these observations in Section 3 and combine with previous spectroscopic surveys of SN Ibc host environments in Section 4. In Section 5 we discuss possible systematics affecting our results. In Section 6 we discuss our results in relation to SN Ibc progenitor models and the SN-GRB connection and we suggest implications for future studies of SN Ibc. We conclude in Section 7.
2. SAMPLE CONSTRUCTION
2.1. SN sample
We have observed the host galaxies of 60 SNe Ibc reported in the International Astronomical Union Circulars (IAUCs)222f1.html and/or Astronomer’s Telegrams333http://www.astronomerstelegram.org/ between 1990-2011. When transient searches operate by returning repeatedly to a pre-selected, typically bright, set of galaxies, we refer to the SNe found in those galaxies by those searches to be “targeted.” We refer to any SN discovered by other means as “untargeted,” including discoveries by wide-field optical surveys, SNe identified by targeted searches in anonymous background galaxies, and SNe discovered serendipitously during observations of unrelated objects. We observed only untargeted discoveries and prioritized those SNe with reliable classifications, host galaxies which did not already have previously published metallicity measurements, and which were visible at low airmass during the time of our observations.
In total, we present optical spectroscopy with S/N sufficient for metallicity measurements for 50 host galaxies, with median redshift . The discoverer of each SN in our sample is listed in Table 1. Spectroscopic metallicity estimates have been previously published for only 15 of these galaxies. A comparison to previous spectroscopic studies of SN Ibc host environments is presented in Section 4.1; additionally, the host environment of SN 2009jf was previously studied by Valenti et al. (2011) (see also Sahu et al., 2011).
| SN | TypeaaA detailed discussion of SN classification is given in Section 2. | SamplebbG indicates the Gold sample and S indicates the Silver sample, as defined according to security of spectroscopic classification in Section 2. | Slit width (kpc)ccThe size of the spectroscopic slit (see Table 2) in physical units at the distance of the SN. | DiscovererddReference for the discovery of the supernova. Acronyms for untargeted SN searches are as follows: Catalina Real-time Transient Survey (CRTS; Drake et al., 2009a), the Equation of State: SupErNovae trace Cosmic Expansion program (ESSENCE; Miknaitis et al., 2007), the La Silla-QUEST Variability Survey (LSQ; Hadjiyska et al., 2011), the Palomar Transient Factory (PTF; Law et al., 2009), the Sloan Digital Sky Survey-II Supernova Survey (SDSS; Frieman et al., 2008), and the Nearby Supernova Factory (SNF, including supernovae discovered by NEAT; Aldering et al., 2002). Some objects were discovered serendipitously in background galaxies during targeted SN searches or other wide-field surveys, including the CHilean Automatic Supernova sEarch (CHASE; Pignata et al., 2009) and the Lick Observatory Supernova Search (LOSS; Li et al., 2011). | ClassificationeeReference for spectroscopic classification of SN type. Author names refer to private communications with observers who performed spectroscopy of the SN. “S.” indicates our own spectroscopy. | |
|---|---|---|---|---|---|---|
| 1991R | Ibc | S | 0.035 | 0.7 | McNaught & McKenzie (1991) | Leibundgut et al. (1991) |
| 2002ex | Ib | G | 0.037 | 1.1 | SNF | S. |
| 2002gz | IIb-pec | S | 0.085 | 1.1 | SNF | Hamuy et al. (2003) |
| 2003ev | Ic | G | 0.024 | 0.5 | LOSS | Filippenko & Chornock (2003) |
| 2004cf | Ib | S | 0.248 | 5.8 | Riello et al. (2004b) | M. T. Botticella |
| 2004ib | Ic | G | 0.056 | 1.1 | SDSS | G. Leloudas |
| 2005hm | Ib | G | 0.034 | 1.0 | SDSS | Leloudas et al. (2011) |
| 2005nb | Ic-BL | G | 0.024 | 0.5 | Quimby et al. (2006) | Modjaz et al. (2011) |
| 2006ip | Ic | G | 0.031 | 0.6 | SNF | Modjaz et al. (2011) |
| 2006ir | Ic | G | 0.021 | 0.4 | SNF | Leloudas et al. (2011) |
| 2006jo | Ib | G | 0.077 | 1.4 | SDSS | Leloudas et al. (2011) |
| 2006lc | Ib | G | 0.016 | 0.3 | SDSS | Blondin et al. (2006) |
| 2006nx | Ic-BL | G | 0.137 | 2.4 | SDSS | Modjaz et al. (2011) |
| 2006tq | Ic | S | 0.261 | 3.0 | ESSENCE | Challis et al. (2007)ffAdditionally, private communication with S. Blondin (2012) indicates that the classification spectrum for SN 2006tq is not of S/N sufficient for the Gold sample. |
| 2007I | Ic-BL | G | 0.022 | 0.4 | LOSS | Modjaz et al. (2011) |
| 2007az | Ib | G | 0.035 | 1.0 | LOSS | Silverman et al. (2007) |
| 2007br | IIb | G | 0.053 | 1.0 | SNF | R. Thomas |
| 2007ce | Ic-BL | S | 0.046 | 0.9 | Quimby et al. (2007) | Odewahn & Terrazas (2007) |
| 2007db | Ic | G | 0.048 | 0.7 | SNF | R. Thomas |
| 2007ea | IIb | G | 0.040 | 0.8 | SNF | R. Thomas |
| 2007ff | Ic | S | 0.049 | 0.7 | SNF | R. Thomas |
| 2007gg | Ib | G | 0.038 | 0.8 | SNF | R. Thomas |
| 2007gl | Ic | G | 0.028 | 0.4 | SNF | R. Thomas |
| 2007hb | Ic | G | 0.021 | 0.4 | SNF | R. Thomas |
| 2007hl | Ic | S | 0.056 | 1.1 | SNF | R. Thomas |
| 2007hn | Ic | G | 0.028 | 0.6 | SNF | Leloudas et al. (2011) |
| 2008ao | Ic | G | 0.015 | 0.3 | Dimai (2008) | Steele et al. (2008) |
| 2008fi | IIb | G | 0.026 | 0.5 | Skvarc & Mikuz (2008) | Silverman et al. (2008) |
| 2008gc | Ib | G | 0.049 | 0.7 | CHASE | Stritzinger et al. (2008a) |
| 2008ik | Ic | G | 0.064 | 0.9 | CHASE | Stritzinger et al. (2008b) |
| 2008im | Ib | G | 0.008 | 0.2 | Oksanen (2008) | S. |
| 2008iu | Ic-BL | S | 0.130 | 1.6 | CRTS | Drake et al. (2009b) |
| 2009hu | Ib | G | 0.117 | 2.1 | Sand et al. (2009) | Sand et al. (2009) |
| 2009jf | Ib | G | 0.008 | 0.1 | LOSS/PTF | Valenti et al. (2011) |
| 2009nl | Ic | G | 0.113 | 1.8 | CRTS | A. Drake |
| 2010Q | Ic | G | 0.054 | 1.0 | CRTS | A. Drake |
| 2010ah | Ic-BL | G | 0.050 | 1.0 | PTF | Corsi et al. (2011) |
| 2010am | IIb | G | 0.020 | 0.4 | CRTS | Cenko et al. (2010) |
| 2010ay | Ic-BL | G | 0.067 | 1.3 | CRTS | Sanders et al. (2011) |
| 2010cn | Ib/IIb-pec | G | 0.026 | 0.5 | CHASE | ggVarying spectroscopic classifications of SN 2010cn are reported by Marion et al. (2010); Silverman et al. (2010); Folatelli & Stritzinger (2010); we consider it a SN IIb for the purposes on our anaalysis. |
| 2010lz | Ic | G | 0.090 | 1.2 | CRTS | A. Drake |
| 2011D | IIb | G | 0.023 | 0.3 | CRTS | Marion et al. (2011) |
| 2011V | IIb | G | 0.014 | 0.3 | CRTS | Milisavljevic et al. (2011) |
| 2011bv | IIb | G | 0.072 | 1.0 | CRTS | Prieto (2011) |
| 2011cs | Ic | G | 0.101 | 1.8 | CRTS | Drake et al. (2011b) |
| 2011gh | Ib/c | S | 0.018 | 0.4 | CRTS | Magill et al. (2011) |
| 2011hw | Ibn | G | 0.021 | 0.4 | Dintinjana et al. (2011) | Smith et al. (2012) |
| 2011ip | Ic | S | 0.051 | 1.0 | Denisenko et al. (2011) | S., S. Valenti |
| 2011it | Ic | G | 0.016 | 0.3 | Ciabattari et al. (2011) | S. |
| LSQ11JW | Ib | G | 0.020 | 0.4 | LSQ | S. |
| PTF09dfk | Ib | G | 0.016 | 0.2 | PTF | A. Gal-Yam |
| PTF09dxv | IIb | G | 0.032 | 0.4 | PTF | A. Gal-Yam |
| PTF09iqd | Ic | G | 0.034 | 0.7 | PTF | A. Gal-Yam |
| PTF09q | Ic | G | 0.090 | 1.7 | PTF | A. Gal-Yam |
| PTF10aavz | Ic-BL | G | 0.063 | 0.9 | PTF | S. |
| PTF10bip | Ic | G | 0.051 | 1.0 | PTF | A. Gal-Yam |
| PTF10vgv | Ic | G | 0.015 | 0.3 | PTF | Corsi et al. (2012) |
| PTF11hyg | Ic | G | 0.028 | 0.6 | PTF | A. Gal-Yam |
| SN | SN | SN | Date (UT) | Instrument | DisperseraaThe grism or grating used in the spectroscopic observation. When multiple configurations were used, we list both, separated with a slash. | Exp. time (s)bbThe exposure time of the spectroscopic observations. When two times are given separated by a slash, they correspond to two different dispersers. | Slit width | E/NccE indicates a slit position on the SN explosion site, N indicates slit placement at the galaxy center (see Section 2.2) |
|---|---|---|---|---|---|---|---|---|
| 1991DddObjects excluded from the sample due to AGN contamination; see Section 2.3. | 13:41:13.58 | -14:38:47.6 | 2008 May 30 | LDSS3 | VPH_All | 600 | E | |
| 1991R | 15:54:53.52 | +19:00:43.9 | 2008 May 30 | LDSS3 | VPH_All | 600 | E | |
| 2002ex | 22:09:00.79 | –10:36:25.8 | 2008 June 29 | LDSS3 | VPH_Blue/Red | 1200/1020 | E | |
| 2002gz | 02:34:10.36 | –00:53:18.2 | 2008 June 29 | IMACS | 300-17.5 | 1200 | E | |
| 2003ev | 13:10:31.80 | –21:39:49.6 | 2008 June 1 | LDSS3 | VPH_All | 900 | E | |
| 2003jpddObjects excluded from the sample due to AGN contamination; see Section 2.3. | 23:26:03.28 | -08:59:22.7 | 2007 Dec. 17 | LDSS3 | VPH_All | 600 | N | |
| 2004cf | 14:11:05.77 | –11:44:09.4 | 2006 June 30 | LDSS3 | VPH_Red | 1800 | N | |
| 2004ib | 02:40:56.40 | –00:10:48.3 | 2007 Dec. 16 | LDSS3 | VPH_All | 1200 | E | |
| 2005hm | 21:39:00.65 | –01:01:38.7 | 2006 June 30 | LDSS3 | VPH_Blue/Red | 2100/1500 | E | |
| 2005nb | 12:13:37.61 | +16:07:16.2 | 2008 May 31 | LDSS3 | VPH_All | 415 | E | |
| 2006ip | 23:48:31.68 | –02:08:57.3 | 2007 Dec. 16 | LDSS3 | VPH_All | 1200 | N | |
| 2006ir | 23:04:35.68 | +07:36:21.5 | 2007 Dec. 14 | LDSS3 | VPH_All | 1200 | E | |
| 2006jo | 01:23:14.72 | –00:19:46.7 | 2006 Dec. 24 | LDSS3 | VPH_Blue/Red | 1000/600 | N | |
| 2006lc | 22:44:24.48 | –00:09:53.5 | 2007 Dec. 14 | LDSS3 | VPH_All | 900 | N | |
| 2006nx | 03:33:30.63 | –00:40:38.2 | 2006 Dec. 24 | LDSS3 | VPH_Blue/Red | 1500/750 | N | |
| 2006tq | 02:10:00.70 | +04:06:00.9 | 2012 Jan. 18 | LDSS3 | VPH_ALL | 1200 | N | |
| 2007I | 11:59:13.15 | –01:36:18.9 | 2008 Jan. 17 | LDSS3 | VPH_All | 1800 | N | |
| 2007az | 08:25:23.80 | +69:54:29.4 | 2011 Dec. 24 | BC | 300GPM | 1200 | E | |
| 2007br | 11:15:39.93 | –04:22:47.8 | 2007 Dec. 14 | LDSS3 | VPH_All | 1200 | N | |
| 2007ce | 12:10:17.96 | +48:43:31.5 | 2012 Jan. 01 | BC | 300GPM | 1800 | E | |
| 2007db | 11:17:10.30 | –06:11:48.6 | 2007 Dec. 15 | LDSS3 | VPH_All | 900 | N | |
| 2007ea | 15:53:46.27 | –27:02:15.5 | 2008 May 30 | LDSS3 | VPH_All | 1200 | E | |
| 2007ff | 01:24:10.24 | +09:00:40.5 | 2007 Dec. 17 | LDSS3 | VPH_All | 1200 | N | |
| 2007gg | 00:28:12.51 | +00:07:04.8 | 2011 Sep. 06 | BC | 300GPM | 1200 | E | |
| 2007gl | 01:05:50.11 | +00:08:41.3 | 2011 Sep, 21 | IMACS | 300-17.5 | 1200 | E | |
| 2007hb | 05:02:01.28 | –21:07:55.1 | 2011 Nov. 19 | IMACS | 300-17.5 | 600 | E | |
| 2007hl | 20:50:07.76 | –01:58:36.4 | 2008 May 30 | LDSS3 | VPH_All | 900 | E | |
| 2007hn | 21:02:46.85 | –04:05:25.2 | 2008 May 30 | LDSS3 | VPH_All | 600 | N | |
| 2008ao | 03:07:46.66 | +38:22:06.2 | 2012 Jan. 01 | BC | 300GPM | 1800 | E | |
| 2008fi | 01:53:23.17 | +29:21:28.4 | 2012 Jan. 19 | BC | 300GPM | 1200 | E | |
| 2008gc | 02:10:36.63 | –53:45:59.5 | 2012 Jan. 18 | LDSS3 | VPH_All | 600 | E | |
| 2008ik | 03:36:09.54 | –35:13:00.7 | 2012 Jan. 20 | LDSS3 | VPH_All | 600 | E | |
| 2008im | 04:01:02.15 | +74:05:48.5 | 2011 Dec. 24 | BC | 300GPM | 500 | E | |
| 2008iu | 04:36:55.20 | –00:21:35.6 | 2011 Sep. 21 | IMACS | 300-17.5 | 1200 | E | |
| 2009hu | 14:53:29.82 | +18:35:31.1 | 2012 Jan. 01 | BC | 300GPM | 1800 | E | |
| 2009jf | 23:04:52.98 | +12:19:59.5 | 2011 Nov. 18 | IMACS | 300-17.5 | 600 | E | |
| 2009nl | 03:39:47.78 | –11:13:25.0 | 2011 Sep. 20 | IMACS | 300-17.5 | 1200 | E | |
| 2010Q | 10:26:27.11 | +39:01:50.9 | 2012 Jan. 18 | BC | 300GPM | 1800 | E | |
| 2010ah | 11:44:02.99 | +55:41:27.6 | $\dagger$$\dagger$Spectra acquired on 2011 May 06 and 2012 Jan. 18 were coadded. | BC | 300GPM | 1500+1200 | E | |
| 2010am | 09:33:01.75 | +15:49:08.8 | 2012 Jan. 01 | BC | 300GPM | 1800 | E | |
| 2010ay | 12:35:27.19 | +27:04:02.8 | 2010 Apr. 11 | GMOS | R400 | 1800 | E | |
| 2010cn | 11:04:06.57 | +04:49:58.7 | 2012 Jan. 18 | BC | 300GPM | 1200 | E | |
| 2010lz | 01:50:20.32 | -21:44:31.9 | 2012 Jan. 19 | LDSS3 | VPH_All | 1500 | E | |
| 2011D | 03:02:14.58 | +17:20:58.9 | 2011 Nov. 29 | IMACS | 300-17.5 | 500 | E | |
| 2011V | 09:27:38.76 | +28:47:27.2 | 2012 Jan. 01 | BC | 300GPM | 1800 | E | |
| 2011bv | 13:02:53.57 | –04:02:36.0 | 2012 Jan. 19 | LDSS3 | VPH_All | 1200 | E | |
| 2011cs | 12:08:01.08 | +49:13:33.0 | 2012 Jan. 19 | BC | 300GPM | 1500 | E | |
| 2011gh | 03:16:54.20 | +25:54:14.6 | 2012 Jan. 18 | BC | 300GPM | 600 | E | |
| 2011hw | 22:26:14.54 | +34:12:59.1 | 2011 Nov. 29 | BC | 300GPM | 600 | E | |
| 2011ip | 1:13:47.59 | -12:41:06.0 | 2011 Dec. 31 | BC | 300GPM | 1800 | E | |
| 2011it | 22:02:44.45 | +31:41:49.1 | 2011 Dec. 31 | BC | 300GPM | 600 | E | |
| LSQ11JW | 02:04:47.40 | +00:50:06.0 | 2011 Dec. 31 | BC | 300GPM | 1200 | E | |
| PTF09q | 12:24:50.11 | +08:25:58.8 | 2012 Jan. 18 | BC | 300GPM | 600 | E | |
| PTF09dfk | 23:09:13.42 | +07:48:15.4 | 2011 Sep. 21 | IMACS | 300-17.5 | 900 | E | |
| PTF09dxv | 23:08:34.73 | +18:56:13.7 | 2011 Nov. 18 | IMACS | 300-17.5 | 500 | N | |
| PTF09iqd | 02:35:23.23 | +40:17:08.7 | 2012 Jan. 18 | BC | 300GPM | 500 | N | |
| PTF10aavz | 11:20:13.36 | +03:44:45.2 | 2011 Jan. 13 | LDSS3 | VPH_All | 1200 | E | |
| PTF10bip | 12:34:10.52 | +08:21:48.5 | 2012 Jan. 01 | BC | 300GPM | 1800 | E | |
| PTF10vgv | 22:16:01.17 | +40:52:03.3 | 2011 Sep. 06 | BC | 300GPM | 1200 | E | |
| PTF11hyg | 23:27:57.34 | +08:46:38.0 | 2011 Sep. 06 | BC | 300GPM | 1200 | E |
For those SNe in our sample whose classification spectroscopy is not well discussed in the circulars or the literature, we confirm the spectroscopic classification by contacting the authors of the classification circular to re-evaluate their original spectra using e.g., the Supernova Identification tool (Blondin & Tonry, 2007) (see private communications in Table 1). We construct a “Gold” sample of 48 SNe for which the classification spectrum suggests a clear subtype (but see Section 5.3); a “Silver” sample of 10 SN where the classification is based on a spectrum with poor S/N. SNe where we are not able to distinguish between two sub-types are listed as ”Undetermined Ibc.” For the purposes of this study, we consider the peculiar object SN 2011hw (classified as Type Ibn; Smith et al. 2012) to be of indeterminate type, we consider SN 2006lc (whose He lines were weak) a Type Ib (Leloudas et al., 2011), and we group the peculiar Type IIb SNe 2002gz and 2010cn together with the other Type IIb SNe.
2.2. Spectroscopic Observations
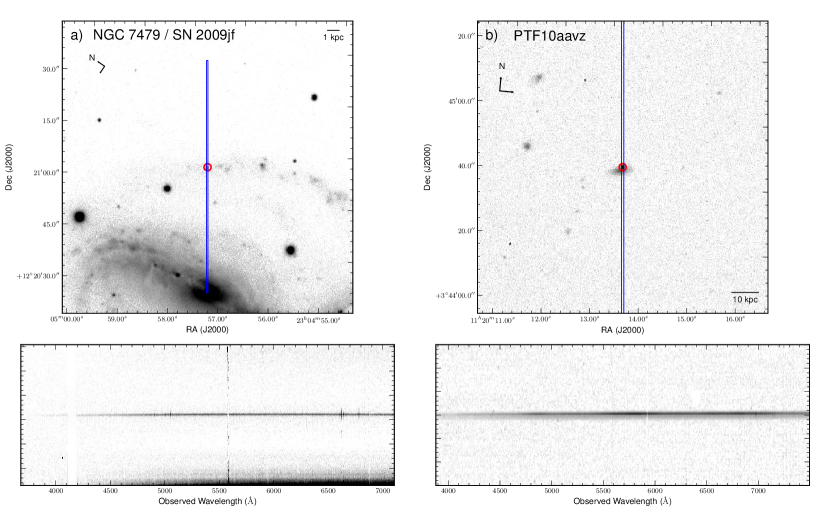
We obtained acquisition images in -band and long-slit spectra ( Å) of 25 SN Ibc host galaxies using the Low Dispersion Survey Spectrograph 3 (LDSS3) instrument on the Magellan-Clay Telescope, 23 using the BlueChannel Spectrograph (BC) on the MMT (for which there is no associated imager), 9 using the Inamori-Magellan Areal Camera & Spectrograph (IMACS) instrument on the Magellan-Baade Telescope, and 1 using the Gemini Multi-Object Spectrograph (GMOS) instrument on the Gemini-North Telescope. The host galaxies were observed at the parallactic angle, except for some IMACS spectra which were obtained with the atmospheric dispersion compensator.
When possible, the spectrum was extracted at the location of the SN explosion site within the host galaxy. We consider the spectrum to sample the explosion site (“E”; 43 SNe) when we extract at the position of the explosion site and the slit width corresponds to a physical size kpc ( for a 1˝ slit), and otherwise consider the spectrum nuclear (“N”; 15 SNe, see Table 2). Explosion site spectroscopy represents a luminosity-weighted average of the physical properties of the star-forming gas within the extracted region. However, because our SN sample consists of events discovered by galaxy-impartial surveys, the host galaxies are typically smaller and more distant than those observed in previous studies. In some cases, the explosion sites of SNe in the outskirts of their host galaxies did not have sufficient flux for spectroscopy and instead we extract at the galaxy nucleus. Some intrinsically-dim host galaxies have apparent sizes so small that a significant fraction of all the galaxy light will fall in the slit, even at relatively-low redshift (see Figure 1). For comparison, the explosion site spectroscopy of Modjaz et al. (2011) includes host galaxies at a maximum redshift of using a slit ( kpc) and the studies of Prieto et al. (2008) and Kelly & Kirshner (2011) employ SDSS fiber spectroscopy for SN Ibc at ( kpc) and 0.07 ( kpc), respectively.
2.3. Spectroscopic analysis
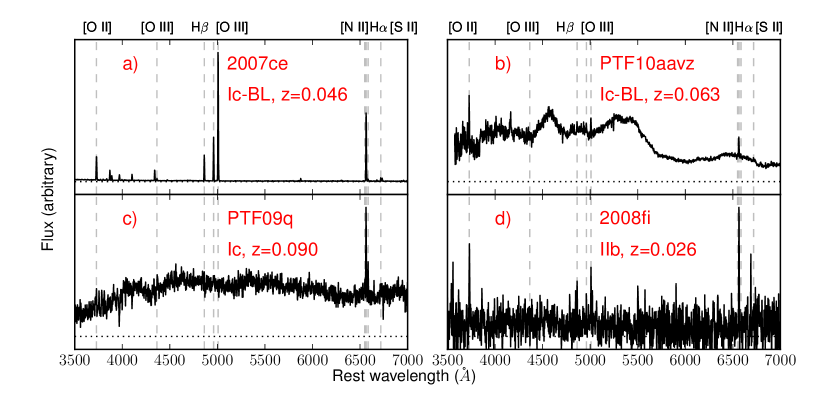
We employed standard two-dimensional long-slit image reduction and spectral extraction routines in IRAF444IRAF is distributed by the National Optical Astronomy Observatory, which is operated by the Association of Universities for Research in Astronomy (AURA) under cooperative agreement with the National Science Foundation.. Examples of reduced spectra are displayed in Figure 2.
The line fluxes of prominent nebular emission lines (H and H; [O II] 555The [O II] doublet is not resolved in these spectra, and we refer to the sum we effectively measure as [O II] ., [O III] , [O III] , [O III] , [N II] , 6584; and [S II] , 6731) were measured by fitting Gaussian functions to their profiles using a Markov Chain Monte Carlo (MCMC) technique (Patil et al., 2010). We fit the profiles to a wavelength range Å in width centered on the rest frame wavelength of each line. We fit a linear continuum to Å regions of the spectra off the wings of each line and use this continuum measurement to calculate equivalent widths for spectral lines. We constrain the amplitude of the Gaussian to be positive and fit a single redshift and line width for the set of Balmer lines and an independent redshift and width for the forbidden lines. We adopt the fitted redshift of the Balmer lines as the redshift of the host galaxy. We obtain estimates of the uncertainty in the line flux from the MCMC trace and require a detection confidence of 99%666Assuming a normal distribution, the 99% confidence interval corresponds to the requirement that the median value be greater than zero. Here we calculate as the difference between the 50th and 16th percentile values of the amplitude distribution in the MCMC trace..
The line fluxes measured for each host environment are presented in Table 3. We use observations of standard stars from the same night as the host environment observations to achieve relative flux calibration. No correction for underlying stellar absorption has been made, which could potentially affect the measurement of the Balmer line fluxes (particularly H) for galaxies with significant stellar continuum flux. Only 5 of 58 spectra (those of SN 2002ex, 2006ip, 2007I, 2007ff, and PTF10vgv) have stellar continuum levels that may indicate significant underlying absorption, and we therefore do not measure quantities that depend on H for these objects, including extinction ().
We tested for AGN contamination using a Baldwin et al. (1981) excitation-mechanism diagnostic diagram and the classification scheme of (Kauffmann et al., 2003). We found emission lines from the host galaxies to be consistent with typical star-forming galaxies with few exceptions. The host environments of SN 1991D and 2003jp were excluded from our sample (and all analysis below) due to significant AGN contamination that would bias certain metallicity diagnostics (Kewley & Ellison, 2008). We neglect the potential effects of AGN contamination for SN 2006jo (Type Ib) and PTF10xla (Ib/c), whose host environments show evidence for a composite classification. Some objects have supernova flux contamination (2010ay, 2011bv, 2011gh, 2011ip, LSQ11JW, PTF10aav), although the broad SN absorption features do not affect the measurement of the flux in the narrow galaxy emission lines.
3. HOST ENVIRONMENT PROPERTIES
From our optical spectra we measure the magnitude of dust extinction, metallicity, young stellar population ages, and Wolf-Rayet star populations of the host environments of the SN Ibc in our sample. We discuss each of these in the following sections.
3.1. Dust extinction
We estimate the line-of-sight extinction for each SN host galaxy spectrum (including both Galactic and intrinsic reddening) from the Balmer flux decrement. We assume , which corresponds to K and for Case B recombination (Osterbrock & Ferland, 2006). The extinction curve of Cardelli et al. (1989) was applied to correct individual line fluxes for reddening, assuming . The value of the extinction derived for each host galaxy is presented in Table 3.
| SN | [O II] | [O III] | H | [O III] | [O III] | [N II] | H | [N II] | [S II] | [S II] | |
|---|---|---|---|---|---|---|---|---|---|---|---|
| 3727 | 4363 | 4861 | 4959 | 5007 | 6548 | 6562 | 6584 | 6717 | 6731 | ||
| SN Type: IIb | |||||||||||
| 2007br | |||||||||||
| 2007ea | |||||||||||
| 2010am | |||||||||||
| 2010cn | |||||||||||
| 2011D | |||||||||||
| 2011V | |||||||||||
| PTF09dxv | |||||||||||
| SN Type: Ib | |||||||||||
| 2002ex | |||||||||||
| 2004cf | |||||||||||
| 2005hm | |||||||||||
| 2006jo | |||||||||||
| 2006lc | |||||||||||
| 2007az | |||||||||||
| 2007gg | |||||||||||
| 2008gc | |||||||||||
| 2009hu | |||||||||||
| 2009jf | |||||||||||
| LSQ11JW | |||||||||||
| PTF09dfk | |||||||||||
| SN Type: Ic | |||||||||||
| 2003ev | |||||||||||
| 2004ib | |||||||||||
| 2006ip | |||||||||||
| 2006ir | |||||||||||
| 2006tq | |||||||||||
| 2007db | |||||||||||
| 2007ff | |||||||||||
| 2007gl | |||||||||||
| 2007hb | |||||||||||
| 2007hl | |||||||||||
| 2007hn | |||||||||||
| 2008ao | |||||||||||
| 2008ik | |||||||||||
| 2009nl | |||||||||||
| 2010Q | |||||||||||
| 2011it | |||||||||||
| PTF09iqd | |||||||||||
| PTF09q | |||||||||||
| PTF10bip | |||||||||||
| PTF10vgv | |||||||||||
| PTF11hyg | |||||||||||
| SN Type: Ic-BL | |||||||||||
| 2005nb | |||||||||||
| 2006nx | |||||||||||
| 2007I | |||||||||||
| 2007ce | |||||||||||
| 2008iu | |||||||||||
| 2010ah | |||||||||||
| 2010ay | |||||||||||
| SN Type: Undetermined Ibc | |||||||||||
| 1991R | |||||||||||
| 2011gh | |||||||||||
| 2011hw | |||||||||||
Note. — has been derived from the Balmer decrement as described in the test, but fluxes reported here have not been dereddened. Fluxes are reported relative to H when possible; H or oxygen lines are used for normalization when necessary.
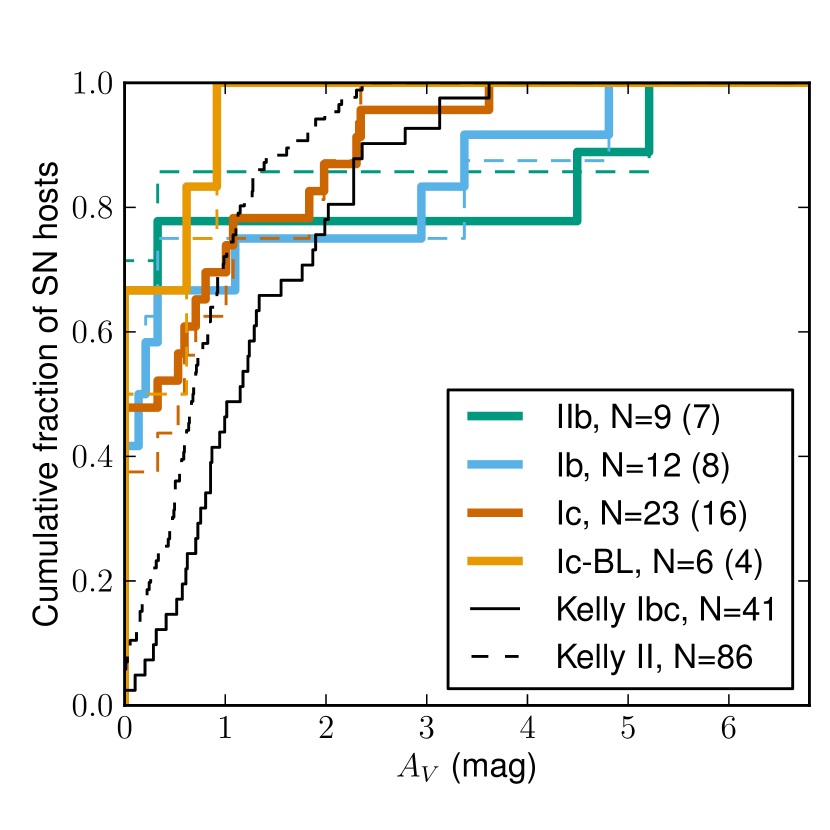
In Figure 3, we show the distribution of visual-band extinction () derived for the SN host environments from the Balmer decrement, for all spectra (solid lines) and for only explosion-site spectroscopy (dashed lines). Galactic extinction has been subtracted using the infrared dust map of Schlafly & Finkbeiner (2011). The difference introduced by restricting the sample to explosion sites is small.
Using the Kolmogorov-Smirnov (KS) test, we do not identify a statistical difference between the extinction distributions of SN Ib and Ic (with KS -value, ). Combining the 12 SN Ib and 23 SN Ic with measurements and subtracting Galactic extinction, the median and 14th and 86th percentile values () are mag. The median extinction values for the SN IIb and Ic-BL are consistent with 0, but given the small sample sizes ( and 6, respectively), the difference from the SN Ib+Ic distribution is not significant ().
In Figure 3 we also show the distribution measured by Kelly & Kirshner (2011) for SN II and for the combination of SN Ib and Ic. A consistent extinction distribution was estimated for 19 SN Ibc by Drout et al. (2011) based on light curve colors. For SN Ibc, Kelly & Kirshner (2011) find median and values of mag, with smaller values for SN II. We find values with a more extreme range, with some SNe having no measurable redenning and some as large as mag. This discrepancy is likely due to methodological differences. Because they employ SDSS fibers, Kelly & Kirshner (2011) probe gas in the nuclear region of the host galaxy, whereas most of our spectra are from the SN explosion site where the line of sight could be significantly different. However, in some cases the discovery magnitudes reported for the SNe do not allow for extinctions as large as we measure for the host environment777e.g. SN 2011D, discovered at mag by Narla et al. 2011, implying adopting the Balmer decrement extinction. This implies that the line of sight to the SN may be substantially different than that represented by the integrated light from the star forming gas we observe.
3.2. Metallicity Estimation
Host galaxy oxygen abundances were calculated from the extinction-corrected line flux ratios according to a number of independently calibrated abundance diagnostics, described below. We report the abundance derived from each method in Table 4.
| SN Host Galaxy | log(O/H)+12 | AgeaaThe age of the young stellar population has been estimated based on the rest-frame equivalent width of the H line, following Levesque et al. (2010a) (see Section 3.5). | |||||
|---|---|---|---|---|---|---|---|
| Direct | Z94 | KD02 | PP04N2 | PP04O3N2 | PT05 | (Myr) | |
| SN Type: IIb | |||||||
| 2007br | |||||||
| 2007ea | |||||||
| 2010am | |||||||
| 2010cn | |||||||
| 2011D | |||||||
| 2011V | |||||||
| PTF09dxv | |||||||
| SN Type: Ib | |||||||
| 2002ex | |||||||
| 2004cf | |||||||
| 2005hm | |||||||
| 2006jo | |||||||
| 2006lc | |||||||
| 2007az | |||||||
| 2007gg | |||||||
| 2008gc | |||||||
| 2009hu | |||||||
| 2009jf | |||||||
| LSQ11JW | |||||||
| PTF09dfk | |||||||
| SN Type: Ic | |||||||
| 2003ev | |||||||
| 2004ib | |||||||
| 2006ip | |||||||
| 2006ir | |||||||
| 2006tq | |||||||
| 2007db | |||||||
| 2007ff | |||||||
| 2007gl | |||||||
| 2007hb | |||||||
| 2007hl | |||||||
| 2007hn | |||||||
| 2008ao | |||||||
| 2008ik | |||||||
| 2009nl | |||||||
| 2010Q | |||||||
| 2011it | |||||||
| PTF09iqd | |||||||
| PTF09q | |||||||
| PTF10bip | |||||||
| PTF10vgv | |||||||
| PTF11hyg | |||||||
| SN Type: Ic-BL | |||||||
| 2005nb | |||||||
| 2006nx | |||||||
| 2007I | |||||||
| 2007ce | |||||||
| 2008iu | |||||||
| 2010ah | |||||||
| 2010ay | |||||||
| SN Type: Undetermined Ibc | |||||||
| 1991R | |||||||
| 2011gh | |||||||
| 2011hw | |||||||
We derive “direct” oxygen abundance estimates by estimating the electron temperature of the gas’ dominant excitation zone, which is only possible if the [O III] line is detected. Following Levesque et al. (2010a), the electron temperatures are estimated using IRAF’s five-level nebular modeling package nebular (Shaw & Dufour, 1994). The nebular task temden is first applied to iteratively estimate the O++ temperature () and density () of the nebula from the [O III] and [S II] line ratios, respectively. If the measured line ratios correspond to unphysical conditions (outside the range for which temden is calibrated, K and cm-3), we do not calculate the direct abundance. The O+ temperature is then estimated using the linear empirical relation of Garnett (1992). The O II and O III abundances are then estimated using the density, ionic temperatures, and [O II] and [O III] line ratios following the ionization correction factor (ICF) prescription of Shi et al. (2006). The total oxygen abundance is taken to be the sum of these two ionic abundances.
We employ several strong line diagnostics chosen to represent each of the major classes calibrated in the literature: , N2O2, N2, O3N2, and (see López-Sánchez & Esteban, 2010b, for a recent review). First, we apply the oxygen abundance calibration of Zaritsky et al. (1994), an average of three earlier methods, hereafter referred to as “Z94.” Z94 is only calibrated for the higher-metallicity upper branch of the -abundance degeneracy (log(O/H)); in every case where we apply Z94, the [N II]/[O II] ratio suggests an upper branch solution. Second, we apply the [N II]/[O II] oxygen abundance calibration of Kewley & Dopita (2002) (as updated by Kewley & Ellison 2008), hereafter referred to as “KD02.” Kewley & Dopita (2002) synthesize a variety of modern photoionization models and observational calibrations to produce recommendations for producing an abundance estimate given different permutations of available emission lines and uses the [N II]/[O II] ratio to break the degeneracy between the upper and lower branches of . Third, we apply the empirical [N II]/H (“N2”) and [O III]/[N II] (“O3N2”) oxygen abundance calibrations of Pettini & Pagel (2004), hereafter referred to as “PP04.” Fourth, we apply the excitation parameter (“ method”) oxygen abundance calibration of Pilyugin & Thuan (2005), hereafter referred to as “PT05.” is calculated from the ratio of [O III] to ([O II]+[O III]) (Pilyugin, 2001), and the [N II]/[O II] ratio is used to break the degeneracy.
There are well-known offsets between the diagnostics which are particularly large between empirically and theoretically-calibrated diagnostics (see e.g. Stasińska, 2002). However, the relative metallicity difference measured between a given pair of galaxies in different diagnostics is consistent with an rms scatter typically dex, and dex between the most discrepant diagnostics (Kewley & Ellison, 2008). Comparing the metallicities we measure for the same host galaxies in different diagnostics, we find discrepancies consistent with the rms scatter reported by Kewley & Ellison (2008). Hereafter we refer to this uncertainty intrinsic to the diagnostics as the “systematic uncertainty;” we do not factor the systematic uncertainty into the metallicities reported in Table 4, but we do consider this systematic uncertainty in our statistical analysis (Section 3.4). The systematic uncertainty is typically as large as the “statistical uncertainty” associated with the line flux and measurement errors; for example, the median statistical uncertainty associated with our PP04N2 measurements is 0.09 dex.
The galaxy sample varies with the diagnostic chosen. The PP04N2 diagnostic can be applied to nearly all galaxies in our sample (), while the similar PP04O3N2 diagnostic can only be applied to the 31 galaxies which have measurements of the potentially fainter [O III] and H lines. The [PT05,Z94] diagnostics can only be applied to [13,12] galaxies, due to their strict dependence on the full complement of [O II] and [O III] lines. We can apply the direct diagnostic to only 2 galaxies due to its reliance on the auroral line which is weak at the metallicity regime probed here. However, the N2 diagnostic produces relative metallicity estimates consistent with the other strong line methods Kewley & Ellison (2008). N2 is also less sensitive to systematic effects: it employs lines with a very small wavelength separation (so extinction correction may be neglected) and the effect of underlying absorption is less important (because the absorption equivalent width of H is typically equal to or less than H, despite the times stronger flux, e.g. Brinchmann et al. 2004). However, in N2 diagnostics no correction is made for ionization parameter and the N2 ratio can saturate at high metallicities when nitrogen becomes the dominant coolant (Kewley & Dopita, 2002).
3.3. Metallicity Distribution of SN Ibc Progenitor Environments
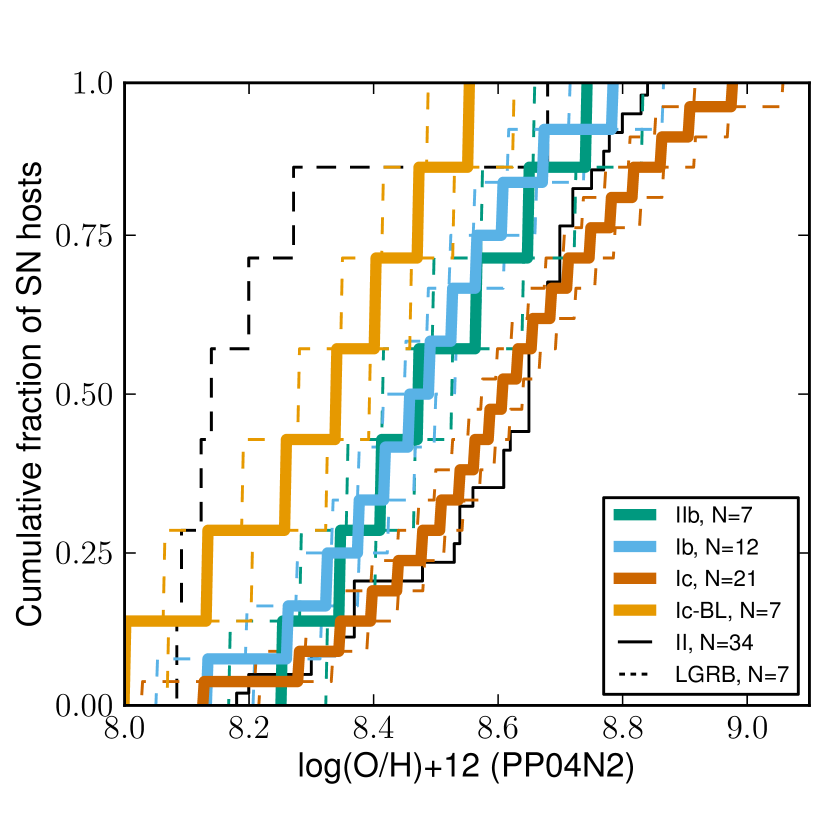
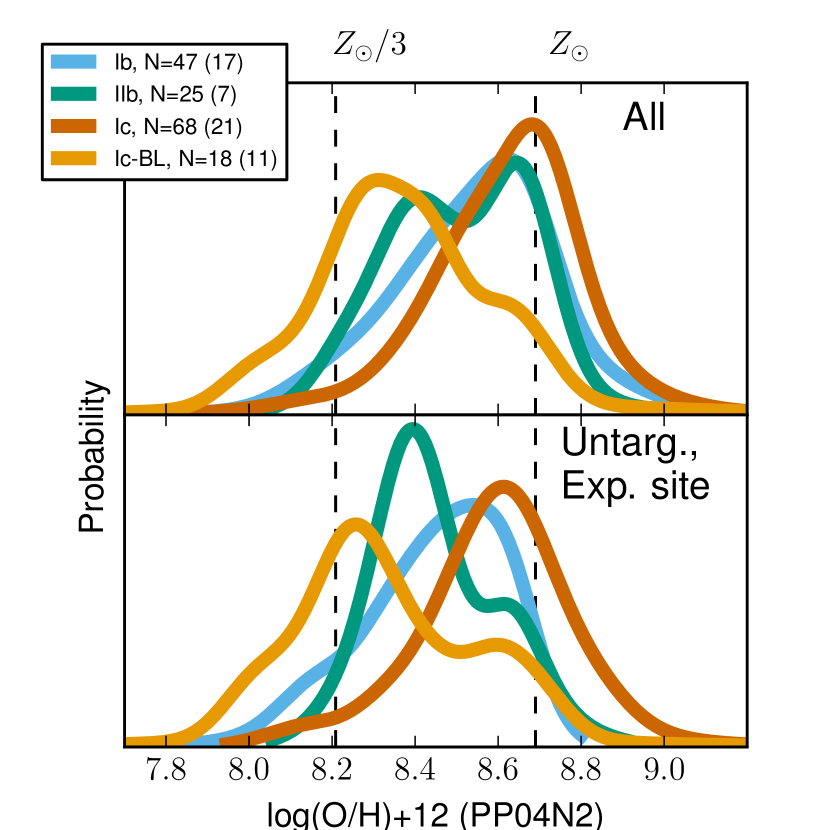
Using the PP04N2 abundance diagnostic, we measure metallicities for 12 SN Ib host galaxies and find values ranging from log(O/H), with a median abundance and standard deviation of log(O/H) and dex, respectively (Figure 4). The characteristics of the 21 SN Ic host galaxies in this diagnostic are similar, with metallicities ranging from log(O/H) and median and standard deviation of log(O/H) and dex. Among the 7 SNe IIb for which we measure PP04N2 metallicities, we find a range of log(O/H) with median log(O/H) and the standard deviation is 0.18 dex dex, similar to the SN Ib. In contrast, the 7 SN Ic-BL host environments typically have lower metallicities, with median log(O/H) and standard deviation of 0.21 dex. The minimum metallicity for SNe Ic-BL host galaxies (log(O/H)) is only dex lower that of SN Ib and Ic host galaxies, but the highest metallicity measured for an SN Ic-BL host galaxy (log(O/H)) is similar to the median for SN Ib and Ic.
We report the results from the other diagnostics in Table 5. We also note that Stoll et al. (2012) have developed an emperical, linear conversion between oxygen and iron abundance. Applying this to our host environment metallicities yields using our full sample of SNe [Ib,Ic,IIb,Ic-BL].
Table 5 illustrates that the effect of restricting our sample to only those objects with Gold classifications and explosion site spectroscopy is modest. Among the 21 SNe Ic host galaxies in our sample for which the PP04N2 diagnostic was applied, 13 have Gold classifications and explosion site spectroscopy. The difference between the median metallicity measured between this subsample and the full sample is dex. For SNe [Ib,IIb,Ic-BL], the subsample fraction is [] and the difference in the median is similarly small at [] dex. These differences, smaller than the systematic uncertainty associated with the abundance diagnostics (Section 3.2), generally reflect the lower metallicities of the SN explosion sites as compared to the galaxy nuclei.
| Diagnostic | N | Minimum | Maximum | Median | |
|---|---|---|---|---|---|
| SNe IIb | |||||
| direct | 0 (0) | ( ) | ( ) | ( ) | ( ) |
| Z94 | 3 (3) | 8.46 (8.46) | 8.54 (8.54) | 8.48 (8.48) | 0.06 (0.06) |
| KD02 | 4 (4) | 8.54 (8.54) | 9.04 (9.04) | 8.58 (8.58) | 0.25 (0.25) |
| PP04N2 | 7 (5) | 8.30 (8.30) | 8.66 (8.65) | 8.46 (8.42) | 0.18 (0.13) |
| PP04O3N2 | 4 (4) | 8.26 (8.26) | 8.33 (8.33) | 8.32 (8.32) | 0.04 (0.04) |
| PT05 | 2 (2) | 8.16 (8.16) | 8.26 (8.26) | 8.17 (8.17) | 0.07 (0.07) |
| SNe Ib | |||||
| direct | 0 (0) | ( ) | ( ) | ( ) | ( ) |
| Z94 | 4 (4) | 8.50 (8.50) | 8.78 (8.78) | 8.57 (8.60) | 0.13 (0.13) |
| KD02 | 5 (4) | 8.51 (8.51) | 8.93 (8.73) | 8.69 (8.65) | 0.21 (0.16) |
| PP04N2 | 12 (8) | 8.15 (8.15) | 8.79 (8.55) | 8.48 (8.43) | 0.16 (0.14) |
| PP04O3N2 | 9 (7) | 8.12 (8.12) | 8.57 (8.47) | 8.32 (8.31) | 0.16 (0.16) |
| PT05 | 4 (4) | 8.25 (8.25) | 8.32 (8.32) | 8.29 (8.30) | 0.10 (0.09) |
| SNe Ib/c | |||||
| direct | 0 (0) | ( ) | ( ) | ( ) | ( ) |
| Z94 | 1 (0) | ( ) | ( ) | ( ) | ( ) |
| KD02 | 2 (0) | 8.44 ( ) | 8.85 ( ) | 8.78 ( ) | 0.24 ( ) |
| PP04N2 | 3 (1) | 8.54 ( ) | 8.78 ( ) | 8.65 ( ) | 0.12 ( ) |
| PP04O3N2 | 2 (0) | 8.46 ( ) | 8.70 ( ) | 8.57 ( ) | 0.13 ( ) |
| PT05 | 0 (0) | ( ) | ( ) | ( ) | ( ) |
| SNe Ic | |||||
| direct | 0 (0) | ( ) | ( ) | ( ) | ( ) |
| Z94 | 3 (3) | 8.69 (8.69) | 9.13 (9.13) | 8.72 (8.72) | 0.33 (0.33) |
| KD02 | 6 (5) | 8.43 (8.66) | 9.03 (9.03) | 8.74 (8.83) | 0.29 (0.28) |
| PP04N2 | 21 (13) | 8.14 (8.14) | 8.88 (8.86) | 8.61 (8.60) | 0.22 (0.22) |
| PP04O3N2 | 10 (8) | 8.09 (8.09) | 8.82 (8.82) | 8.45 (8.45) | 0.23 (0.24) |
| PT05 | 4 (4) | 8.23 (8.23) | 8.44 (8.44) | 8.31 (8.31) | 0.15 (0.15) |
| SNe Ic-BL | |||||
| direct | 2 (1) | 7.92 ( ) | 8.35 ( ) | 7.98 ( ) | 0.25 ( ) |
| Z94 | 1 (1) | ( ) | ( ) | ( ) | ( ) |
| KD02 | 2 (1) | 8.58 ( ) | 8.62 ( ) | 8.55 ( ) | 0.12 ( ) |
| PP04N2 | 7 (3) | 8.01 (8.31) | 8.53 (8.46) | 8.34 (8.36) | 0.21 (0.09) |
| PP04O3N2 | 6 (3) | 7.99 (8.16) | 8.44 (8.44) | 8.20 (8.32) | 0.19 (0.14) |
| PT05 | 3 (1) | 8.18 ( ) | 8.31 ( ) | 8.20 ( ) | 0.12 ( ) |
Note. — The statistical properties of the distribution of metallicities measured for the host galaxies, divided by SN type. The first values listed represent all the SNe in the sample; the values in parenthesis reflect only those SNe with secure typing (Gold sample; Section 2) and explosion site spectroscopy (Section 2.2). The oxygen abundance diagnostics applied are described in Section 3.2. SNe of type “Ib/c” have uncertain typing. The medians and standard deviations () have been calculated from the MCMC samplings.
Finally, there are several SN host environments at which we performed spectroscopy, but could not measure metallicities. For 7 objects, we detect narrow emission lines in the host galaxy, but they are not sufficient to estimate the metallicity in any of the strong line diagnostics: 2002gz (IIb), 2008fi (IIb), 2008im (Ib), 2011bv (IIb), 2011cs (Ic), 2011ip (Ic), and PTF10aavz (Ic-BL). For 2 objects, we did not detect any narrow emission lines in our host galaxy spectrum: 2004ai (Ib) and 2010lz (Ic). With the exception of SN 2004ai, these host galaxies are not at exceptionally high redshifts with respect to the remainder of the sample, and poor S/N in the spectroscopy is due to the intrinsic low luminosity of the host galaxies.
We place upper limits on the host environment metallicity of these SNe using archival photometry combined with the relation of Tremonti et al. (2004)888Converting the Tremonti et al. (2004) relation from the T04 to the PP04N2 scale and adopting log(O/H) on the T04 scale (Delahaye & Pinsonneault, 2006), a galaxy with mag should have solar metallicity. and, when H is detected, the the 3 upper limit measured for the [N II] flux combined with the PP04N2 diagnostic. We summarize this investigation in Table 6 and note a few special cases here, but we do not use these metallicity limits in our figures or statistics except where explicitly noted. SN 2008im occurred kpc from the nucleus of the Sb galaxy UGC 02906 (Oksanen, 2008, with ). In our spectrum, light from an older stellar population dominates over any signature of star formation. Given that the host galaxy has an absolute magnitude mag, the explosion site is likely to be of sub-solar metallicity. The only one of these nine host environments for which we cannot place useful constraints on metallicity is that of SN 2004ai, reported as a SN Ic by Riello et al. (2004a), but revised to SN Ib (M. T. Botticella, private communication). The supernova spectrum indicates , making it by far the most distant SN in our sample. H is redshifted out of our spectral range and nothing is visible in DSS images at this position, from which we infer that mag, which does not allow us to distinguish between sub- or super-solar metallicities. The remaining seven host environments are constrained to be at sub-solar metallicities, although for SN 2008im and 2010lz we do not have sufficient S/N in H to place spectroscopic limits on the metallicity.
| SN | SN Type | (mag) | (phot.)aaMetallicity (log(O/H) ) limit implied by the relation using the photometry listed, on the PP04 scale. | (spec.)bbfootnotemark: | |
|---|---|---|---|---|---|
| 2002gz | IIb-pec (G) | 0.085 | |||
| 2004ai | Ib (S) | 0.590 | |||
| 2008fi | IIb (G) | 0.026 | |||
| 2008im | Ib (G) | 0.008 | -19 | ||
| 2010lz | Ic (G) | 0.090ccDrake et al. (2011a) | |||
| 2011bv | IIb (G) | 0.072 | |||
| 2011cs | Ic (G) | 0.101 | |||
| 2011ip | Ic (G) | 0.051 | |||
| PTF10aavz | Ic-BL (G) | 0.063 |
Note. — The security of the spectral classification (Silver, S, or Gold, G; see Section 2) is indicated in parenthesis. Unless otherwise noted, we retrieve photometry for these host galaxies from NED, the NASA/IPAC Extragalactic Database operated by the Jet Propulsion Laboratory, California Institute of Technology, under contract with the National Aeronautics and Space Administration. When photometry is not available in NED (not detected in DSS), we assume mag. Redshifts are taken from NED or our own spectroscopy, except where noted.
3.4. Statistical tests on metallicity distributions
We apply the KS test to our metallicity measurements (Table 7) and interpret to indicate statistically significant evidence for a difference in the parent populations of the two sets being compared. When Monte Carlo simulations999Following Leloudas et al. (2011), we incorporate the uncertainty in the individual metallicity estimates (but not the diagnostic systematic uncertainty) by repeating the KS test through Monte Carlo simulations where we sample from the full probability distribution for the metallicity of each host galaxy. indicate that rises above this threshold () in at least 14% of trials, we refer to this as “marginal” evidence of statistical significance.
We find no significant difference between the metallicity distribution of SN Ib and Ic, with using the PP04N2 diagnostic ( if restricted to Gold classifications and explosion site metallicity measurements). This contrasts with the finding of Modjaz et al. (2011), that the distributions disagree at the level using the equivalent PP04O3N2 diagnostic, but is consistent with the null result of Anderson et al. (2010); Kelly & Kirshner (2011); Leloudas et al. (2011). We note that when we apply the KS test to the sample of SN Ib and Ic from Modjaz et al. (2011) using our methodology, we find . The difference is that we separate SN IIb and Ibn from Ib, which changes the metallicity distribution and reduces the SN Ib sample size by 5 objects.
| IIb | Ib | Ic | Ic-BL | |
|---|---|---|---|---|
| IIb | ||||
| Ib | ||||
| Ic | ||||
| Ic-BL |
Note. — The values in the table are KS test -values () for the probability that the measured host galaxy metallicities of the SNe of the two indicated types were drawn from the same parent populations. Above the diagonal, all objects in our sample are considered; below the diagonal, only objects with Gold spectroscopic classification and explosion site spectroscopy are considered. The PP04N2 diagnostic is used for metallicity estimation. The KS test is performed only if metallicity measurements are available for SN of each type. The upper and lower limits listed are the 16th and 84th percentile values of the results of the KS test Monte Carlo simulations.
We find different metallicity distributions for SN Ic and Ic-BL, with using the PP04N2 diagnostic. Given the smaller sample size and lower median metallicity of the SN Ib, the evidence for a difference in the Ic-BL and Ib metallicity distributions is not significant (). We find no evidence for a significant difference between the SN Ib and IIb populations ().
3.5. Young stellar population ages
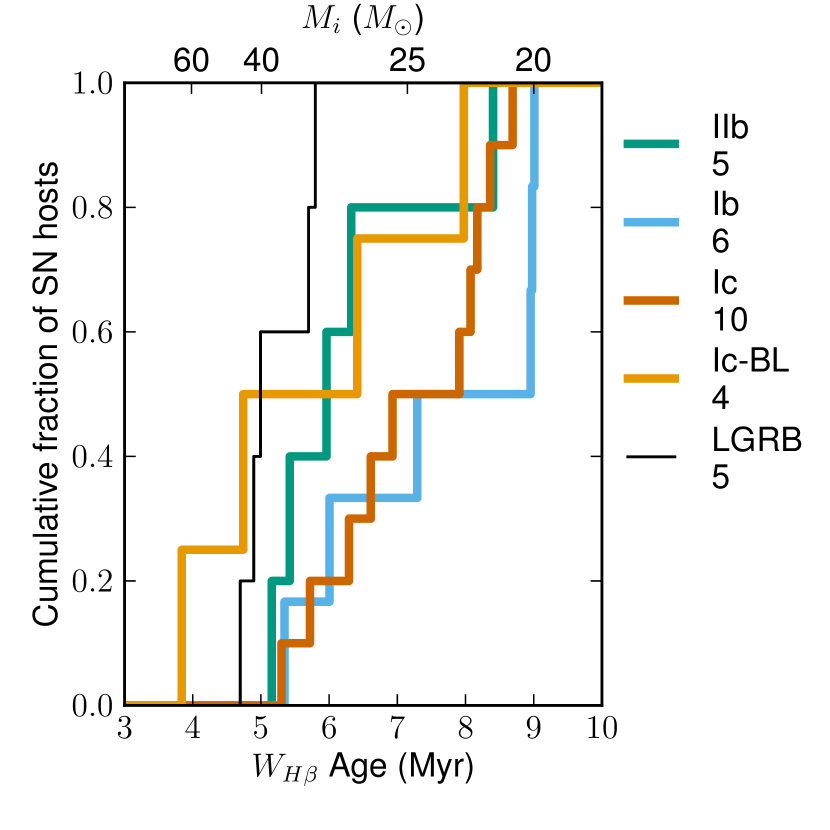
We estimate the age of the young stellar population using the method of Levesque et al. (2010a), assuming an instantaneous-burst star formation history (for a review see Stasińska & Leitherer, 1996). The age estimate is based on the rest frame equivalent width of the H line () and evolutionary synthesis models for starburst galaxies based on the Geneva HIGH evolutionary tracks (Meynet et al., 1994; Schaerer & Vacca, 1998). We use the PP04N2 diagnostic to break the metallicity degeneracy, restrict the sample to spectra obtained at the explosion site, and exclude objects with supernova flux contamination (SNe 2010ay, 2011bv, 2011gh, 2011ip, LSQ11JW, PTF10aav).
As illustrated in Figure 5, we find that the ages of young stellar populations in Type Ib and Ic SN host environments are not discrepant, with median ages of Myr and standard deviations of Myr for SN [Ib,Ic] with explosion site spectra, and . However, the ages of SN Ic-BL environments () are somewhat lower, with a median of Myr and standard deviation of Myr. Given the small sample size, the KS test cannot confirm statistical significance, . Similarly, the age of SN IIb environments seems to be lower than that of SN Ib and Ic, with median age Myr and standard deviation of Myr, but the sample size is small ().
We note that the distribution of ages for SN Ic-BL host environments in our sample are similar to that of the low-redshift () LGRB hosts studied in Levesque et al. (2010a), which have a median age of Myr. The KS test does not suggest that the LGRB and SN Ic-BL age distributions are significantly different (), but with only 5 low- LGRBs the sample sizes are small. Moreover, the observation that SN Ic-BL and IIb occur in younger stellar populations is consistent with the finding of Kelly & Kirshner (2011) that these types of SNe have bluer explosion site colors.
With some caveats, we can interpret the young stellar population ages in terms of the lifetime of massive stars. For consistency with the models of Levesque et al. (2010a), we use the stellar lifetimes from the “Geneva HIGH” (high mass loss) solar-metallicity () evolutionary tracks computed by Meynet et al. (1994) (shown in Figure 5). The measured ages therefore imply progenitor stars with initial masses for SN Ib and Ic. This is similar to the mass range for SN Ib/c progenitors expected from stellar evolutionary theory and indicated by the relative rate of SN Ibc and SN II (Boissier & Prantzos, 2009), but may be discrepant with progenitor non-detection upper limits from pre-explosion imaging (for a review, see Smartt, 2009). For SN IIb and Ic-BL, the young stellar population ages imply progenitor stars that are somewhat more massive, . While stars of a given mass are longer-lived at lower metallicity in the Geneva models, and the SN Ic-BL progenitor stars are found in lower metallicity environment, the effect is small because the lifetimes vary by over a factor of in metallicity. However, because the ages are estimated assuming an instantaneous burst of star formation and neglecting any ongoing star formation, the possibility of younger progenitor stars within the population is not precluded. Further assumptions inherent to this diagnostic include complete absorption of ionizing photons, spatially uniform dust extinction in both nebular and stellar emission regions, and it is based on evolutionary tracks that do not include the effects of stellar rotation.
3.6. Wolf-Rayet star populations
Broad Wolf-Rayet (WR) features (“bumps”) in galaxy spectra, reflecting the existence of evolved, massive stars (), can be used to characterize the nature of ongoing star formation in the galaxy (Allen et al., 1976; Kunth & Sargent, 1981; Schaerer & Vacca, 1998; Schaerer et al., 1999). In particular, the “blue bump” which is primarily due to the He II line is an indicator of late-type WN Wolf-Rayet (WNL) stars. A visual inspection of the spectra of our SN Ibc host environments does not reveal any recognizable blue bumps. We estimate the upper limit of the flux in the blue bump feature as times the rms of the continuum flux in a Å window at its location.
We follow the method of López-Sánchez & Esteban (2010a) to place limits on the fraction of WNL stars in the young stellar population, , based on the ratio of the upper limit flux of the blue bump to H. For WR galaxies in their dataset, this fraction ranges from , smaller than we can constrain with most of our spectra due to the continuum S/N. However, there are 3 host environments for which we can rule out WNL populations at that level (2007az, 2008iu, 2010Q; all explosion site spectra) and one for which we can rule out (2007ce). Significantly higher S/N spectroscopy or narrow-band imaging could provide stricter constraints for typical SN host galaxies. This analysis demonstrates that investigations of the WR populations of SN host environments requires a significantly different observing strategy than a study designed for strong line metallicity measurements, and will likely be limited to nearby SN host galaxies.
4. Combined SN Ibc Dataset
Next we combine our dataset with those of previous/concurrent spectroscopic studies of SNe Ibc (Anderson et al. 2010, Kelly & Kirshner 2011, Leloudas et al. 2011, Modjaz et al. 2011, and this work). We summarize the characteristics of these surveys in Table 8.
4.1. Criteria of the Combined SN Ibc dataset
| SN Type | A+10 | K+11 | L+11 | M+11 | S+12 | TW |
|---|---|---|---|---|---|---|
| Targeted SNe | ||||||
| IIb | 1 | 13 | 2 | 3 | 0 | 0 |
| Ib | 10 | 10 | 3 | 7 | 0 | 0 |
| Ib/c | 3 | 2 | 2 | 1 | 0 | 0 |
| Ic | 14 | 23 | 1 | 10 | 0 | 0 |
| Ic-BL | 0 | 5 | 0 | 6 | 0 | 0 |
| 0.005 | 0.011 | 0.016 | 0.012 | |||
| Untargeted SNe | ||||||
| IIb | 0 | 1 | 0 | 1 | 2 | 10 |
| Ib | 0 | 3 | 6 | 6 | 3 | 13 |
| Ib/c | 0 | 1 | 1 | 0 | 0 | 3 |
| Ic | 0 | 5 | 4 | 4 | 3 | 24 |
| Ic-BL | 0 | 4 | 0 | 9 | 1 | 8 |
| 0.034 | 0.037 | 0.037 | 0.036 | 0.036 | ||
| All SNe | ||||||
| IIb | 1 | 14 | 2 | 4 | 2 | 10 |
| Ib | 10 | 13 | 9 | 13 | 3 | 13 |
| Ib/c | 3 | 3 | 3 | 1 | 0 | 3 |
| Ic | 14 | 28 | 5 | 14 | 3 | 24 |
| Ic-BL | 0 | 9 | 0 | 15 | 1 | 8 |
| 0.005 | 0.015 | 0.022 | 0.017 | 0.036 | 0.036 | |
Note. — The number of host galaxies in each of the literature samples divided by SN type, and median redshifts, . The numbers are given for SNe discovered by untargeted (targeted) surveys. SNe of type “Ib/c” have uncertain typing. The samples come from the following references: A+10, Anderson et al. (2010); K+11, Kelly & Kirshner (2011) (only objects with metallicities measured); L+11, Leloudas et al. (2011); M+11, Modjaz et al. (2011); S+12, Stoll et al. (2012); TW, this work.
| A+10 | K+11 | L+11 | M+11 | S+12 | TW | |
|---|---|---|---|---|---|---|
| A+10 | 28 | 7 | 0 | 0 | 0 | 0 |
| K+11 | 67 | 3 | 12 | 3 | 4 | |
| L+11 | 20 | 5 | 0 | 5 | ||
| M+11 | 47 | 0 | 5 | |||
| S+12 | 9 | 4 | ||||
| TW | 58 |
Note. — The numbers on the diagonal represent the total number of SNe Ibc in each sample; the numbers above the diagonal represent the intersection of the samples. The samples are the same as in Table 8.
For the purposes of assembling a statistical sample, we consider only measurements made on the PP04 scale (see Section 3.2)101010For our observations and those of Anderson et al. (2010) and Leloudas et al. (2011), we employed measurements made using the PP04N2 diagnostic; for Kelly & Kirshner (2011) and Modjaz et al. (2011), who do not report PP04N2 measurements, we instead employ the PP04O3N2 measurements and apply the small transformation from Kewley & Ellison (2008).. Among these five samples, there are metallicity measurements for 171 unique SN Ibc host galaxies, of which 133 had metallicity measurements predating our study. To ensure consistency between authors when propagating uncertainties, we add in quadrature a representative systematic uncertainty of 0.07 dex (see Section 3.2) to the metallicity estimates from our study, Leloudas et al. (2011), and Modjaz et al. (2011); for Kelly & Kirshner (2011) and Stoll et al. (2012), who do not report metallicity uncertainties, we assume this is the sole uncertainty.
Following the authors’ own evaluations, we consider all observations from Modjaz et al. (2011) and all but three from Leloudas et al. (2011) to be at the explosion site. If we were to apply our own criteria (Section 2.2), 4 of the observations from Modjaz et al. (2011) would not qualify as explosion site due to their high redshift (SNe 2007jy, 2007qw, 2005kr, and 2006nx). For Anderson et al. (2010), following Section 2.2, we consider the observations where the spectrum was extracted kpc from the SN position to be at the explosion site. For Kelly & Kirshner (2011), who employ fiber spectroscopy from the SDSS, we consider all of the observations to be nuclear rather than explosion site measurements, as they sample the global properties of the host galaxy. We have investigated the discrepancies between those host galaxies whose metallicity measurements were performed by multiple authors and they are typically dex. When SNe have metallicities reported by multiple authors ( see Table 9), we adopt the average and use only explosion site metallicities where possible. We neglect any systematic uncertainty introduced by differences in instrumental characteristics and spectroscopic analysis between the samples.
Of this combined sample, 75 of the SNe were discovered by untargeted searches and 114 of the metallicity measurements come from explosion site spectroscopy. Before our observations, these sample sizes were only 37 and 84, respectively. Our results therefore approximately double the number of untargeted SN Ibc for which host galaxy metallicity measurements have been published, and significantly increase the number of explosion-site metallicity measurements.
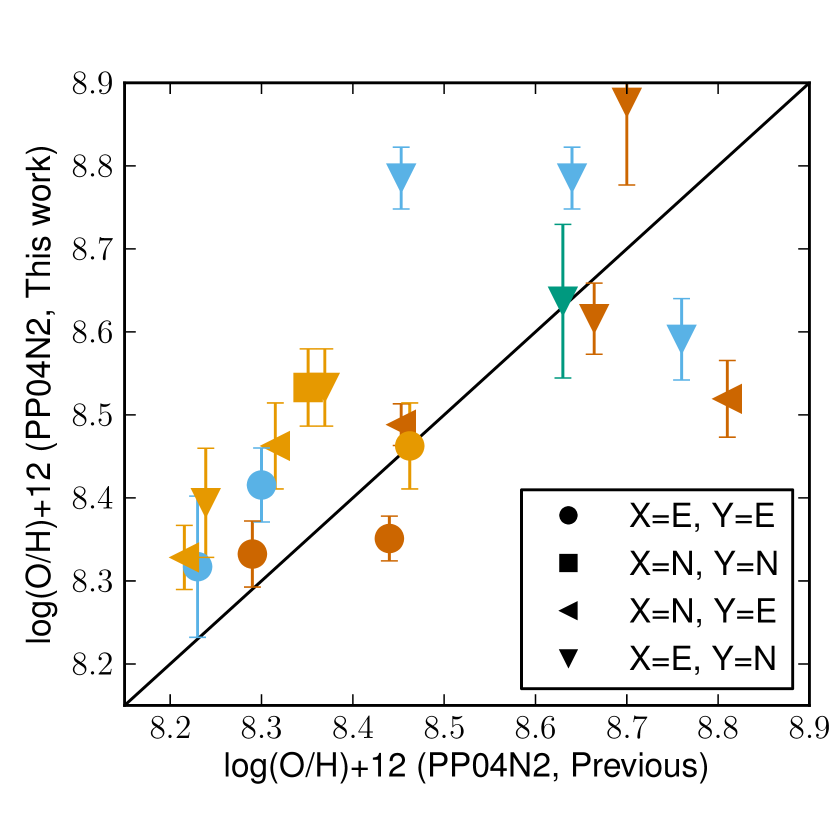
Figure 6 compares the metallicity measurements made in this work to 18 previous measurements of the same host galaxies from the combined sample. Generally, discrepancies are small, with a mean residual of 0.06 dex and rms of 0.15 dex. In the median, the discrepancy is the statistical error in our measurement. The largest outliers can be explained by clear differences in spectroscopic methodology between our sample and the previous works. For example, for PTF09q we measured in our explosion site spectrum, whereas Stoll et al. (2012) measure a higher from their SDSS spectrum due to the nuclear placement of the Sloan fiber ( kpc from the SN site). There are 5 cases where we can compare an explosion site measurement from our sample to an equivalent measurement from the literature, and in those cases the rms discrepancy is only half as large (0.08 dex).

4.2. SN Ib vs. Ic metallicities
Figure 7 illustrates the metallicity distribution for all the SN Ibc host galaxies from the combined sample. First we consider the distributions with no selection criteria for SN discovery or spectroscopy methodology. With sample sizes of [47,68], we find the median metallicity of SN [Ib,Ic] to be log(O/H). The difference between the distributions is not statistically significant () and the difference in the medians is small relative to the width of the distributions ( dex standard deviation).
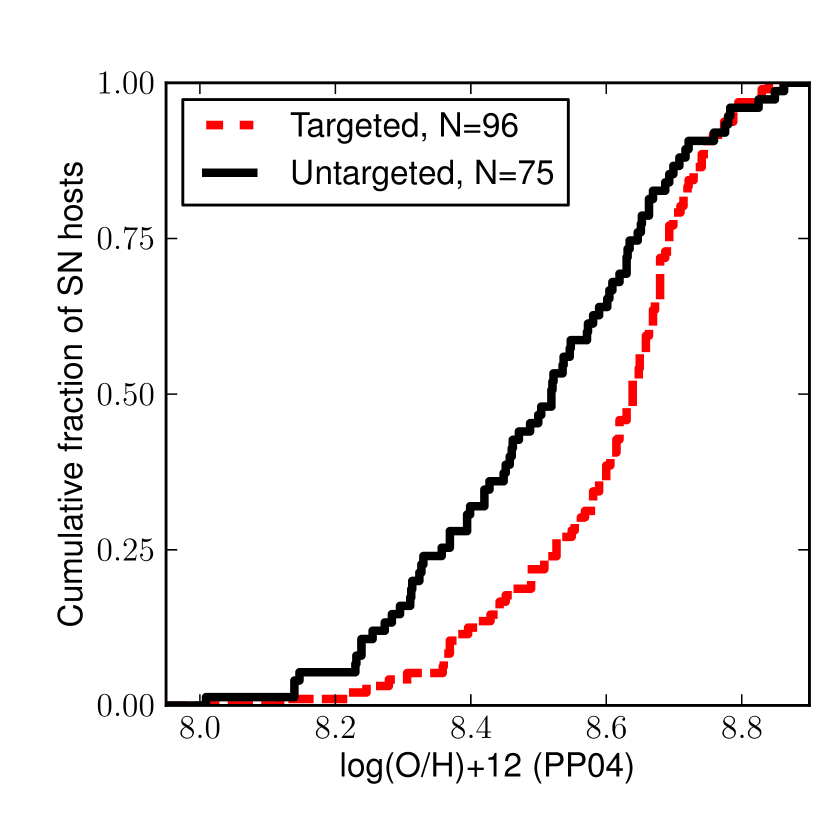
If instead we only consider SNe discovered by targeted SN searches, we find SN host environments with systematically higher metallicities (as quantified in Section 5.1) and we find that the differences between the metallicity distributions for SNe of different types are reduced (Figure 8). The median metallicity of the SN [Ib,Ic] from the targeted searches is log(O/H) (). Among the subsample with spectroscopy at the SN explosion site ( SN [Ib,Ic]) we find median metallicities of log(O/H) ().
Looking exclusively to untargeted SNe, for SN [Ib,Ic] we find median metallicities of log(O/H) (Figure 8). While this difference is marginally statistically significant (), it is biased by an unequal numbers of galaxy-nucleus versus explosion site spectroscopy in the SN Ib and Ic samples (19 and 28% nuclear spectroscopy, respectively). This sample construction bias raises the metallicities of SN Ic relative to SN Ib (see Section 5.2). If the sample is restricted to only explosion site measurements, the median difference is similar ( dex), but the difference in the full distribution is not significant (). The difference in the distributions is most apparent at the high-metallicity end, where very few SN Ib discovered by untargeted surveys are found at super-solar metallicities. However, the explosion site spectroscopy in Figure 8 illustrates that SN Ib discovered by targeted searches do occur in super-solar metallicity environments, and therefore their absence among the untargeted objects must be attributed to small sample size.
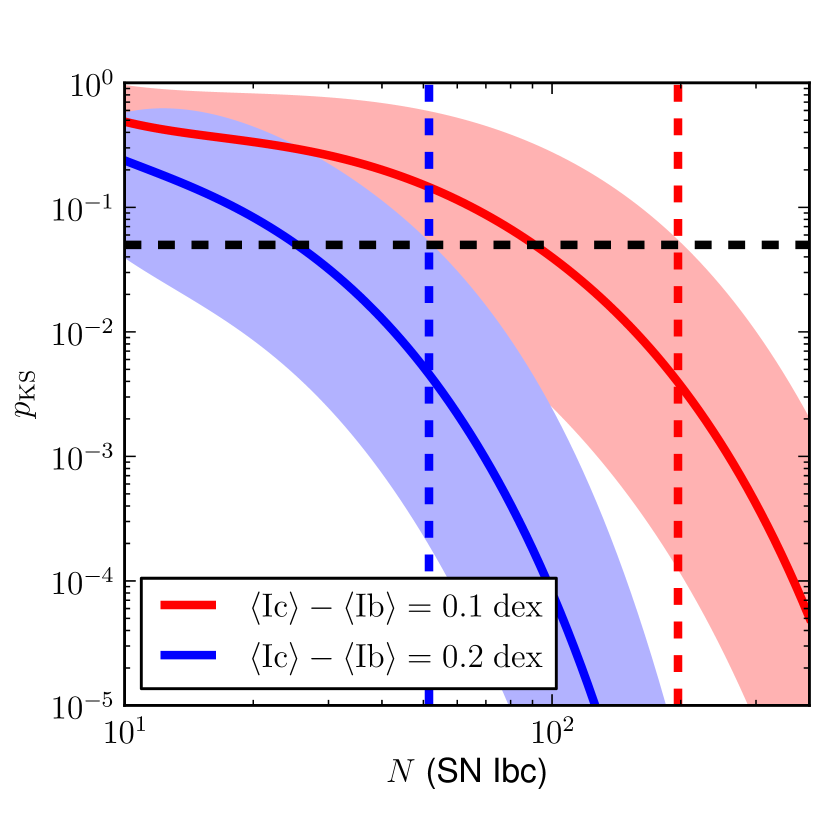
How many observations would be required to distinguish between a true difference in the underlying distribution of progenitor metallicities for SN Ib and Ic? If we assume that the metallicity distribution of SN Ic progenitors is enriched by dex with respect to SN Ib progenitors (as we find in Section 3.3) and that both distributions are Gaussians with standard deviation dex, then we can randomly sample from these distributions to investigate the value of we would infer from studies of different sizes (see Figure 9). We take statistical significance to be indicated by the KS test when and we assume a sample ratio .
We find that, in the absence of systematics, only () SN Ibc would be required to distinguish the discrepancy in 85% (50%) of trials given a difference in the median metallicity of dex (as suggested by Modjaz et al., 2011). The combined sample includes SN [Ib,Ic] metallicity measurements; of these come from untargeted SN searches and therefore have substantially reduced systematics (see Section 5.1). Therefore, the observations to date should be sufficient to distinguish a median metallicity difference of dex between SN Ib and Ic (even among exclusively-untargeted surveys), which is not supported by the data in the combined sample. However, a much larger sample of () observations of SN Ib and Ic would be necessary to distinguish a median difference of dex in the progenitor distribution in 84% (50%) of trials. Therefore a sample as large as the combined sample would be required to unambiguously distinguish a relatively subtle discrepancy of dex.
The host environment metallicity measurements made for 34 untargeted Type II SNe by Stoll et al. (2012) (shown in Figure 4) constitute an interesting proxy for the metallicity distribution of the massive star progenitors of core-collapse SNe. Applying the KS test using all the untargeted objects in the combined sample, we do not find a significant difference between the metallicities of SN Ic and SN II (), although there is a significant difference between SN II and [Ib,Ic-BL] (). Combining all the SN Ibc in our sample, we find that they have a median metallicity dex lower than the SN II and the difference in the full distribution is significant at . A higher median metallicity for SN II than Ibc would conflict with several previous findings (e.g. Prieto et al. 2008; Boissier & Prantzos 2009; Anderson et al. 2010; Kelly & Kirshner 2011) and would not be consistent with metal-line driven winds stripping the progenitors of SN Ibc, unless combined with a significantly more bottom-heavy IMF at low metallicities. This discrepancy may instead indicate differences in sample construction. The relatively bright SN Ic-BL may be over-represented in the combined sample relative to a volume limited survey (see Section 5.4), biasing the SN Ibc metallicity downward, and some low-luminosity SN II and Ibc host galaxies do not have metallicity measurements (see Section 5.5 in this work and Section 3 of Stoll et al. 2012).
4.3. SN Ic vs. Ic-BL metallicities
When no cut is placed on SN discovery or spectroscopy characteristics, the SN Ic-BL in the combined sample () have an appreciably smaller ( dex) median metallicity (log(O/H)) than other SN Ibc, and the difference relative to the SN Ic distribution is significant with (see Figure 8). Restricting our scope to SNe discovered by targeted searches, the sample of targeted SN Ic-BL is limited (). The SN Ic-BL again show a median metallicity (log(O/H)) dex smaller than other SN Ibc, but the difference compared to the SN Ic has only marginal statistical significance (). However, for SN Ic-BL from untargeted surveys (primarily from this work and Modjaz et al. (2011)), we find a median metallicity (log(O/H)) that is dex lower than from the targeted SN searches. This median metallicity is significantly different111111Statistical significance is verified despite a smaller sample size than in the SN Ib versus Ic comparison because the difference in the distributions is much larger. Simulations of the type illustrated by Figure 9 indicate that a sample of SN Ic+Ic-BL is sufficient to expose a dex median difference at the level in of trials. from the distribution of either SN Ic ( dex lower median, ) or the combination of the SN Ib, Ic, and Ib/c (). As the SN Ic-BL metallicities derive almost exclusively from explosion site spectroscopy, this difference is not dependent on spectroscopic methodology ( for SN Ic vs SN Ic-BL with explosion-site spectroscopy only).
It has been suggested that the metallicity distribution of SNe Ic-BL may be bimodal (see e.g. Modjaz et al., 2008). This question is entangled with SN search methodology, because some SN Ic-BL are discovered via associated GRBs (by untargeted gamma-ray searches), while many SN Ic-BL without GRBs have been found by targeted SN searches. While we have shown SN Ic-BL are preferentially found at lower metallicity than other SN Ibc, Figure 7 illustrates that the metallicity distribution of SN Ic-BL is broad, extending to super-solar metallicities. The Figure is visually suggestive of a bimodality, even among objects only from untargeted SN searches and with explosion-site metallicity measurements, but given the sample size the distribution is not significantly different than a Gaussian. Further studies comparing SN Ic-BL explosion properties (optical luminosity, photospheric velocity, etc.) with explosion site metallicity may inform the discussion of progenitor (sub)classes for these objects.
4.4. SN IIb vs. Ibc metallicities
Arcavi et al. (2010) reported that SN IIb preferentially occur in low-luminosity, likely low-metallicity, host environments. However, when no cut is placed on SN discovery or spectroscopy characteristics, the difference between the combined sample distributions for SN Ib () and IIb () is not significant, with (see Figure 8). Among only objects with explosion site spectroscopy ( SN IIb), the SN IIb median log(O/H), dex lower than SN Ib, but this difference is not significant (). Among SNe discovered by untargeted searches (, mostly from this work), there is no suggestion of a difference between the host environment metallicity of SN IIb and SN Ib, with . As with SN Ic-BL, Figure 7 points to a bimodality in the SN IIb metallicity distribution that cannot be statistically verified with the present sample size.
| All | Nuclear | Exp. Site | |
|---|---|---|---|
| SN Ib vs Ic | |||
| All | |||
| Targeted | |||
| Untargeted | |||
| SN IIb vs Ib | |||
| All | |||
| Targeted | |||
| Untargeted | |||
| SN Ic-BL vs Ic | |||
| All | |||
| Targeted | |||
| Untargeted | |||
| SN Ic-BL vs Ibc | |||
| All | |||
| Targeted | |||
| Untargeted | |||
Note. — This table lists the KS test -value () and sample size () for SN Ibc metallicity distributions (PP04 scale) in the combined sample. Each table entry reflects a different cut on the SN discovery (galaxy-targeted or untargeted) and spectroscopic methods (nuclear or explosion site; see also Figure 8). Each entry is given as . “SN Ibc” is a combination of SN Ib, Ic, and Ib/c.
4.5. Type Ic supernovae from dwarf host galaxies
Investigating SNe discovered in the first year of operation of PTF, Arcavi et al. (2010) found that SN IIb and Ic-BL occur preferentially in dwarf host galaxies (defined by mag), while they found SN Ic only in giant host galaxies ( mag). They interpret this as evidence for a dependence of the SN explosion properties on the metallicity of the explosion site. Transforming the relation of Tremonti et al. (2004) to the band, they find that this threshold corresponds to a characteristic metallicity of , or log(O/H) on the PP04 scale. However, this photometric approach has several limitations (see Section 3.1 of Arcavi et al. 2010). In particular, the statistics are limiting, with only 6 SN Ibc in dwarf galaxies, and the absolute magnitude of the host galaxy does not necessarily reflect the metallicity of the explosion site accurately (Section 5.2). Moreover, while the mass-metallicity relation for star-forming galaxies is relatively tight (Tremonti et al. 2004 find dex), the scatter is larger when luminosity is used as a proxy for mass (Tremonti et al. 2004 find dex for ) and the scatter increases by a factor of at low-luminosities/masses in the dwarf regime (see e.g. Kewley & Ellison, 2008; Mannucci et al., 2011). Additional scatter is introduced in the survey of Arcavi et al. (2010) because they use a statistical transformation to convert their -band magnitudes to the -band and because they do not correct for extinction of the host galaxies, which Tremonti et al. (2004) find is typically mag ( dex in ). Finally, the statistical analysis of Arcavi et al. (2010) depends on the arbitrary choice of the luminosity threshold ( mag).
Using the spectroscopic metallicity threshold log(O/H), 4% of the combined sample of SN Ibc host galaxy observations we consider here are in dwarf hosts (6/171 with PP04 metallicity measurements). Of these six, two are SN Ic-BL discovered by untargeted surveys (2007ce and 2008iu, both with explosion-site metallicity measurements presented by this work), one is an untargeted SN Ib (2007az; this work), one is a targeted SN IIb (2008ax; nuclear metallicity from Kelly & Kirshner 2011), and two are SN Ic. The SN Ic are SN 2002jz, discovered by a targeted survey with an explosion site metallicity measured by Anderson et al. (2010), and SN 2010Q, discovered by the untargeted CRTS survey and with explosion site metallicity measured as a member of our Gold spectroscopic sample. However, the spectral classification of SN 2002jz is somewhat uncertain, as Hamuy et al. (2002b) suggest that it possibly displays H absorption reflective of Type IIb SNe. Additionally, there are 3 SN Ic (all Gold classifications) in our sample for which we can not measure metallicities using strong line diagnostics, but are likely to be in sub-solar metallicity hosts and at least one of these (SN 2010lz) is in an exceptionally low-luminosity host galaxy (see Section 5). Finally, we note SN 2005kf, which Modjaz et al. (2011) report as a Type Ic SN from a mag dwarf host galaxy with super-solar metallicity (log(O/H)).
In summary, spectroscopic metallicity measurements of the host environments of SN Ibc do not support the conclusion of Arcavi et al. (2010) that SN Ic do not occur in low-metallicity host galaxies. This discrepancy may be due to the small number of objects included in the sample of Arcavi et al. (2010). Moreover, because secondary metallicity estimates made using host galaxy photometry introduce additional scatter, their role in detecting the subtle difference that could exist between the metallicity distributions of SN Ib and Ic may be limited. In Section 4.2 we show that existing observations demonstrate that the difference in the median metallicity of SN Ib and Ic host galaxies is almost certainly dex, while the systematic uncertainty in photometric metallicity measurements is dex.
5. Systematic Effects
5.1. Targeted vs. Untargeted SN Searches
Galaxy-targeted supernova searches can bias SN host environment studies towards higher metallicities due to the galaxy relation, as illustrated in Figure 10. The median metallicity measured for SNe discovered by targeted searches is log(O/H) , while for untargeted searches it is log(O/H) (24% lower). The difference between the distributions is statistically significant (). The fraction of galaxies with metallicity is larger by a factor of in untargeted surveys, meaning that low-metallicity galaxies are strongly underrepresented in targeted surveys. This ratio is still appreciable for (), and even galaxies of solar metallicity are somewhat under-represented in targeted searches ().
Consequently, galaxy-targeted SN searches offer a smaller baseline over which to probe for differences in metallicity distributions. The spread in the metallicity distribution of SN Ibc discovered by targeted SN searches in the combined sample is only as large as that of untargeted surveys. As a result, the metallicity distributions of SNe are compressed and differences are reduced, as illustrated by Figure 8.
This bias has important consequences for studies which combine observations of SNe discovered by both targeted and untargeted surveys. To illustrate this, we take the assumption that SN Ib and Ic share the same metallicity distribution and randomly draw samples from the targeted and untargeted SN Ibc metallicity distributions shown in Figure 10. We produce simulated samples constructed identically to that of Modjaz et al. (2011) with respect to SN discovery characteristics: [6,11] targeted and [6,4] untargeted SN [Ib,Ic]. We find the SN Ic in the simulated samples to have higher average metallicities than the SN Ib in 64.2% of simulated trials, due solely to the bias. The average difference in the SN Ic and SN Ib metallicities reported by Modjaz et al. (2011) ( dex, depending on the diagnostic scale) is reproduced or exceeded in 3.3% of the trials. Similarly, we find that in 5.0% of trials, a KS test on the simulated observations would indicate that SN Ic host environments are significantly different () from Ib environments. This represents a systematic effect biasing the results of the study, above and beyond the statistical ambiguity indicated by the KS test -value. We conclude that differences in sample construction alone (the ratio of supernovae from targeted versus untargeted searches) can lead to erroneous differences in the metallicity distribution measured for the host environments of different SN types.
5.2. Isolating the SN Explosion Site
Relative to nearby galaxies observed in targeted surveys, host galaxies in our exclusively-untargeted sample will typically have smaller intrinsic radii and luminosities and are typically found at greater distances. As a result, we are not able to resolve and measure the local metallicity at the explosion site of every host galaxy in our sample. As we discuss in Section 2.2, many of our measurements reflect integrated galaxy flux or only light from the brightest region of the galaxy (the nucleus). The situation is similar for SNe hosted by edge-on galaxies, where the host environment spectrum is necessarily integrated over the full line-of-sight.
It has been shown that SN Ic preferentially occur in the innermost regions of galaxies, moreso than SN Ib or IIb (Prieto et al., 2008; Kelly et al., 2008; Anderson & James, 2009; Habergham et al., 2012). In cases where we resort to measuring the galaxy nuclear metallicity, this implies that we would overestimate the metallicities of SN Ib relative to Ic in the presence of a strong gradient (e.g. Zaritsky et al. 1994). We would therefore be less sensitive to the scenario where SN Ib come from lower metallicity environments than SN Ic within galaxies of similar nuclear characteristics.
However, the role of gradients is not clear cut and the ability to resolve explosion environments is limited, even for surveys of local galaxies. Individual SN Ibc host environments (HII regions) can only be resolved from nearby emission nebulae for the most local events (e.g. for a 100 pc HII region and a 1˝ slit). Moreover, long-slit spectroscopy of nearby spiral galaxies illustrates that the oxygen abundance difference between the galaxy nucleus and disk outskirts is modest (very rarely as large as dex; Moran et al. 2012). Metallicity gradients in galaxies should play an even smaller role for explosion sites close to the galaxy nucleus, where SNe Ibc usually occur (Kelly et al., 2008). Moreover, nearby spiral galaxies show significant intrinsic scatter in metallicity gradients (e.g. Fabbiano et al. 2004, Rosolowsky & Simon 2008, Sanders et al. 2012; but see also Bresolin 2011).
We investigate the effect of physical resolution on the median metallicity difference measured between SN Ib and Ic host environments in Figure 11. Monte Carlo simulations incorporating the uncertainties in the individual metallicity measurements demonstrate that the difference in the median metallicity of SN Ib and Ic is never significantly larger than the uncertainty in the median for any sample. For comparison, we show a model where the true median difference of dex that can be measured accurately at , but is diminished linearly with increasing physical resolution until it is apparently 0 dex at a modest redshift (, resolution of kpc). The model is shown cumulatively for a sample with the redshift distribution of the combined sample.
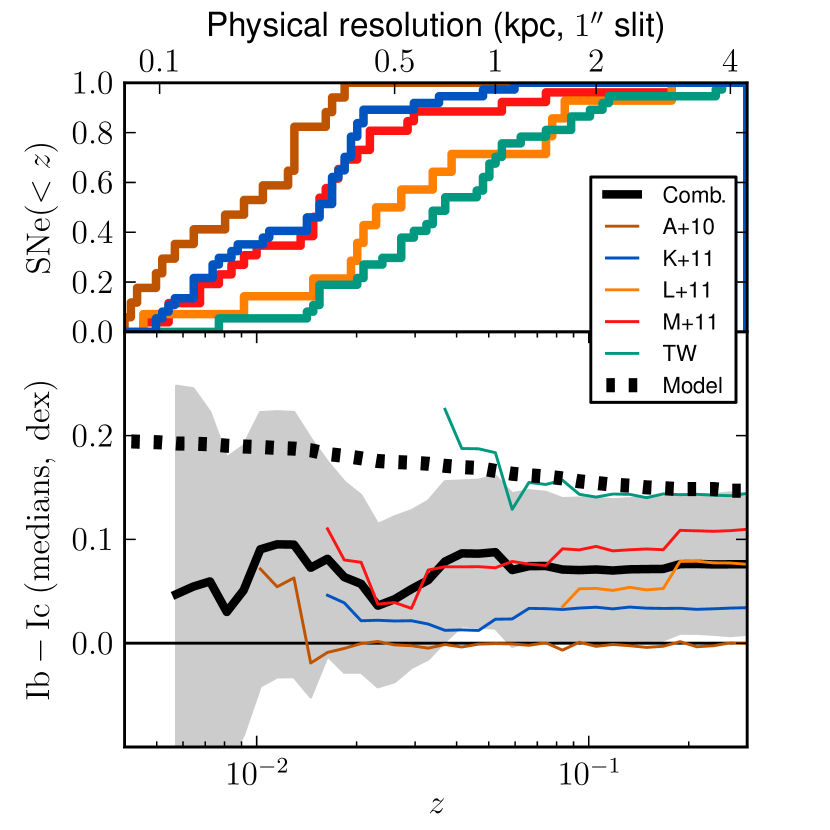
Comparing the model to the existing datasets in Figure 11 suggests that physical resolution is not the limiting factor obscuring a difference in the median metallicity of SN Ib and Ic. The median difference in the combined sample is not greater than dex at any redshift (and always consistent with 0 dex at ), even though the corresponding model suggests that a dex metallicity difference would be preserved in the sample out to . We conclude that limitations due to physical resolution are not sufficient to mask a significant difference between the metallicity distributions of the SN Ib and Ic in the combined sample.
A related issue is the methodological difference between explosion site and galaxy-nucleus spectroscopy. In the combined sample (Section 4), there are 30 SNe which have metallicity estimates at both the galaxy nucleus and explosion site. Figure 12 indicates that nuclear metallicity measurements introduce both a small additional scatter (rms discrepancy of dex) and bias (median difference of dex) relative to explosion site spectroscopy. The sign of the effect is consistent with offset explosion sites being systematically lower-metallicity environments than galaxy nuclei due to galactic metallicity gradients, with the effect strongest among the highest-metallicity host galaxies (nuclear ). In the median the discrepancy between the nuclear and explosion site metallicity measurements is only 0.68 times the uncertainties in the individual metallicity measurements. We do not find evidence for a significant difference between the explosion site versus nuclear metallicity discrepancies of SN Ib and Ic in the combined sample; their medians are different by only 0.03 dex, which is much smaller than the rms.
Simulations of the type illustrated in Figure 9 indicate that the bias and scatter introduced by nuclear spectroscopy should be small for studies of SN Ibc host environments. Introducing an additional dex scatter for all measurements, the sample size necessary to recover a 0.1 dex metallicity difference between SN Ib and Ic increases by only a small amount (%). Introducing a dex bias only for objects with super-solar metallicity (and assuming intrinsic median metallicities of log(O/H)+12 and 8.6 for SN Ib and Ic, respectively), we find a negligible effect on the significance indicated by the KS test. In summary, the combined sample demonstrates that nuclear metallicity measurements can be used as effectively unbiased tracers of SN Ibc progenitor metallicity.
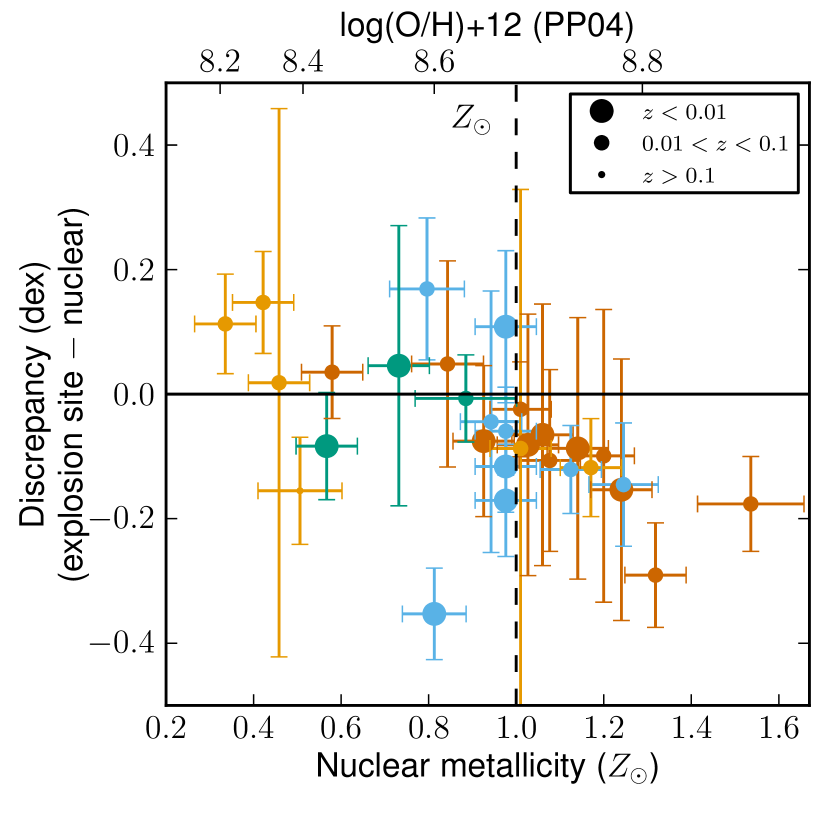
A third issue relating to the isolation of the SN explosion site is the use of photometry to estimate the nuclear galaxy metallicity (e.g. Arcavi et al., 2010), or additionally using a simple metallicity gradient model to estimate the explosion site metallicity (e.g. Boissier & Prantzos, 2009). In either case, photometric metallicity estimates will carry the same scatter as spectroscopic nuclear metallicity measurements ( dex, see above) and an additional uncertainty dex due to the scatter in the relation (see Section 4.5). Assuming a representative dex uncertainty for photometric metallicity estimates and performing the same simulations as in Figure 9, we find that a small (0.1 dex median) metallicity difference between SN Ib and Ic host environments can only be detected with a sample times as large as an equivalent sample of spectroscopic metallicity measurements. Our conclusion that the combined sample of SN Ibc has not revealed a difference between the metallicity distributions of SN Ib and Ic may therefore conflict with the suggestion by Arcavi et al. (2010) that a sample of 18 photometric metallicity measurements for SN Ibc host galaxies could reveal a significant difference.
In summary, the role of explosion site spectroscopy in SN host environment studies is complex. The ability to isolate SN explosion sites is limited for smaller galaxies and at larger redshifts (e.g. those found by untargeted surveys). However, given the significantly larger baseline for making measurements of metallicity distributions offered by untargeted SN searches (Section 5.1), the effect of physical resolution is likely to play a secondary role. Substituting nuclear for explosion site spectroscopy can lead to discrepancies in metallicity of dex, but we find that small differences in metallicity distributions could still be recovered by studies employing nuclear spectroscopy. However, the additional uncertainty introduced by photometric metallicity measurements is larger and may limit the role of these investigations in discovering differences in metallicity distributions, unless sufficient statistical power can be gained by larger sample size.
5.3. Uncertainties in SN classification
The spectral classification of SNe could also potentially effect the metallicity distribution inferred for the host environments of each SN type (see also Section 2).
It is unlikely that a SN Ic would be mistaken for a SN Ib, if the type is designated based on a clear detection of He I lines, but it is possible for a SN Ib to be classified as an SN Ic if the He lines are weak and S/N is poor, or if the He lines have not yet developed at the epoch of spectroscopy (Hamuy et al., 2002a). Misidentifying SN Ib as SN Ic could act to blur any distinctions in the metallicity distribution of their host environments. We evaluate the possibility that this blurring could hide a large ( dex) difference in the metallicity distributions of SN Ib and Ic host environments for a dataset as large as the combined sample using simulations. We randomly draw SN Ib and Ic metallicities from Gaussian distributions with widths of dex and then mis-attribute a certain fraction of the draws to SN Ic. We find that the KS test indicates a statistically significant difference ( at ) unless a large percentage () of SN Ib are mis-classified as SN Ic.
It can be difficult to distinguish normal SN Ib from SN IIb, especially if spectra are not available near peak. There is a diversity in the hydrogen mass surrounding SNe IIb (Chevalier & Soderberg, 2010) and, spectroscopically, SN IIb seem to represent a transitional type between SN Ib and SN II (Milisavljevic et al., 2012). However, Arcavi et al. (2010) have suggested that SN IIb prefer low-mass, low-metallicity host galaxies. It is difficult to reconcile these observations into a consistent progenitor model, but the conclusions of Arcavi et al. (2010) imply that grouping SN Ib and IIb together (as Leloudas et al. 2011 and Modjaz et al. 2011 have done explicitly) could bias downward the metallicity distribution inferred for SN Ib environments.
Similarly, if SN Ic-BL are grouped together with SN Ic, the SN Ic metallicity distribution could also be biased downward (Section 4.3). There is no clear definition of the ejecta velocity or line width that distinguishes SN Ic-BL from SN Ic, and any distinction will strongly depend on the spectroscopy epoch due to the velocity evolution of the photosphere (see e.g. Pian et al., 2006; Sanders et al., 2011).
We have attempted to reduce the effects of SN classification errors by revisiting the SN spectroscopy on a case-by-case basis, rather than relying on the classification reported in the IAUCs, and by separating our dataset based on our degree of confidence in the classifications (Gold and Silver samples; Section 2). Of the previous studies in our combined sample (Section 4), Leloudas et al. (2011) and Modjaz et al. (2011) made similar revisions to SN classifications, while Anderson et al. (2010) and Kelly & Kirshner (2011) have relied on classifications reported in the circulars.
5.4. Selection effects in spectroscopic follow-up
The number of optical transients detected by SN searches often exceeds the resources available for spectroscopic follow-up. For example, because SNe without host galaxies clearly detected in discovery images may be mistaken for non-SN optical transients, the spectroscopic follow-up for some SN searches will be biased against SNe with low-luminosity host galaxies (Drake et al., 2009a). Similarly, some untargeted SN searches such as ESSENCE and SDSS-II have focused on discovering SNe Ia at the exclusion of core-collapse SNe (Sako et al., 2008; Foley et al., 2009). Because the host galaxy properties of SN Ia differ systematically from those of SN Ibc (see e.g. Kelly et al., 2008; Mannucci et al., 2008), this selection effect could influence resulting studies of SN Ibc host environments. Moreover, some optical surveys are less sensitive to SN detection in the central regions of galaxies. However, because the photometric and host galaxy properties of SN Ib and Ic are significantly more similar to other subclasses of SNe, the systematic effects of biases in SN search spectroscopic follow-up is likely to effect SN Ib and Ic in similar ways. Therefore we expect it to be a second order effect influencing the results of this study, likely much smaller than the previous effects discussed.
In a magnitude limited survey, the ratio of SN Ic to Ib has been estimated to be (Li et al., 2011). In our study, this ratio is similar, 1.8, suggesting no significant bias for or against SN Ib or Ic. For comparison, this ratio is 1.4 for Anderson et al. (2010), 2.1 for Kelly & Kirshner (2011), 0.5 for Leloudas et al. (2011), and 1.25 for Modjaz et al. (2011).
SN Ic-BL, comprising of our sample, are over-represented in our sample with respect to galaxy-targeted, volume-limited surveys (e.g. of SN Ibc in LOSS, not including SN IIb, Li et al. 2011). This is a natural consequence of two factors. First, SN Ic-BL typically have brighter peak luminosities than other SNe Ibc ( mag in -band, Drout et al. 2011) and can therefore be discovered over a larger volume in a magnitude-limited survey. Indeed, the median redshift of SNe Ic-BL in our sample () is nearly twice that of the other SNe Ibc in our sample (). Second, we have found that Ic-BL preferentially occur in low-metallicity galaxies that will have preferentially lower luminosities (see also Arcavi et al., 2010; Kelly & Kirshner, 2011). These galaxies are therefore under-represented in galaxy-targeted SN searches, but are not excluded from the untargeted SN searches we draw our sample from. We further note that the percentage of SN IIb in our sample () is similar to the value found by Smartt et al. (2009) among those SN classified and reported in the IAU circulars: of SN Ibc. However, Li et al. (2011) report an SN IIb rate times this value based on SNe found by LOSS. Li et al. (2011) that the LOSS classifications are based primarily on photometry (in particular, identification of the double-peaked SN IIb lightcurve shape), while classifications reported in the circulars are primarily based on single-epoch spectroscopic observations. Finally, we note that any effect due to the cosmic star formation history should be negligible over the modest redshift range () of our sample (Grieco et al., 2012).
An additional systematic effect could act if the host galaxy properties of SN Ibc are found to correlate with the explosion peak magnitude, as has been found for SN Ia (Hamuy et al., 1996). For example, if it were the case that SN Ic-BL in low-mass/metallicity galaxies are brighter than their counterparts in brighter galaxies, they would be over-represented in samples of host galaxy spectroscopy. This potential effect could be evaluated more thoroughly with more extensive studies of SN Ibc lightcurve properties, as the sample size of existing studies are small (Richardson et al., 2006; Drout et al., 2011; Li et al., 2011), or by performing a volume-limited survey. Moreover, dust obscuration could prevent the discovery of a significant fraction of SNe (Mattila et al., 2012), and could potentially be correlated with both host galaxy and explosion properties.
5.5. Depth limits for host galaxy spectroscopy
Due to the galaxy relation, the lowest metallicity galaxies will also have the lowest luminosities, and may therefore be under-represented in spectroscopic studies that require sufficient S/N in the nebular emission lines to derive metallicity. Table 6 indicates that we are potentially excluding 3 SN Ic in low-metallicity hosts from our sample due to insufficient S/N, while we are likely only excluding one such SN Ib. The effect of these exclusions is significant: if we suppose that each of the excluded galaxies falls at the low-metallicity end of the observed distribution, than the median metallicities we measure for the SN [Ib,Ic] in our sample become log(O/H)+12. Considering these excluded galaxies indicates that the median metallicity for SN Ic host environments could be lower than for SN Ib in our sample. Such a revision would not conflict with the results of our statistical tests, which indicate that the difference we measure in the metallicity distributions of SN Ib and Ic host environments is not significant (Section 3.4). This illustrates the role of small number statistics in spectroscopic studies of SN Ibc host environments. Moreover, it advocates for continued follow up of supernova host environments with facilities capable of measuring metallicity for the low-luminosity, relatively high-redshift host galaxies discovered by untargeted SN searches.
6. DISCUSSION
6.1. SN Ib and Ic progenitor models
The new observations presented in this work, and previous observations synthesized in our combined dataset, suggest and constrain differences in the progenitor star population of SNe Ibc. The modest difference observed in the median metallicity of SN Ib and Ic host environments corresponds to a very small difference in mass-loss rates for single star progenitors. In general, the mass loss rates of massive stars is taken to scale as where (Kudritzki et al., 1987) or perhaps for WR winds (Vink & de Koter, 2005). The difference in median metallicity we measure for SN Ib and Ic from explosion site spectroscopy of Gold-classification SNe in our untargeted study (Section 3.3) then corresponds to a difference in mass loss rates of a factor of for the power law slope . If we use instead the median difference inferred from the combined sample using only explosion-site spectroscopy ( Section 4.2), the mass loss rate differs by a factor of . In this simplistic analysis, it seems improbable that this small difference in mass loss rate is sufficient to strip the entire He layer from the progenitor star in order to produce the envelope composition indicated by the spectrum of the explosion.
In more detail, the difference in the SN Ib and Ic metallicity distributions can be interpreted in terms of a metallicity-dependence for the critical initial-mass required for a progenitor star to explode as SN Ib or Ic. Boissier & Prantzos (2009) estimated how this critical mass depends on metallicity by comparing the observed difference in the rates of SN Ib and Ic in different metallicity bins to a model that has an explicit dependence of the threshold mass for SN Ib and Ic explosions. Using photometric metallicity estimates, they find that the critical mass varies by a factor of over a factor of in metallicity. However, our combined dataset indicates that a difference in the metallicity distribution of SN Ib and Ic has yet to be measured robustly (Section 4.2), suggesting that the metallicity-dependence of this critical mass may be much more subtle.
Moreover, the observed relation between galaxy mass, metallicity, and star formation rate implies that metal-poor galaxies typically have higher specific star formation rates (Lara-López et al., 2010; Mannucci et al., 2010). In a single star progenitor model where SN Ic are produced by more massive stars, this could indicate an elevated rate of SN Ic relative to SN Ib in metal-poor galaxies if the star formation events are short-lived. This could potentially mask the effect of metal-line dependent winds. Our measurements of the ages of young stellar populations of SN Ibc host galaxies do not indicate that SN Ic come from younger stellar populations (Section 3.5), but a larger sample is needed to address this question in detail. A metallicity-dependent slope for the initial mass function could also effect SN Ibc rates (Prantzos & Boissier, 2003). Assuming SN Ic progenitors are more massive than those of SN Ib, a top-heavy IMF in low-metallicity environments would elevate the SN Ic/Ib rate and could push the metallicity distribution of SN Ic downward.
Smartt et al. (2009) suggest that luminosity limits from pre-explosion imaging and ejecta masses from light-curve modeling rule out massive WR progenitors for a sample of nearby SN Ibc. However, the SN Ibc studied by Smartt et al. (2009) are primarily in nearby, high-mass host galaxies that are likely to reflect high-metallicity progenitor stars. In essentially all progenitor models, SN Ibc progenitors are expected to be less massive (and less luminous) at higher metallicities. Indeed, the rate of SN Ibc in nearby (), low-metallicity environments is expected to be quite low (at best a few per year), making direct progenitor detection observationally challenging (Young et al., 2008). Moreover, local extinction may play a larger role in obscuring SN progenitor stars than previously recognized (Walmswell & Eldridge, 2012).
Podsiadlowski et al. (1992) suggested that Roche lobe overflow via binary interaction could be responsible for stripping significant amounts of material from the progenitor stars of SN Ibc. Observations of OB stars indicate that a significant percentage of potential Type Ibc SN progenitors are likely to be in interacting binary systems (Kobulnicky & Fryer, 2007; Kouwenhoven et al., 2007; Sana et al., 2012). Eldridge et al. (2008) have shown that the observed metallicity-dependence of the relative rates of SN II and Ibc can be reproduced using binary population synthesis models informed by the observed populations of red supergiants, Wolf-Rayet, and other massive stars. Smith et al. (2011) have argued based on SN rates that the majority of SN Ibc progenitors may come from binary star systems. However, additional modeling is needed to predict the relative metallicity-distribution of SN Ib and Ic that would result from binary progenitor stars. Moreover, the effect of mixing may further complicate the comparison of observations to SN Ibc progenitor models for both single and binary stars (Dessart et al., 2012).
6.2. Comparison to nearby GRB-SNe
In the “collapsar” model, the progenitors of LGRBs found in association with SN Ic-BL (GRB-SNe) are massive stars with high rates of core rotation, implying sub-solar metallicities () in order to minimize angular momentum losses due to line-driven winds (Woosley & Bloom, 2006). The observational result that most LGRBs and GRB-SNe are discovered in dwarf, sub-solar metallicity galaxies has been interpreted as evidence supporting this model (Fruchter et al., 2006; Stanek et al., 2006; Levesque et al., 2010a). Because SN Ic-BL have traditionally been found in higher-metallicity environments, a “cut-off” metallicity has been proposed to distinguish stars which will produce GRB-SNe from those that will produce non-relativistic SN Ic-BL (Modjaz et al., 2008; Kocevski et al., 2009).
However, several discoveries have challenged the role of metallicity in the production of LGRBs. LGRBs and relativistic, engine-driven SNe have been found in super-solar metallicity environments (Berger et al., 2007; Levesque et al., 2010d; Soderberg et al., 2010b; Levesque et al., 2010b; Graham et al., 2009). Moreover, SN Ic-BL with strong limits on the association of relativistic ejecta have been found in sub-solar metallicity environments (see e.g. Sanders et al., 2011). This shift in the discovery environments of GRBs and SN Ic-BL can be explained in terms of the transient search strategy — GRBs are discovered via their gamma-ray emission through untargeted searches, while past studies of SN Ibc host environments drew primarily from galaxy-targeted searches, which are heavily biased towards higher-metallicity host environments (see Section 5.1). The advent of wide-field, untargeted SN searches has enabled the discovery of SN Ic-BL in sub-solar metallicity environments. Indeed, the results from this work and Kelly & Kirshner (2011) demonstrate that SN Ic-BL preferentially occur in lower-metallicity environments than SN Ib or Ic (see Section 3.3 and Section 4.3).
Alternatively, the observed metallicity distribution of LGRB host environments has been interpreted as a secondary manifestation of a preference for high-star formation rate environments (Kocevski & West, 2011; Mannucci et al., 2011). Our results are consistent with this view. In Section 3.5 we found that SN Ic-BL host environments potentially have younger stellar populations than those of other SN Ibc and more similar to nearby LGRBs. In Section 3.3 we find that the untargeted SN Ic-BL in our sample have a median metallicity dex higher than that of the nearby LGRBs (), but given the small size of both samples ( and 7, respectively), the KS test indicates no significant difference between the distributions ().
In summary, observations of SNe discovered by untargeted searches have substantially reduced the discrepancy reported between the metallicity distribution of SN Ic-BL with and without associated LGRBs, while verifying a shared preference for environments with high-star formation rates and/or very young stellar populations. These findings are consistent with the view that massive stars () are the common progenitor for both these types of explosions, but suggest that metallicity does not play the primary role in the formation of a central engine. Similarly, Levesque et al. (2010e) have found that host environment metallicity does not correlate to the gamma-ray energy release of LGRBs. Georgy et al. (2012) have suggested, using the models of Ekström et al. (2012), that differential rotation in LGRB progenitors could moderate the coupling between WR winds and the stellar core and may be responsible for reducing the role of metallicity in the explosion.
6.3. Studies of SN Ibc in the LSST era
In the coming years, the discovery rate for SNe promises to grow dramatically as existing high-cadence, wide field surveys continue to operate and new surveys such as the Dark Energy Survey and the Large Synoptic Survey Telescope (LSST) come online. As LSST could discover SNe per year, it is anticipated that the SN discovery rate in this era will far outstrip the capacity to perform spectroscopic follow-up on individual objects (LSST Science Collaborations et al., 2009). This significant increase in the SN discovery rate could permit studies of untargeted SN Ibc host environments with sample sizes sufficient to detect even small ( dex) differences in the SN Ib and Ic metallicity distributions without statistical ambiguity. We suggest that a sample of such objects would be required for that purpose (see Section 4.2), but caution that attention must continue to be paid to the systematic effects discussed in Section 5.
Moreover, such an SN discovery rate suggests that SN classification will become the limiting factor for certain science goals. Investigating the GRB-SN connection will be more difficult if a sample of well-classified SN Ic-BL cannot be identified. In SN Ia samples for precision cosmology that are assembled using light curve-based classification alone, SN Ibc may be major contaminants () because their light curve shape resembles that of SN Ia (Gong et al., 2010; Kessler et al., 2010; Gjergo et al., 2012). The potential for ambiguity between SN Ia and SN Ibc light curves is especially great in the case of SN Ic-BL, because the average absolute peak magnitude is more similar to SN Ia than for normal SN Ib or Ic (Drout et al., 2011).
We therefore suggest that information about the distribution of host galaxy properties for SN Ia and Ibc could be used to inform photometric SN classification in the LSST era. Because SN Ic-BL preferentially occur in lower luminosity, lower metallicity host galaxies than other SN Ibc or SN Ia (Li et al., 2011; Kelly & Kirshner, 2011), the difference in flux between the SN and the host galaxy could be used to distinguish SN Ic-BL from other SN types for the dual purposes of 1) identifying SN Ic-BL for follow-up SN studies and 2) filtering SN Ibc from samples of SN Ia for precision cosmology. However, a study using information about the host galaxy distribution to inform SN classification would sacrifice the ability to make unbiased inferences about the properties of the host galaxy populations (similar to the case of galaxy-targeted SN surveys) and could introduce systematic effects if used to construct samples for SN Ia cosmology. Moreover, it would also exclude events with unexpected properties, such as the engine-driven Type Ic-BL SN 2009bb that exploded in a luminous, high-metallicity host galaxy (Levesque et al., 2010c).
7. CONCLUSIONS
We have presented the largest study to date of SN Ibc host environments unbiased with respect to the galaxy relation as imposed by galaxy-targeted SN searches. By reporting metallicity measurements for 50 objects, we more than double the number of host environment metallicity measurements for SN Ibc discovered by untargeted surveys.
We conclude that:
-
1.
SN Ibc host environments discovered through targeted surveys are significantly biased towards higher metallicities, representing host environments that are typically more enriched by 24%. The ratio of low-metallicity () host environments probed by untargeted versus targeted SN searches is , and galaxy-targeted SN searches offer a smaller baseline for probing metallicity distribution differences.
-
2.
In our own sample and combining observations from all spectroscopic studies of SN Ibc host environments to date, we find no statistical difference between the metallicity distributions of SN Ib and Ic or between SN Ib and IIb. We place a limit on the median metallicity difference between SN Ib and Ic ( dex) and find that a sample as large would be required to unambiguously confirm a difference at that level. This limit corresponds to a very small difference in the mass loss rate of metal line-driven winds, suggesting that it may not be the dominant factor distinguishing SN Ib and Ic progenitors.
-
3.
SN Ic-BL are found in host environments with substantially lower metallicity than SN Ic, confirming the result of Kelly & Kirshner (2011). We show that the median metallicity of SN Ic-BL found by untargeted SN searches is dex lower than those found by targeted SN searches, yielding closer agreement to LGRB host environments. Moreover, the young stellar populations of SN Ic-BL appear to be lower than SN Ib and Ic, but the sample is not large enough to be significant.
-
4.
Evaluating the systematic effects afflicting studies of SN Ibc host environment metallicities, we find that the bias introduced by galaxy-targeted SN searches is most significant. Galaxy-nucleus spectroscopy can serve as a good proxy for explosion site metallicity measurements, but studies using photometric metallicity estimates would require sample sizes times larger. Biases in spectroscopic follow-up of SNe discovered by optical transient searches and uncertainties in SN classification play smaller roles.
In the era of wide-field, untargeted SN searches, we anticipate that significant progress will be made towards unveiling the progenitors of SN Ibc through the study of their host environments. We advocate for continued spectroscopic studies of the host environments of SN Ibc discovered by untargeted surveys to uncover or place stricter limits on the difference in the metallicity distribution of SN Ib and Ic. Optical facilities with large light-gathering power are required to measure metallicities in the low-luminosity, relatively high-redshift galaxies hosting SNe discovered by untargeted surveys. To identify SN Ic-BL in this era and make progress on the GRB-SN connection in the face of limited resources for spectroscopic follow up, we suggest that host galaxy properties will become a significant aid to future photometric SN classification schemes.
References
- Aldering et al. (2002) Aldering, G., et al. 2002, in Society of Photo-Optical Instrumentation Engineers (SPIE) Conference Series, Vol. 4836, Society of Photo-Optical Instrumentation Engineers (SPIE) Conference Series, ed. J. A. Tyson & S. Wolff, 61–72
- Allen et al. (1976) Allen, D. A., Wright, A. E., & Goss, W. M. 1976, MNRAS, 177, 91
- Anderson et al. (2010) Anderson, J. P., Covarrubias, R. A., James, P. A., Hamuy, M., & Habergham, S. M. 2010, MNRAS, 407, 2660
- Anderson & James (2009) Anderson, J. P., & James, P. A. 2009, MNRAS, 399, 559
- Arcavi et al. (2010) Arcavi, I., et al. 2010, ApJ, 721, 777
- Baldwin et al. (1981) Baldwin, J. A., Phillips, M. M., & Terlevich, R. 1981, PASP, 93, 5
- Berger et al. (2007) Berger, E., Fox, D. B., Kulkarni, S. R., Frail, D. A., & Djorgovski, S. G. 2007, ApJ, 660, 504
- Blondin et al. (2006) Blondin, S., Modjaz, M., Kirshner, R., Challis, P., & Calkins, M. 2006, Central Bureau Electronic Telegrams, 699, 1
- Blondin & Tonry (2007) Blondin, S., & Tonry, J. L. 2007, ApJ, 666, 1024
- Boissier & Prantzos (2009) Boissier, S., & Prantzos, N. 2009, A&A, 503, 137
- Bresolin (2011) Bresolin, F. 2011, ApJ, 730, 129
- Brinchmann et al. (2004) Brinchmann, J., Charlot, S., White, S. D. M., Tremonti, C., Kauffmann, G., Heckman, T., & Brinkmann, J. 2004, MNRAS, 351, 1151
- Cardelli et al. (1989) Cardelli, J. A., Clayton, G. C., & Mathis, J. S. 1989, ApJ, 345, 245
- Cenko et al. (2010) Cenko, S. B., Cobb, B. E., Kleiser, I. K., & Filippenko, A. V. 2010, Central Bureau Electronic Telegrams, 2208, 2
- Challis et al. (2007) Challis, P., Blondin, S., Matheson, T., Foley, R., Rodney, S., Leibundgut, B., & Spyromilio, J. 2007, Central Bureau Electronic Telegrams, 830, 1
- Chevalier & Soderberg (2010) Chevalier, R. A., & Soderberg, A. M. 2010, ApJ, 711, L40
- Chornock et al. (2010) Chornock, R., et al. 2010, ArXiv e-prints, 1004.2262
- Ciabattari et al. (2011) Ciabattari, F., Mazzoni, E., Koff, R. A., Tomasella, L., Pastorello, A., Valenti, S., & Benetti, S. 2011, Central Bureau Electronic Telegrams, 2938, 1
- Clocchiatti et al. (1996) Clocchiatti, A., Wheeler, J. C., Benetti, S., & Frueh, M. 1996, ApJ, 459, 547
- Corsi et al. (2011) Corsi, A., et al. 2011, ArXiv e-prints, 1101.4208
- Corsi et al. (2012) ——. 2012, ApJ, 747, L5
- Delahaye & Pinsonneault (2006) Delahaye, F., & Pinsonneault, M. H. 2006, ApJ, 649, 529
- Denisenko et al. (2011) Denisenko, V., Gerke, V., Novichonok, A., Korotkiy, S., Tomasella, L., Pastorello, A., Valenti, S., & Benetti, S. 2011, Central Bureau Electronic Telegrams, 2932, 1
- Dessart et al. (2012) Dessart, L., Hillier, D. J., Li, C., & Woosley, S. 2012, ArXiv e-prints, 1205.5349
- Dessart et al. (2011) Dessart, L., Hillier, D. J., Livne, E., Yoon, S.-C., Woosley, S., Waldman, R., & Langer, N. 2011, MNRAS, 414, 2985
- Dimai (2008) Dimai, A. 2008, Central Bureau Electronic Telegrams, 1269, 1
- Dintinjana et al. (2011) Dintinjana, B., et al. 2011, Central Bureau Electronic Telegrams, 2906, 1
- Drake et al. (2009a) Drake, A. J., et al. 2009a, ApJ, 696, 870
- Drake et al. (2011a) ——. 2011a, Central Bureau Electronic Telegrams, 2645, 1
- Drake et al. (2011b) ——. 2011b, Central Bureau Electronic Telegrams, 2733, 2
- Drake et al. (2009b) Drake, A. J., Djorgovski, S. G., Williams, R., Mahabal, A., Graham, M. J., Catelan, M., Beshore, E. C., & Larson, S. M. 2009b, Central Bureau Electronic Telegrams, 1681, 1
- Drout et al. (2011) Drout, M. R., et al. 2011, ApJ, 741, 97
- Ekström et al. (2012) Ekström, S., et al. 2012, A&A, 537, A146
- Eldridge et al. (2008) Eldridge, J. J., Izzard, R. G., & Tout, C. A. 2008, MNRAS, 384, 1109
- Elias et al. (1985) Elias, J. H., Matthews, K., Neugebauer, G., & Persson, S. E. 1985, ApJ, 296, 379
- Fabbiano et al. (2004) Fabbiano, G., et al. 2004, ApJ, 605, L21
- Filippenko (1997) Filippenko, A. V. 1997, ARA&A, 35, 309
- Filippenko & Chornock (2003) Filippenko, A. V., & Chornock, R. 2003, IAU Circ., 8158, 4
- Filippenko & Sargent (1985) Filippenko, A. V., & Sargent, W. L. W. 1985, Nature, 316, 407
- Folatelli & Stritzinger (2010) Folatelli, G., & Stritzinger, M. 2010, Central Bureau Electronic Telegrams, 2279, 1
- Foley et al. (2009) Foley, R. J., et al. 2009, AJ, 137, 3731
- Frieman et al. (2008) Frieman, J. A., et al. 2008, AJ, 135, 338
- Fruchter et al. (2006) Fruchter, A. S., et al. 2006, Nature, 441, 463
- Fryer et al. (2007) Fryer, C. L., et al. 2007, PASP, 119, 1211
- Garnett (1992) Garnett, D. R. 1992, AJ, 103, 1330
- Georgy et al. (2012) Georgy, C., Ekström, S., Meynet, G., Massey, P., Levesque, E. M., Hirschi, R., Eggenberger, P., & Maeder, A. 2012, ArXiv e-prints, 1203.5243
- Gjergo et al. (2012) Gjergo, E., Duggan, J., Cunningham, J. D., Kuhlmann, S., Biswas, R., Kovacs, E., Bernstein, J. P., & Spinka, H. 2012, ArXiv e-prints, 1205.1480
- Gong et al. (2010) Gong, Y., Cooray, A., & Chen, X. 2010, ApJ, 709, 1420
- Graham et al. (2009) Graham, J. F., Fruchter, A. S., Kewley, L. J., Levesque, E. M., Levan, A. J., Tanvir, N. R., Reichart, D. E., & Nysewander, M. 2009, in American Institute of Physics Conference Series, Vol. 1133, American Institute of Physics Conference Series, ed. C. Meegan, C. Kouveliotou, & N. Gehrels, 269–272
- Grieco et al. (2012) Grieco, V., Matteucci, F., Meynet, G., Longo, F., Della Valle, M., & Salvaterra, R. 2012, ArXiv e-prints, 1204.2417
- Habergham et al. (2012) Habergham, S. M., James, P. A., & Anderson, J. P. 2012, eprint arXiv:1205.6732
- Hachinger et al. (2012) Hachinger, S., Mazzali, P. A., Taubenberger, S., Hillebrandt, W., Nomoto, K., & Sauer, D. N. 2012, ArXiv e-prints, 1201.1506
- Hadjiyska et al. (2011) Hadjiyska, E. I., Rabinowitz, D., Baltay, C., Zinn, R., Coppi, P., Ellman, N., & Miller, L. R. 2011, in Bulletin of the American Astronomical Society, Vol. 43, American Astronomical Society Meeting Abstracts 217, 433.18
- Hamuy et al. (2002a) Hamuy, M., et al. 2002a, AJ, 124, 417
- Hamuy et al. (2003) Hamuy, M., Phillips, M., & Maza, J. 2003, IAU Circ., 8059, 3
- Hamuy et al. (1996) Hamuy, M., Phillips, M. M., Suntzeff, N. B., Schommer, R. A., Maza, J., & Aviles, R. 1996, AJ, 112, 2391
- Hamuy et al. (2002b) Hamuy, M., Roth, M., & Morrell, N. 2002b, IAU Circ., 8037, 2
- Iwamoto et al. (1998) Iwamoto, K., et al. 1998, Nature, 395, 672
- Kauffmann et al. (2003) Kauffmann, G., et al. 2003, MNRAS, 346, 1055
- Kelly & Kirshner (2011) Kelly, P. L., & Kirshner, R. P. 2011, ArXiv e-prints, 1110.1377
- Kelly et al. (2008) Kelly, P. L., Kirshner, R. P., & Pahre, M. 2008, ApJ, 687, 1201
- Kessler et al. (2010) Kessler, R., et al. 2010, PASP, 122, 1415
- Kewley & Dopita (2002) Kewley, L. J., & Dopita, M. A. 2002, ApJS, 142, 35
- Kewley & Ellison (2008) Kewley, L. J., & Ellison, S. L. 2008, ApJ, 681, 1183
- Kobulnicky & Fryer (2007) Kobulnicky, H. A., & Fryer, C. L. 2007, ApJ, 670, 747
- Kocevski & West (2011) Kocevski, D., & West, A. A. 2011, ApJ, 735, L8+
- Kocevski et al. (2009) Kocevski, D., West, A. A., & Modjaz, M. 2009, ApJ, 702, 377
- Kouwenhoven et al. (2007) Kouwenhoven, M. B. N., Brown, A. G. A., Portegies Zwart, S. F., & Kaper, L. 2007, A&A, 474, 77
- Kudritzki et al. (1987) Kudritzki, R. P., Pauldrach, A., & Puls, J. 1987, A&A, 173, 293
- Kulkarni et al. (1998) Kulkarni, S. R., et al. 1998, Nature, 395, 663
- Kunth & Sargent (1981) Kunth, D., & Sargent, W. L. W. 1981, A&A, 101, L5
- Lara-López et al. (2010) Lara-López, M. A., et al. 2010, A&A, 521, L53+
- Law et al. (2009) Law, N. M., et al. 2009, PASP, 121, 1395
- Leibundgut et al. (1991) Leibundgut, B., Kirshner, R., Huchra, J., & Daugherty, D. 1991, IAU Circ., 5237, 2
- Leloudas et al. (2011) Leloudas, G., et al. 2011, ArXiv e-prints, 1102.2249
- Levesque et al. (2010a) Levesque, E. M., Berger, E., Kewley, L. J., & Bagley, M. M. 2010a, AJ, 139, 694
- Levesque et al. (2010b) Levesque, E. M., Kewley, L. J., Graham, J. F., & Fruchter, A. S. 2010b, ApJ, 712, L26
- Levesque et al. (2010c) Levesque, E. M., et al. 2010c, ApJ, 709, L26
- Levesque et al. (2010d) ——. 2010d, ApJ, 709, L26
- Levesque et al. (2010e) Levesque, E. M., Soderberg, A. M., Kewley, L. J., & Berger, E. 2010e, ApJ, 725, 1337
- Li et al. (2011) Li, W., et al. 2011, MNRAS, 412, 1441
- López-Sánchez & Esteban (2010a) López-Sánchez, Á. R., & Esteban, C. 2010a, A&A, 516, A104
- López-Sánchez & Esteban (2010b) ——. 2010b, A&A, 517, A85+
- LSST Science Collaborations et al. (2009) LSST Science Collaborations, et al. 2009, ArXiv e-prints, 0912.0201
- MacFadyen et al. (2001) MacFadyen, A. I., Woosley, S. E., & Heger, A. 2001, ApJ, 550, 410
- Magill et al. (2011) Magill, L., Kotak, R., & Nielsen, M. B. 2011, Central Bureau Electronic Telegrams, 2853, 1
- Mannucci et al. (2010) Mannucci, F., Cresci, G., Maiolino, R., Marconi, A., & Gnerucci, A. 2010, MNRAS, 408, 2115
- Mannucci et al. (2008) Mannucci, F., Maoz, D., Sharon, K., Botticella, M. T., Della Valle, M., Gal-Yam, A., & Panagia, N. 2008, MNRAS, 383, 1121
- Mannucci et al. (2011) Mannucci, F., Salvaterra, R., & Campisi, M. A. 2011, MNRAS, 439
- Marion et al. (2011) Marion, G. H., Challis, P., & Berlind, P. 2011, Central Bureau Electronic Telegrams, 2627, 2
- Marion et al. (2010) Marion, G. H., Vinko, J., Wheeler, J. C., & Shetrone, M. 2010, Central Bureau Electronic Telegrams, 2270, 1
- Mattila et al. (2012) Mattila, S., et al. 2012, eprint arXiv:1206.1314
- McNaught & McKenzie (1991) McNaught, R. H., & McKenzie, P. 1991, IAU Circ., 5237, 2
- Meynet et al. (1994) Meynet, G., Maeder, A., Schaller, G., Schaerer, D., & Charbonnel, C. 1994, A&AS, 103, 97
- Miknaitis et al. (2007) Miknaitis, G., et al. 2007, ApJ, 666, 674
- Milisavljevic et al. (2012) Milisavljevic, D., et al. 2012, ArXiv e-prints, 1207.2152
- Milisavljevic et al. (2011) Milisavljevic, D., Parrent, J., & Fesen, R. 2011, Central Bureau Electronic Telegrams, 2650, 2
- Modjaz et al. (2011) Modjaz, M., Kewley, L., Bloom, J. S., Filippenko, A. V., Perley, D., & Silverman, J. M. 2011, ApJ, 731, L4+
- Modjaz et al. (2008) Modjaz, M., et al. 2008, AJ, 135, 1136
- Moran et al. (2012) Moran, S. M., et al. 2012, ApJ, 745, 66
- Narla et al. (2011) Narla, A., et al. 2011, Central Bureau Electronic Telegrams, 2627, 1
- Odewahn & Terrazas (2007) Odewahn, S. C., & Terrazas, E. 2007, Central Bureau Electronic Telegrams, 953, 1
- Oksanen (2008) Oksanen, A. 2008, Central Bureau Electronic Telegrams, 1635, 1
- Osterbrock & Ferland (2006) Osterbrock, D. E., & Ferland, G. J. 2006, Astrophysics of gaseous nebulae and active galactic nuclei, ed. Osterbrock, D. E. & Ferland, G. J.
- Patil et al. (2010) Patil, A., Huard, D., & Fonnesbeck, C. 2010, Journal of Statistical Software, 35, 1
- Pettini & Pagel (2004) Pettini, M., & Pagel, B. E. J. 2004, MNRAS, 348, L59
- Pian et al. (2006) Pian, E., et al. 2006, Nature, 442, 1011
- Pignata et al. (2009) Pignata, G., et al. 2009, in American Institute of Physics Conference Series, Vol. 1111, American Institute of Physics Conference Series, ed. G. Giobbi, A. Tornambe, G. Raimondo, M. Limongi, L. A. Antonelli, N. Menci, & E. Brocato, 551–554, 0812.4923
- Pilyugin (2001) Pilyugin, L. S. 2001, A&A, 374, 412
- Pilyugin & Thuan (2005) Pilyugin, L. S., & Thuan, T. X. 2005, ApJ, 631, 231
- Podsiadlowski et al. (1992) Podsiadlowski, P., Joss, P. C., & Hsu, J. J. L. 1992, ApJ, 391, 246
- Prantzos & Boissier (2003) Prantzos, N., & Boissier, S. 2003, A&A, 406, 259
- Prieto (2011) Prieto, J. L. 2011, Central Bureau Electronic Telegrams, 2704, 2
- Prieto et al. (2008) Prieto, J. L., Stanek, K. Z., & Beacom, J. F. 2008, ApJ, 673, 999
- Quimby et al. (2006) Quimby, R., Mondol, P., Castro, F., Roman, B., & Rostopchin, S. 2006, IAU Circ., 8657, 1
- Quimby et al. (2007) Quimby, R., Odewahn, S. C., Terrazas, E., Rau, A., & Ofek, E. O. 2007, Central Bureau Electronic Telegrams, 953, 1
- Richardson et al. (2006) Richardson, D., Branch, D., & Baron, E. 2006, AJ, 131, 2233
- Riello et al. (2004a) Riello, M., et al. 2004a, IAU Circ., 8296, 3
- Riello et al. (2004b) Riello, M., Benetti, S., Cappellaro, E., Patat, F., Botticella, M. T., Turatto, M., & Valenti, S. 2004b, IAU Circ., 8352, 2
- Rosolowsky & Simon (2008) Rosolowsky, E., & Simon, J. D. 2008, ApJ, 675, 1213
- Sahu et al. (2011) Sahu, D. K., Gurugubelli, U. K., Anupama, G. C., & Nomoto, K. 2011, MNRAS, 413, 2583
- Sako et al. (2008) Sako, M., et al. 2008, AJ, 135, 348
- Sana et al. (2012) Sana, H., et al. 2012, Science, 337, 444
- Sand et al. (2009) Sand, D., et al. 2009, Central Bureau Electronic Telegrams, 1894, 1
- Sanders et al. (2012) Sanders, N. E., Caldwell, N., McDowell, J. C., & Harding, P. 2012, ArXiv e-prints, 1209.2251
- Sanders et al. (2011) Sanders, N. E., et al. 2011, ArXiv e-prints, 1110.2363
- Schaerer et al. (1999) Schaerer, D., Contini, T., & Pindao, M. 1999, A&AS, 136, 35
- Schaerer & Vacca (1998) Schaerer, D., & Vacca, W. D. 1998, ApJ, 497, 618
- Schlafly & Finkbeiner (2011) Schlafly, E. F., & Finkbeiner, D. P. 2011, ApJ, 737, 103
- Shaw & Dufour (1994) Shaw, R. A., & Dufour, R. J. 1994, in Astronomical Society of the Pacific Conference Series, Vol. 61, Astronomical Data Analysis Software and Systems III, ed. D. R. Crabtree, R. J. Hanisch, & J. Barnes, 327–+
- Shi et al. (2006) Shi, F., Kong, X., & Cheng, F. Z. 2006, A&A, 453, 487
- Silverman et al. (2007) Silverman, J. M., Chornock, R., & Filippenko, A. V. 2007, Central Bureau Electronic Telegrams, 909, 1
- Silverman et al. (2010) Silverman, J. M., Kandrashoff, M. T., & Filippenko, A. V. 2010, Central Bureau Electronic Telegrams, 2272, 1
- Silverman et al. (2008) Silverman, J. M., Modjaz, M., George, M. R., & Filippenko, A. V. 2008, Central Bureau Electronic Telegrams, 1503, 1
- Skvarc & Mikuz (2008) Skvarc, J., & Mikuz, H. 2008, Central Bureau Electronic Telegrams, 1493, 1
- Smartt (2009) Smartt, S. J. 2009, ARA&A, 47, 63
- Smartt et al. (2009) Smartt, S. J., Eldridge, J. J., Crockett, R. M., & Maund, J. R. 2009, MNRAS, 395, 1409
- Smith et al. (2011) Smith, N., Li, W., Filippenko, A. V., & Chornock, R. 2011, MNRAS, 412, 1522
- Smith et al. (2012) Smith, N., Mauerhan, J. C., Silverman, J. M., Ganeshalingam, M., Filippenko, A. V., Cenko, S. B., Clubb, K. I., & Kandrashoff, M. 2012, ArXiv e-prints, 1204.0043
- Soderberg et al. (2010a) Soderberg, A. M., et al. 2010a, Nature, 463, 513
- Soderberg et al. (2010b) ——. 2010b, Nature, 463, 513
- Soderberg et al. (2006) ——. 2006, Nature, 442, 1014
- Stanek et al. (2006) Stanek, K. Z., et al. 2006, Acta Astron., 56, 333
- Stasińska (2002) Stasińska, G. 2002, ArXiv Astrophysics e-prints
- Stasińska & Leitherer (1996) Stasińska, G., & Leitherer, C. 1996, ApJS, 107, 661
- Steele et al. (2008) Steele, T. N., Silverman, J. M., Ganeshalingam, M., Lee, N., Li, W., & Filippenko, A. V. 2008, Central Bureau Electronic Telegrams, 1275, 1
- Stoll et al. (2012) Stoll, R., Prieto, J. L., Stanek, K. Z., & Pogge, R. W. 2012, ArXiv e-prints, 1205.2338
- Stritzinger et al. (2008a) Stritzinger, M., Folatelli, G., Pignata, G., Forster, F., & Hamuy, M. 2008a, Central Bureau Electronic Telegrams, 1540, 1
- Stritzinger et al. (2008b) Stritzinger, M., Lira, P., & Pignata, G. 2008b, Central Bureau Electronic Telegrams, 1629, 2
- Tremonti et al. (2004) Tremonti, C. A., et al. 2004, ApJ, 613, 898
- Uomoto & Kirshner (1985) Uomoto, A., & Kirshner, R. P. 1985, A&A, 149, L7
- Valenti et al. (2011) Valenti, S., et al. 2011, MNRAS, 416, 3138
- Vink & de Koter (2005) Vink, J. S., & de Koter, A. 2005, A&A, 442, 587
- Walmswell & Eldridge (2012) Walmswell, J. J., & Eldridge, J. J. 2012, MNRAS, 419, 2054
- Wheeler & Levreault (1985) Wheeler, J. C., & Levreault, R. 1985, ApJ, 294, L17
- Woosley & Bloom (2006) Woosley, S. E., & Bloom, J. S. 2006, ARA&A, 44, 507
- Woosley & Heger (2006) Woosley, S. E., & Heger, A. 2006, ApJ, 637, 914
- Woosley et al. (2002) Woosley, S. E., Heger, A., & Weaver, T. A. 2002, Reviews of Modern Physics, 74, 1015
- Woosley et al. (1995) Woosley, S. E., Langer, N., & Weaver, T. A. 1995, ApJ, 448, 315
- Yoon et al. (2010) Yoon, S.-C., Woosley, S. E., & Langer, N. 2010, ApJ, 725, 940
- Young et al. (2008) Young, D. R., Smartt, S. J., Mattila, S., Tanvir, N. R., Bersier, D., Chambers, K. C., Kaiser, N., & Tonry, J. L. 2008, A&A, 489, 359
- Young et al. (2010) Young, D. R., et al. 2010, A&A, 512, A70+
- Zaritsky et al. (1994) Zaritsky, D., Kennicutt, Jr., R. C., & Huchra, J. P. 1994, ApJ, 420, 87