A van der Waals density functional study of chloroform and bromoform on graphene
Abstract
A calculational study of the trihalomethanes chloroform (CHCl3) and bromoform (CHBr3) adsorbed on graphene is presented. The study uses the van der Waals density functional method vdW-DF to obtain adsorption energies and adsorption structures for these molecules of environmental concern. In this study chloroform is found to adsorb with the H atom pointing away from graphene, with adsorption energy 357 meV (34.4 kJ/mol). For bromoform the calculated adsorption energy is 404 meV (39.0 kJ/mol). The corrugation of graphene as seen by chloroform is small, the difference in adsorption energy along the graphene plane is less than 6 meV.
pacs:
31.15.E-,71.15.Mb,71.15.NcI Introduction
Trihalomethane (THM) molecules are small molecules that are similar to methane (CH4) but with three of the H atoms replaced by halogens (F, Cl, Br, I, At). The most welknown THM is trichloromethane (CHCl3), also known as chloroform. THMs are of environmental concern as they are toxic to human health tox ; tox2 . The human body adsorbs THMs by inhalation and by passage through the skin, but the main contribution to human exposure arises from the consumption of chlorinated drinking water 2006-report .
Of the THMs, chloroform is found in the highest concentration in the environment. Chlorine used for water disinfection reacts with organic material in the water, forming a number of THMs as byproducts: mainly chloroform, but also THMs with one or more Br atoms. The THMs toxity motivates a search for an effective process for selective extraction. Carbon materials, such as activated carbon or carbon nanotubes are used or have been suggested for the use in adsorbing filters for removing THMs from the drinking water after the disinfection, but before intake 2006-report ; girao .
We here study how a chloroform molecule adsorbs on the simplest of carbon materials, graphene. By use of density functional theory (DFT) calculations we determine the energy gained at adsorption and compare with the adsorption energies of similar molecules, like methane and tribromomethane (CHBr3), also called bromoform. For these calculations we apply the first-principles van der Waals (vdW) density-functional method vdW-DF Dion ; Thonhauser .
Chloroform on carbon materials has previously been studied in a few studies by use of theory. DFT has been used for chloroform on benzene in a study employing the vdW-DF method hooper and for a study of chloroform on carbon nanotubes with use of the local density approximation (LDA) girao . For experiments, there is a century long tradition of studies of chloroform because it was frequently used as a solvent and as an anasthetic. However, adsorption studies on carbon materials, provinding adsorption (or desorption) energies, are more recent hertel ; girao ; rybolt .
The outline of the rest of the paper is as follows: In Section II we describe the computational method and our system of chloroform and graphene. In Section III we present our results and discussions, and Section IV contains our summary.
II Method of computation
THMs are molecules with a central C atom and four other atoms surrounding the C atom approximately evenly distributed. Of these, one atom is an H atom and the three other atoms are halogens. In this paper we analyze the adsorption on graphene of chloroform and bromoform, for which the three halogen atoms are Cl or Br atoms, respectively.
We use DFT with the vdW-DF method Dion ; Thonhauser to determine the adsorption energy and atomic structure. Our calculations are carried out fully self-consistently Thonhauser . We use the DFT code GPAW gpaw with vdW-DF Dion ; Thonhauser in a Fast-Fourier-Transform implementation soler . The GPAW code is an all-electron DFT code based on projector augmented waves Blochl (PAW).
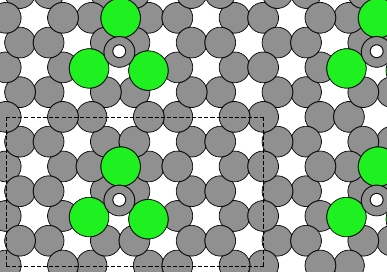
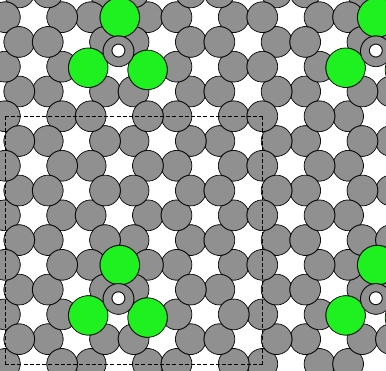
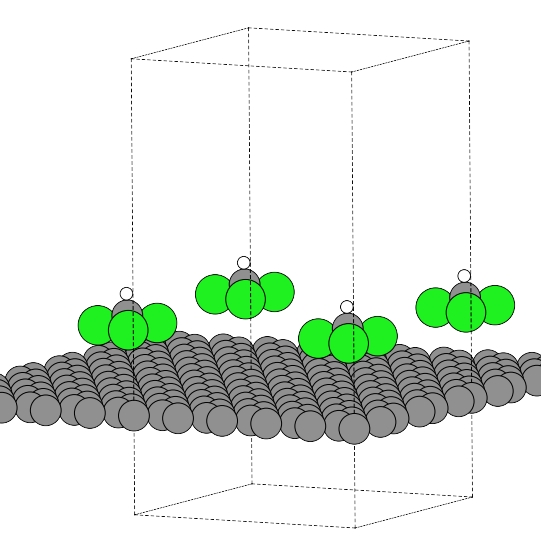
Figure 1 illustrates the adsorbed chloroform molecule on graphene, and the periodically repeated orthorhombic unit cells used in our calculations. We show the adsorption configuration that has the H atom pointing away from graphene. A previous vdW-DF study hooper of chloroform with benzene discussed the C-H/ interaction in a dimer with the H atom of chloroform pointing towards the center of the aromatic benzene ring. In order to connect to that study we also carry out calculations with the H atom pointing towards graphene and find that configuration to have a smaller (less favorable) adsorption energy than configurations with the H atom pointing away from graphene. In this work we therefore focus on adsorption configurations with Cl (or Br) atoms closest to graphene as shown in Figure 1.
We define the adsorption energy as the difference in total energy when the molecule is adsorbed on graphene () and when it is in the gas phase far away from graphene ()
| (1) |
Here we follow the sign convention that yields positive values of for systems that bind. The two total-energy terms in (1) are both calculated with the adsorbant and graphene within one unit cell, the unit cell having the same size in both calculations.111In previous work the change of the adsorbant structure from the deformed structure (after removal from graphene) into the gas phase structure was sometimes nalkanes calculated with a GGA approximation of because that approximation is less sensitive to changes in grid positions nalkanes ; PAHgg ; PAHgraphite . However, with the fine real-space grid used here and the rather small adsorbant molecules the total energy difference between the deformed and the gas phase structure of chloroform or bromoform is less than 1 meV. We therefore here solely use vdW-DF in the calculations. Because is calculated with the same adsorbant-adsorbant separation as the direct lateral interaction is subtracted from our results adenine ; slidingrings .
The optimal positions of the atoms within chloroform (and bromoform) are determined by minimization of the Hellmann-Feynman forces acting on the chloroform (or bromoform) atoms, when adsorbed on to graphene (“ads, fix-cell”) and when away from graphene (“gas, fix-cell”). We use the molecular-dynamics optimization method “fast inertial relaxation engine” (FIRE) fire with the requirement that the size of the remaining force on each atom is less than 0.01 eV/Å. The positions of the graphene atoms are left unchanged. The Hellmann-Feynman forces are derived from gradients in the electron density . The optimization yields the bond lengths and angles in the molecules (after adsorption and in the gas phase) and the optimal position of the molecule with respect to graphene. The potential well for the molecule near graphene is very shallow. We therefore start the optimization process in several different lateral and vertical positions of chloroform.
We use an orthorhombic unit cell of size Å for most of our calculations, but we also test the adsorption energy convergence with unit cell size, using a unit cell of size Å. Here , and Å is the clean graphene lattice constant as found earlier by relaxing the lateral size of the unit cell nalkanes . In the direction perpendicular to graphene there is Å of vacuum above chloroform when desorbed (and Å when adsorbed) to avoid vertical interaction across unit cell boundaries.
The (valence) electron density and wave functions are represented on evenly distributed grids in space. To ensure a good accuracy in our calculations we choose the density grid to have approximately 0.12 Å grid point separation in all three directions Ziambaras . In all calculations we use a 21 Monkhorst-Pack -point sampling of the Brillouin zone.
In DFT the total energy is given as a functional of the electron density . DFT is in principle exact, but in practise the exchange-correlation part of the total energy must be approximated. The exchange-correlation energy may also be written as a sum of exchange and correlation contributions, .
In the vdW-DF method the is chosen as the exchange part of a generalized gradient approximation (GGA). In the original version of vdW-DF Dion (which we use here) the exchange chosen is that of the revPBE approximation revPBE . The correlation energy is split IJQC into a nearly-local part and a part that includes the most nonlocal interactions ,
| (2) |
In a homogeneous system the term is the correlation obtained from the local density approximation (LDA), and in general Dion we approximate by . The term
| (3) |
describes the dispersion interaction and vanishes for a homogeneous system. It is given by a kernel which is explicitly stated in Ref. Dion, .
The term is sensitive to changes in the local real space grid, for example when the nuclei positions are translated by a distance not corresponding to an integer number of real-space grid points PAHgg ; Ziambaras ; NTgg . For calculations involving small (few meV) energy differences, like the calculations for the potential energy surface introduced in Section III.4 we therefore keep positional changes of the rigid molecules to an integer number of grid points.
Finally, we make sure that each of the total-energy calculations are accurately converged to a change in the total energy of less than 0.1 meV per unit cell, or less than approximately 10-6 eV per atom in the unit cell, in the last three DFT iterations. This choice of allowed change is significantly smaller than the default of GPAW and is essential in order to discuss energy changes in this adsorption system where relevant differences in total energies are down to the meV scale.
| NIST | This work | ||||
|---|---|---|---|---|---|
| gas phase | gas phase | ads. phase | |||
| chloroform | |||||
| (Å) | 1.073 | 1.087 | 1.087 | 0.01 (1%) | |
| (Å) | 1.762 | 1.798 | 1.801 | 0.003 | 0.03 (2%) |
| Cl-C-Cl (deg) | 110.92 | 111.4 | 111.1 | 0.3 | 0.5 (%) |
| H-C-Cl (deg) | 107.98 | 107.7 | 107.7 | 0.3 (%) | |
| bromoform | |||||
| (Å) | 1.085 | 1.085 | 0.02 (2%) | ||
| (Å) | 1.974 | 1.977 | 0.003 | 0.05 (3%) | |
| Br-C-Br (deg) | 111.5 | 111.8 | 0.3 | 0.2 (%) | |
| H-C-Br (deg) | 106.9 | 106.9 | 0.3 (%) | ||
| This work | Experiments | |||||
| Structure | Unitcell | |||||
| [kJ/mol] | [meV] | [Å] | [kJ/mol] | |||
| chloroform | H up | 34.4 | 357 | 4.20 | 54, 36.4b | |
| H up | 34.3 | 356 | 4.20 | |||
| H down | 33.5 | 347 | 3.48 | |||
| bromoform | H up | 39.0 | 404 | 4.32 | ||
| methanec | 14.6 | 152 | 3.64 | 13.6d, 17 | ||
| aThermal desorption spectroscopy measurements (at one monolayer), Ref. hertel . | ||||||
| bSingle atom gas chromotography, Ref. rybolt . | ||||||
| cTheory results from previous vdW-DF study with the same settings, Ref. nalkanes . | ||||||
| dTemperature programed desorption (results extrapolated to isolated adsorbant), Ref. tait2006 . | ||||||
III Results and discussion
Besides the total energies, in our calculations we also determine the molecular structure of the chloroform and bromoform molecules, both in the dilute gas phase and in the adsorbed phase. We compare the bond lengths and angles of the gas phase molecules with experimental values, and we determine the changes that occur when the molecules are adsorbed.
The chloroform and bromoform molecules may adsorb in various orientations and positions on graphene. We determine the optimal orientation and adsorption distance, and discuss the influence of the adsorption position on the adsorption energy. Further, we test the convergence of the adsorption energy (1) with respect to lateral size of unit cell, i.e., the length of the smallest molecule-to-molecule distance.
III.1 Structure of the desorbed and adsorbed molecules
For the desorbed molecules the atomic positions within the molecule are determined in the process of determining the total energy of the system of a molecule far away from graphene. The total energy of these gas phase structures, along with the clean graphene total energy, are used as the desorbed system energy with which the adsorbed system total energies are compared. The sum of total energies of the desorbed system is used as the zero point of the adsorption energy. In practise for our desorption calculations we keep graphene and chloroform (or bromoform) within the same unit cell, but far apart.
From the atomic positions in the gas phase the bond lengths and bond angles within the chloroform and bromoform molecules are extracted and listed in Table 1. We find that the C-Cl bonds are slightly shorter than the C-Br bonds, a result that is expected because Br is a larger halogen atom than Cl. The bond values we find are in reasonable agreement with the experimental values listed in the NIST database nist . All bond lengths are within 1-3% of the experimental values. Like for the experiments, the bond angles Cl-C-Cl (and Br-C-Br) are a few degrees larger than the H-C-Cl (and H-C-Br) angles. For the bond angles our results deviate less than 1% from experiment (Table 1).
III.2 Adsorption energies
Our main calculations are optimizations of the adsorbed chloroform molecule when it is positioned with the H atom pointing away from graphene (“H up”), as illustrated in Figure 1. We find adsorption energies in the 350–360 meV range depending on the precise position on graphene. For the position in Figure 1 we find meV. As discussed below, the differences in adsorption energies in the various positions on graphene are small.
Like the structural changes in the chloroform and bromoform molecule upon adsorption, the energetic changes are small. In fact, we find the contribution to the adsorption energy from the deformation of the adsorbant to be about 0.2 meV, less than the accuracy of our results ( meV).
Table 2 also lists the adsorption energies obtained through experimental measurements. These find that chloroform binds stronger to graphene than our results, with a deviation of our results from the experiments 36% for thermal desorption spectroscopy hertel or 5% for single atom chromotography rybolt .
For our calculations we also report in Table 2 the distance between the C atom of chloroform (or bromoform) and graphene, in the adsorbed configuration.
The majority of our calculations are carried out in a unit cell of lateral size , leading to a smallest (center-of-mass) molecule-to-molecule distance 7.43 Å for the periodically repeated images, or the distance 5.00 Å between two closest Cl atoms each residing on a different chloroform molecule. In our calculational procedure described by (1) we subtract any direct interactions between the molecules because both terms are calculated with the same lateral distance to neighboring molecules (i.e., with the same lateral size of the unit cell). Indirect interactions leading to changes in adsorption energy, could for example arise via a possible small deformation of the electron distribution on graphene, or via a possible but tiny deformation of atomic structure on chloroform. In order to check such possible effect we also calculated the adsorption of chloroform in a unit cell with 12.38 Å molecule-to-molecule distance, the unit cell. As evident from the results in Table 2 there is very little difference between results of the small and large unit cell, confirming that the unit cell size is sufficient for size-convergence, provided that direct molecule-molecule interactions across unit cell boundaries are cancelled like we do here.
In order to check whether the chloroform configurations with the H atom pointing to graphene are energetically more favorable than the “H up” configurations we also carry out a number of “H down” calculations. We calculate for the configuration with the H atom above the center of an aromatic ring in graphene and in a number of configurations with the H atom near or above a graphene C-C bridge. We find the configuration with H above the center of an aromatic ring to be the most favorable of the H-down configurations (H centered configuration listed in Table 2) by up to 12 meV, but less favorable that configurations with the H atom pointing away from graphene.
Previously, the dimer of chloroform with benzene has been studied using vdW-DF hooper . In that study the interaction between an aromatic -system (represented by benzene) and an aliphatic C-H group (in chloroform) was at focus, and accordingly the orientation of the chloroform was chosen to have the H-atom pointing towards the (center of) the benzene molecule. In Ref. hooper the binding energy 5.11 kcal/mol (21.4 kJ/mol or 222 meV/dimer) was found, with the distance from chloroform-C to the benzene-plane Å. The vdW-DF results of that study were compared with coupled cluster [CCSD(T)] calculations ringer with binding energy 5.60 kcal/mol (23.4 kJ/mol or 243 meV/dimer) at Å. In our calculations the interaction of chloroform is with the full graphene plane (as far as the vdW forces reach) and not only with the benzene molecule, we should therefore expect a larger interaction energy than for the molecular dimer. Indeed, with an adsorption energy of 347 meV (Table 2) we do find stronger binding than in the dimer case, stronger by about 123 meV, and with an adsorption position closer to the aromatic (graphene or benzene) ring by about 0.1 Å compared to the vdW-DF calculation and further away by approximately 0.3 Å compared to the CCSD(T) calculation.
In Ref. girao the adsorption of chloroform on to the (5,0) and (8,8) single walled carbon nanotubes (SWCNT) was addressed with the use of the LDA approximation to DFT. Adsorption energies 200 meV [for the (5,0) SWCNT] and 150 meV [for the (8,8) SWCNT] were found. However, even though LDA seems to bind vdW materials it cannot be used for the inclusion of vdW interactions, as already pointed out by Harris harris and discussed also in Refs. adenine ; murray . The LDA results of Ref. girao are therefore not further discussed here.
III.3 Adsorption of bromoform
The Br atom is similar to Cl but is heavier, i.e., has more electrons and larger molecular polarizability. We therefore expect a stronger binding to graphene than for chloroform. Indeed, our results in Table 2 show the adsorption energy to be 47 meV larger than that for chloroform. The adsorption distance as measured from the bromoform C atom is larger, reflecting the fact that the Br atom has a larger volume. The same trend, in the opposite direction, is seen for methane nalkanes : the H atom has less electrons than Cl, the binding is less strong (by 200 meV compared to chloroform) and the binding distance is smaller because H has less volume than Cl.
For the bromoform result shown in Table 2 we used the same position on graphene as illustrated in the top panel of Figure 1 as the starting point for the structural relaxations.
|
|
III.4 Chloroform potential energy surface
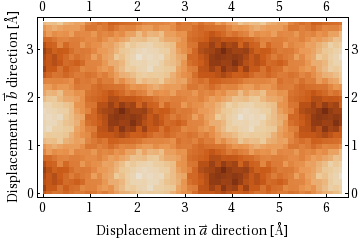
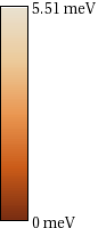
In Figure 2 we show the potential energy surface (PES) for chloroform. The figure is obtained from translating chloroform along graphene with the chloroform C atom kept at a fixed distance Å from the graphene plane. In Figure 2 origo corresponds to the position shown in the top panel of Figure 1. We find that the variation in adsorption energy along graphene is small, with an energy difference of less than 6 meV when Å. This illustrates that the corrugation of graphene, as experienced by the adsorbed chloroform molecules, is very small, and it takes only very little kinetic energy to overcome the barriers for lateral motion on graphene. Therefore, the concept of “adsorption sites” is not relevant in these physisorption studies h2cu ; h2cu2 . In effect, the chloroform is free to move along graphene at all temperatures relevant in practical applications mentioned in the introduction.
From Figure 2 we also find that the position used for the calculated adsorption energy in Table 2 is close to but not quite the optimal position, albeit not the energetically worst position either. In any case, the effect of our choice of position is a few meV, or less than 1% of the adsorption energy.
In all calculations for the PES the relative positions of the atoms within the adsorbants are kept the same, thus no further relaxation of the molecular structure is allowed. However, since the change in molecular structure when desorbing is on the sub-meV level, and less than the accuracy of our calculations, we expect the differences in molecular structure in the various adsorption positions to be even smaller and the effect on the adsorption energy to thus be negligible.
All data points for the PES are from adsorbant positions translated an integer number of grid points along the surface, that is, on a uniform orthogonal grid with 0.12 Å between grid lines. We restrict the possible positions of chloroform in order to keep the atomic positions relative to the density grid the same in all calculations, thus avoiding any effects of the sensitivity of the vdW-DF results on the positioning on the grid. This is potentially important because the PES is mapping a very shallow energy landscape.
The data for the PES are calculated for all grid positions within a part of the unit cell, that is, by scanning over twice the area of the graphene primitive cell (which has only two C atoms). Therefore, when translating the chloroform molecule over the area we calculate two data points for each unique adsorption position. To lower the sub-meV noise we use the average of the total energies in the two equivalent positions for the plot in Figure 2. For clarity we also include in Figure 2 repetitions of the calculations in the two lateral directions.
In Figure 2 only results of the fixed distance Å are shown, but our calculations include also distances Å in the same lateral positions as used in Figure 2. This corresponds to moving the molecule one full grid spacing closer to or further away from graphene and redoing the PAS calculations. However, all adsorption energies at those distances are smaller than any of the adsorption energies at the Å distance, and it is clear that the optimal distance from graphene varies much less than 0.12 Å when moving along graphene. Although the vertical part of the adsorption potential is shallow compared to covalent and ionic binding the lateral part is even more shallow.
The differences in smallest and largest total energy within each of the three chloroform-C-to-graphene distances are 7.7 meV, 4.8 meV, and 2.9 meV for the distances Å, 4.20 Å, and 4.32 Å, respectively. Thus the corrugation of graphene, as seen by chloroform, becomes slightly more pronounced in positions closer to graphene, even though the corrugation is small at all three distances considered here.
III.5 Implications for environmental research.
Even water from untreated drinking water wells contains THMs 2006-report . The THMs are spread in the environment since chlorinated water is used for watering, and it leaks from swimming pools and enters waste water. It is also produced by salt used on winter roads. Chloroform is also relatively volatile and escapes from water into the air with vapor (where inhalation may pose a health problem) or enters through the skin, for example during showers or in swimming pools. Absorption through the gastrointestinal tracts is fast and extensive, with the majority of ingested chloroform recovered in expired air within a few hours tox2 . With chloroform found in 11.4% of public wells in the U.S. 2006-report and chlorination still an important candidate for improving the quality of drinking water in developing countries, the occurrence of THMs is a potential human health concern, and methods to remove THMs after chlorination and before use of the water should be improved.
Chlorination of water gives rise to a number of THMs as byproducts, mainly Cl- and Br-based THMs. In order for these to be removed from water by adsorption on to graphene it is necessary that the adsorption energy at least exceeds that of water on graphene, and that the adsorption energy is much higher than the barrier for thermal desorption at relevant temperatures, here around 300 K which corresponds to 26 meV. In a CCSD(T) study voloshina the adsorption energy of water on graphene was found to be 135 meV, and in a recent vdW-DF study li2012 (utilizing a different exchange functional than here, the optB86b exchange klimes2011 ) the water adsorption energy was found to be 140 meV. Both results are clearly smaller than our chloroform and bromoform adsorption energies that are in the range 350–410 meV. Thus, while not directly giving proof that graphene can be used for water filters after chlorination our results do suggest that this may be possible.
IV Summary
We present a study of the adsorption on graphene of the two THMs chloroform and bromoform using the van der Waals density functional method vdW-DF. We find that chloroform and bromoform physisorb with their H atom pointing away from graphene, yielding adsorption energies 357 meV (34.4 kJ/mol) for chloroform and 404 meV (39.0 kJ/mol) for bromoform. This suggests that these THMs bind sufficiently strongly to graphene for graphene to be used in filtering of chlorinated water to remove the THM byproducts.
Acknowledgements.
Partial support from the Swedish Research Council (VR) is gratefully acknowledged. The computations were performed on resources provided by the Swedish National Infrastructure for Computing (SNIC) at C3SE. JÅ, OS, and OW carried out their part of the work as a research course that is part of their high school education; the course was a collaboration between Hulebäcksgymnasiet, Göteborg University, and Chalmers University of Technology, with project advisor ES and course supervisors Drs. Linda Gunnarsson and Pär Lydmark.References
- (1) K. Foxall, Chloroform Toxicological Overview, Health Protection Agency (U.K.) (2007).
- (2) J.T. Du, Toxicological Review of Chloroform, CAS No. 67-66-3, U.S. Environmental Protection Agency Washington, DC (2001).
- (3) T. Ivahnenko and J.S. Zogorski, Sources and Occurrence of Chloroform and Other Trihalomethanes in Drinking-Water Supply Wells in the United States, 1986-2001, Scientific Investigations Report 2006-5015, U.S. Department of the Interior and U.S. Geological Survey (2006).
- (4) E.C. Girão, Y. Liebold-Ribeiro, J.A. Batista, E.B. Barros, S.B. Fagan, J.M. Filho, M.S. Dresselhaus, and A.G.S. Filho, Phys. Chem. Chem. Phys. 12, 1518 (2010).
- (5) M. Dion, H. Rydberg, E. Schröder, D.C. Langreth, and B.I. Lundqvist, Phys. Rev. Lett. 92, 246401 (2004); 95, 109902(E) (2005).
- (6) T. Thonhauser, V.R. Cooper, S. Li, A. Puzder, P. Hyldgaard, and D.C. Langreth, Phys. Rev. B 76, 125112 (2007).
- (7) J. Hooper, V.R. Cooper, T. Thonhauser, N.A. Romero, F. Zerilli, and D.C. Langreth, ChemPhysChem 9, 891 (2008).
- (8) H. Ulbricht, R. Zacharia, N. Cindir, and T. Hertel, Carbon 44, 2931 (2006).
- (9) T.R. Rybolt, D.L. Logan, M.W. Milburn, H.E. Thomas, and A.B. Waters, J. Colloid Science 220, 148 (1999).
- (10) Open-source, grid-based PAW-method DFT code gpaw, http://wiki.fysik.dtu.dk/gpaw/ ; J.J. Mortensen, L.B. Hansen, and K.W. Jacobsen, Phys. Rev. B 71, 035109 (2005).
- (11) G. Román-Pérez and J.M. Soler, Phys. Rev. Lett. 103, 096102 (2009).
- (12) P.E. Blöchl, Phys. Rev. B 50, 17953 (1994).
- (13) E. Londero, E.K. Karlson, M. Landahl, D. Ostrovskii, J.D. Rydberg, and E. Schröder, Desorption of n-alkanes from graphene: a van der Waals density functional study, arXiv:1205.1295.
- (14) S.D. Chakarova-Käck, A. Vojvodic, J. Kleis, P. Hyldgaard, and E. Schröder, New J. Phys. 12, 013017 (2010).
- (15) S.D. Chakarova-Käck, E. Schröder, B.I. Lundqvist, and D.C. Langreth, Phys. Rev. Lett. 96, 146107 (2006).
- (16) K. Berland, S.D. Chakarova-Käck, V.R. Cooper, D.C. Langreth, and E. Schröder, J. Phys.: Condensed Matters 23, 135001 (2011).
- (17) K. Berland, T.L. Einstein, and P. Hyldgaard, Phys. Rev. B 80, 155431 (2009).
- (18) E. Bitzek, P. Koskinen, F. Gähler, M. Moseler, and P. Gumbsch, Phys. Rev. Lett. 97, 170201 (2006).
- (19) E. Ziambaras, J. Kleis, E. Schröder, and P. Hyldgaard, Phys. Rev. B 76, 155425 (2007).
- (20) Y. Zhang and W. Yang, Phys. Rev. Lett. 80, 890 (1998).
- (21) D.C. Langreth, M. Dion, H. Rydberg, E. Schröder, P. Hyldgaard, and B.I. Lundqvist, Intern. J. of Quantum Chem. 101, 599 (2005).
- (22) J. Kleis, E. Schröder, and P. Hyldgaard, Phys. Rev. B 77, 205422 (2008).
- (23) NIST Computational Chemistry Comparison and Benchmark Database, NIST Standard Reference Database Number 101, Release 15b, August 2011, Editor: Russell D. Johnson III, http://cccbdb.nist.gov/
- (24) E. Schröder, Methanol adsorption on graphene, unpublished.
- (25) S.L. Tait, Z. Dohnálek, C.T. Campbell, and B.D. Kay, J. Chem. Phys. 125, 234308 (2006).
- (26) A. Ringer, M. Figgs, M. Sinnokrot, and C.D. Sherrill, J. Phys. Chem. A 110, 10822 (2006).
- (27) J. Harris, Phys. Rev. B 31, 1770 (1985).
- (28) É.D. Murray, K. Lee, and D.C. Langreth, J. Chem. Theor. Comput. 5, 2754 (2009).
- (29) K. Lee, A.K. Kelkkanen, K. Berland, S. Andersson, D.C. Langreth, E. Schröder, B.I. Lundqvist, and P. Hyldgaard, Phys. Rev. B 84, 193408 (2011).
- (30) K. Lee, K. Berland, M. Yoon, S. Andersson, E. Schröder, P. Hyldgaard, and B.I. Lundqvist, Benchmarking van der Waals Density Functionals with Experimental Data: Potential Energy Curves for H2 Molecules on Cu(111), (100), and (110) Surfaces, preprint (2012).
- (31) E. Voloshina, D. Usvyat, M. Schütz, Y. Dedkov, and B. Paulus, Phys. Chem. Chem. Phys. 13, 12041 (2011).
- (32) X. Li, J. Feng, E. Wang, S. Meng, J. Klimeš, and A. Michaelides, Phys. Rev. B 85, 085425 (2012).
- (33) J. Klimeš, D.R. Bowler, and A. Michaelides, Phys. Rev. B 83, 195131 (2011).