High-power test results of a 3 GHz single-cell cavity
Abstract
Compact, reliable and energetically efficient accelerators are required for the treatment of tumours with ions. TERA proposes the “cyclinac”, composed of a fast-cycling cyclotron and high-frequency booster linac. The dimensions of the linac can be reduced if high accelerating gradients are used. TERA initiated a high-gradient test program to understand the operational limits of such structures. The program foresees the design, prototyping and high-power testing of several high-gradient structures operating at 3 and 5.7 GHz. The high-power tests of the 3 GHz single-cell cavity were completed in March 2012. The maximum break down rate (BDR) threshold measured for a peak electric surface field of 170 MV/m and a RF flat top pulse length of 2.5 µs was bpp/m.
1 Motivation
The hadrontherapy community demands compact, reliable and energetically efficient accelerators for tumour treatment with ions. CABOTO is a normal-conducting, high-frequency, fast-cycling linac designed by TERA which boosts the energy of the particles previously accelerated by a cyclotron [1]. The length of CABOTO could be below 26 m if high gradients in the order of 35 MV/m on axis were used, which would lead to maximum electric fields in the order of 170 MV/m in the structure.
The use of high-gradient structures for medical purposes requires to prove that the machine can operate at high gradients without compromising its reliability. Therefore, the study of high-gradient structure performances becomes essential to understand the possible use of this kind of structures in hadrontherapy. A collaboration between TERA and the CLIC - RF structure development group at CERN has been established to advance together in this field. Although TERA and CLIC are working on very different RF structures, both share the same operational limits: a 200 MV/m maximum electric field and a maximum BDR (breakdown rate, the number of breakdowns per pulse per meter of an accelerating structure) [3]. This corresponds to about one breakdown per treatment course, the acceptable breakdown rate for a medical accelerator.
In this framework, TERA initiated a high-gradient test program [2] which consists in the design, prototyping and high-power tests of one 3 GHz single-cell cavity and three 5.7 GHz single-cell cavities. The main goal of this program is to understand the limitation at which the high-gradient CABOTO-like cavities can operate reliably. The program foresees the design, prototyping and high-power test of a multi-cell structure operating at the frequency which provided better performances. The high-power tests of the 3 GHz single-cell cavity were completed in March 2012 and are presented in the following, preceded by a brief description of the cavity design, prototyping and low power RF measurements.
2 3 GHz single-cell cavity design and fabrication
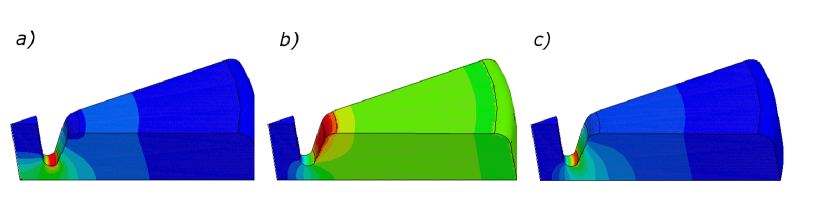
The cell geometry was similar to the low-energy cells of the high-gradient linacs designed by TERA, presenting nose cones that enhance the electric field along the beam axis. It was optimized to maximize the shunt impedance for a bore radius of 3.5 mm. The RF design of the cavity was based on 2D and 3D simulations, respectively done with Poisson Superfish and Ansoft HFSS. Fig. 1 shows the distribution of electric and magnetic field and modified Poynting vector in the cell volume. The maximum electric and magnetic field and the maximum modified Poynting vector for the designed cell are given in Table 1.
The power was provided to the cell by magnetic coupling. The cavity geometry was designed such that the structure was overcoupled. A movable short was placed at one end of the waveguide in order to match the waveguide feeder to the cell. Subsequently, the short was brazed at the position which led to critical coupling.
The frequency shift due to thermal expansion was calculated to be -0.05 MHz/degree. The thermal resistance of the cavity is 0.035 degrees/W. The cavity incorporated two parallel circuits of 5.5 mm diameter sized to cool down 350 W (power corresponding to 260 MV/m peak surface electric field) with a 2.5 l/min water flow per circuit in turbulent regime.
The prototype is made of UNS C10100 OFE copper. It was machined at VECA s.r.l.(Italy) with a cell profile tolerance of 20 µm and a surface roughness (Ra) of 0.4 µm. The cavity elements were cleaned (degreasing, pickling and passivation) at CERN (Switzerland) and vacuum brazed at Bodycote (France).
Once the prototype was ready, the cavity was tuned and matched. The tuning was done by deforming the nose cone region from both sides of the bore hole with a bar clamp, in order to reduce the gap length of the cell and hence to decrease the resonant frequency. Then, the cavity was matched by adjusting the short plate position. After this procedure, a quality factor within 5% of simulation estimations and a reflection coefficient of -27 dB were measured. Table 1 shows the main electromagnetic quantities of the test cavity after tuning and matching.
| Electromagnetic quantities | ||
| Frequency, | 3 | |
| Quality factor, | 9140 | |
| Coupling factor, | 0.92 | |
| 6.5 | ||
| 2.96 | ||
| 0.032 | ||
| For operation at =150 MV/m | ||
| Required Power, | 128 | |
| Pulsed Surface Heating, | 2 |
3 High-power tests in the CLIC Test Facility
The primary goal of the high-power tests was to evaluate, preferably with a direct measurement, the breakdown rate at field levels in the range of the operation field of CABOTO. The for CABOTO is 4–5. For an accelerating gradient of 35 MV/m, the maximum electric field reached in the structure is about 170 MV/m, equivalent to the value that should be reached in the test cavity to perform this direct measurement.
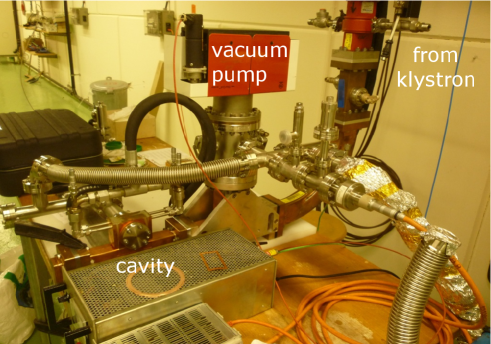
The 3 GHz single-cell cavity underwent three high-power tests, conducted in the CLIC Test Facility (CTF) at CERN in February 2010, September-October 2011 and February-March 2012 (see Fig. 2). The cavity saw about RF pulses and suffered more than RF breakdowns during conditioning.
The diagnostics included measurements of Faraday cup signals of field-emission currents (dark currents), incident and reflected RF power signals (amplitude and phase), thermocouples for temperature measurement of the cavity outer surface and the coolant, and a photomultiplier to detect light emitted during RF breakdowns.
4 Measurements and results
The breakdown rate, given in breakdowns per pulse per meter, was calculated as the number of breakdowns over the number of RF pulses and the total length of the cell, =0.0189 m (see Eq. 1). Breakdowns were identified from the increase in reflected power within an RF pulse.
| (1) |
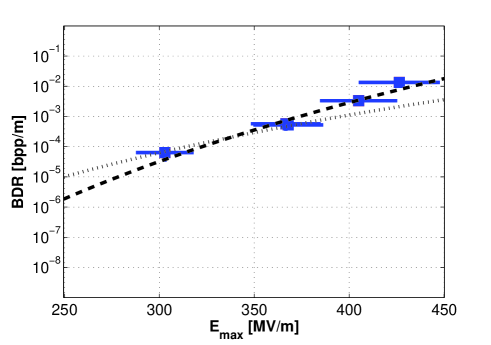
Fig. 3 shows the breakdown rate measurements for different electric field values. The lowest field measurement, at 170 MV/m, is just a maximum threshold to the breakdown rate corresponding to that field range, as it was mentioned above.
4.1 Consequences for TERA applications
The maximum BDR threshold measured for of 170 MV/m (which corresponds to a maximum accelerating gradient of about 35 MV/m in CABOTO) and a RF pulse length of 2.5 µs flat top (typical for CABOTO) is bpp/m. This breakdown rate value is acceptable for medical purposes.
4.2 Fitting models
Two different models try to explain the appearance of RF breakdowns when operating at high gradient. The breakdown rate measurements performed for the 3 GHz test cavity were fitted to both models.
4.2.1 Power flow model
The modified Poynting vector, a local field quantity that takes into account active and reactive power flow on the structure surfaces was proposed as a candidate to explain the high-gradient limit due to vacuum RF breakdowns [3]. The field-emission currents at potential breakdown sites cause pulsed local heating of tips which acts as breakdown triggers in the model.
The model says that the breakdown rate is proportional to the 15th power of the modified Poynting vector, . Fig. 3 shows the breakdown rate measurements performed for the 3 GHz test cavity fitted with the power flow model. Data in the low-field range MV/m fit to the model with a power of (105) for the electric field. Data in the high-field range MV/m fit to the model with a power of (165) for the electric field. Both fits present the same root mean square deviation, .
4.2.2 Stress model
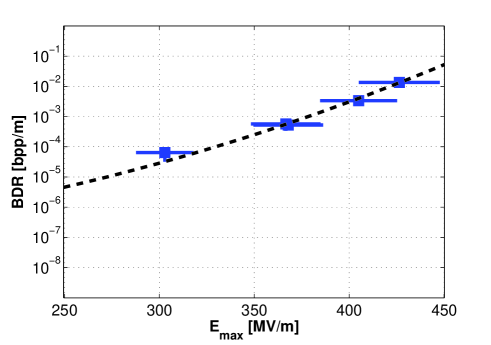
A recently proposed model explains that limitation to high-gradient performance of accelerating structures due to RF breakdown comes from the stress caused on the crystalline structure of copper due to the exposure to an external electric field, which triggers the RF breakdown. The model assumes that the breakdown rate is proportional to the number of defects in the crystalline structure of copper [4]. The model follows the exponential growing fit:
| (2) |
where is the permittivity in free space, is the defect volume, and is the Boltzmann constant. The dislocation loop radius is calculated from . Results from other experimental data lead to and . Fig. 4 shows the breakdown rate measurements performed for the 3 GHz test cavity fitted to the stress model with a root mean square deviation of . The calculated values for and are, respectively, and , and are consistent with the values obtained for data from other experiments.
5 Conclusions and outlook
The results of the 3 GHz cavity test are encouraging and show that structures can be operated with a RF flat top pulse length of 2.5 µs and a surface electric field of MV/m (accelerating gradient MV/m) when limiting the break down rate to per pulse per meter. Future high-power tests of the 5.7 GHz single-cell cavities will serve to understand which frequency would be more suitable for the construction of a medical high-gradient linac. The design, prototyping and high-power tests of a multicell structure operating at the selected frequency will follow.
We would like to express our gratefulness to the CTF3 group for technical and scientific support to prepare and perform the experiment and to the CLIC RF structure development group for the enriching discussions about the preparation, development and analysis of the test.
Special thanks go to Alexey Dubrovskiy and Luca Timeo, for their extensive contributions to the tuning and high power tests. Thanks also to Javier Bilbao de Mendiz bal and Eugenio Bonomi.
We are grateful to Vodafone Italy foundation for the fundings received to produce the test cavity. The research leading to this results was partially funded by the Seventh Framework Programme [FP7/2007-2013] under grant agreement no 215840-2.
References
References
- [1] U. Amaldi, R. Bonomi, S. Braccini, M. Crescenti, A. Degiovanni, M. Garlasch , A. Garonna, G. Magrin, C. Mellace, P. Pearce, G. Pitt , P. Puggioni, E. Rosso, S. Verdú-Andrés, R. Wegner, M. Weiss and R. Zennaro, “Accelerators for hadrontherapy: From Lawrence cyclotrons to linacs”. Nuclear Instruments and Methods in Physics Research Section A: Accelerators, Spectrometers, Detectors and Associated Equipment 620 (2010) 563 - 577.
- [2] A. Degiovanni, U. Amaldi, R. Bonomi, M. Garlasché, A. Garonna, S. Verdú-Andrés and R. Wegner, “TERA high gradient test program of RF cavities for medical linear accelerators”. Nuclear Instruments and Methods in Physics Research Section A: Accelerators, Spectrometers, Detectors and Associated Equipment 657 (2011) 55 - 58.
- [3] A. Grudiev, S. Calatroni, and W. Wuensch, “New local field quantity describing the high gradient limit of accelerating structures”. Phys. Rev. ST Accel. Beams 12, 102001 (2009).
- [4] F. Djurabekova et al., “Multiscale modeling of electrical breakdown at high electric fields”. Talk in the International Workshop on Mechanisms of Vacuum Arcs MeVArc, Helsinki, Finland (2011).