Multi-wavelength Observations of PKS 2142-758 during an Active Gamma-Ray State
Abstract
PKS 2142758 is a flat spectrum radio quasar which emits few, weak but significant -ray flares in the MeV through GeV energy range. The first flare occured on April 4th, 2010, when the source reached a daily flux of ph cm-2 s-1 (ATEL #2539) in the 100 MeV to 300 GeV range. This flux represented more than an order of magnitude increase over its quiescent flux. Since the initial flare, this source has been detected in an elevated state within the same energy range from October to November of 2010 and another period ranging from July to August of 2011. During the latest flaring period in 2011 a multi wavelength observing campaign was carried out using the Ceduna radio telescope, the Australian Telescope Compact Array (ATCA), the TANAMI VLBI Array, Swift, the Rapid Eye Mount Telescope (REM), and the Large Area Telescope (LAT) on board Fermi. These quasi-simultaneous data were used to construct a broadband SED of this object in its rare active state. We present these observations and the resulting SED and some preliminary analysis of the constraints they place on the high energy emission from this object.
I Introduction
Active galactic nuclei (AGN) are the brightest persistent sources of electromagnetic radiation, from low energy radio waves to high energy -rays. It is believed that AGN are powered by accretion of matter onto a supermassive black hole (Lynden-Bell, 1969). AGN can produce large scale jets of plasma that can extend for thousands of parsecs. Blazars are the most luminous and violently variable subclass of AGN whose relativistic jets are believed to be pointed close to our line of sight (Urry & Padovani, 1995). Blazars are also the most common type of AGN to be detected at GeV energies. The method by which blazars produce -rays is uncertain and there are a number of different possible explanations.

Models of high energy blazar emission can be divided into two major subgroups, leptonic and hadronic models (Böttcher, 2007). Leptonic models focus on a source of seed photons being Compton upscattered to higher energy levels by relativistic electrons in the jet. Leptonic models can be further subdivided by the source of seed photons, one candidate source is synchrotron photons produced by jet electrons themselves (synchrotron self Compton scattering). Another possibility is that the seed photons come from a source external to the jet (external Compton scattering). The accretion disk itself, the broad line region and the dusty torus are all possible examples of photon sources for external Compton scattering. Seed photon sources do not necessarily have to be confined to the host galaxy, cosmic microwave background photons can also be up scattered to higher energies (Böttcher et al., 2008). Hadronic models assume that a significant fraction of the jet power is converted into acceleration of protons. These protons reach the threshold for proton pion production and synchrotron supported pair cascades will develop (Mannheim & Biermann, 1992).
Quasi simultaneous data on blazar emission at multiple wavelengths across the electromagnetic spectrum will allow us to distinguish between the different models of high energy production within blazars (Böttcher, 2007). The launch of the Fermi -ray space telescope has created new opportunities for studying blazars at high energies. The LAT is more sensitive and has better energy and spatial resolution than any previous telescope in the MeV–GeV energy range. Fermi has put better constraints on blazar variability within its observing window and has shown that it is not unusual for blazars to exhibit fast variability on timescales of days or even hours at GeV energies. Fermi operates in an all sky scanning mode which makes it an ideal rallying point for staging multi instrument observing campaigns on sources in response to their changing -ray state.
The brightest AGN in Fermi’s observing window are studied in detail using a broad band multi wavelength approach (e.g. (Abdo et al., 2010), (Pacciani et al., 2010)). However relatively little attention has been given to blazars that are not the most extreme -ray emitters. PKS 2142-758 is a flat spectrum radio quasar at a redshift of 1.139 (Jauncey et al., 1978) and it is not among the brightest Fermi detected extragalactic sources. Typical -ray flares of this source reach a flux of around ph cm-2 s-1 in the 100 MeV–300 GeV energy range and they happen infrequently. This object will be part of a broader study of blazars which are not the most extreme -ray sources. The aim of this study is to investigate why some blazars can be very -ray bright while other are not despite their similarities at other wavelengths.
II -ray Properties
All the -ray data presented in this paper were recorded by the LAT. The LAT is a high energy -ray telescope with a wide field of view designed to cover the energy band from 20 MeV to greater than 300 GeV. The LAT primarily operates in an all sky scanning mode sweeping its field of view over the entire sky every three hours. Likelihood analysis is used in order to determine the gamma properties of any detected source for any time range during the LAT’s mission lifetime (Atwood et al., 2009). All LAT data analysis was unbinned and done using the 09-24-00 version of the science tools and the P7SOURCE_V6 IRF.
The light curve (Figure 1) shows the -ray flux of PKS 2142-758 in the 100 MeV to 300 GeV energy range averaged into weekly time bins. A circular region of interest of 10 degrees was used for the analysis. The light curve begins on August 4, 2008 and ends on September 28, 2011. Upper limits on the source’s flux are calculated when the test statistic (TS) (Mattox et al., 1996) for that week is below 9 (9 roughly corresponds to a 3 sigma detection of the source). The three flares originating from this source peak at around ph cm-2s-1 in the 100 MeV to 300 GeV range. Our multi wavelength campaign was carried out during the last flaring period in July and August of 2011.
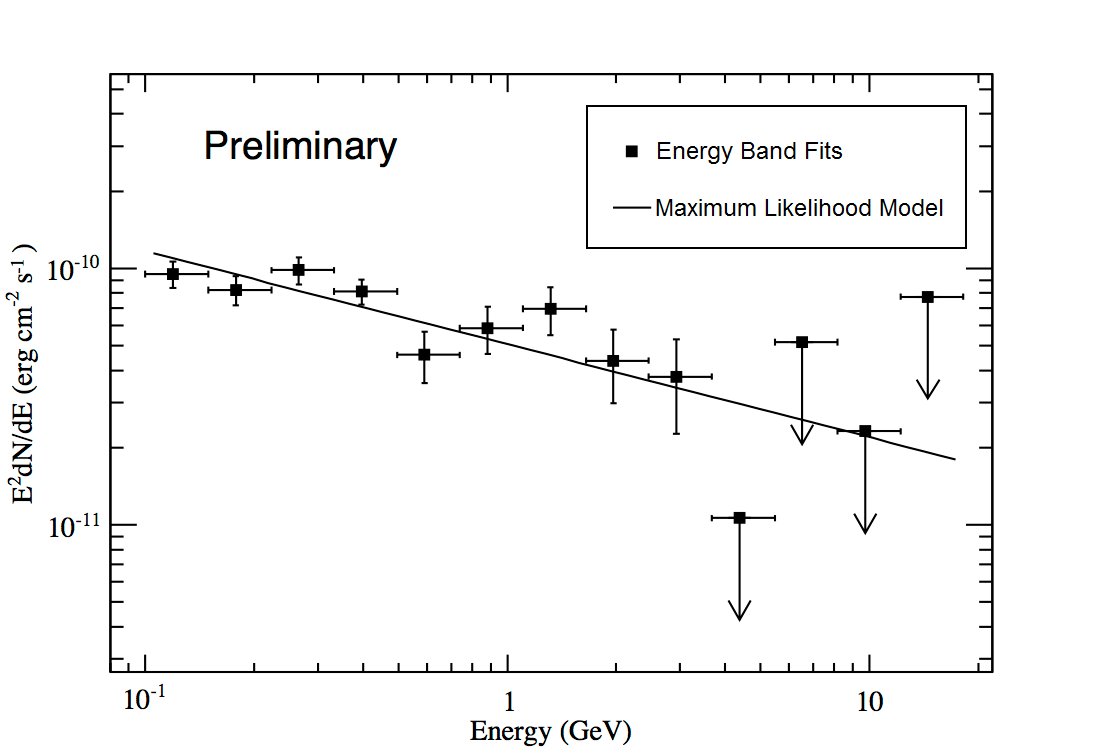
The LAT spectrum (Figure 2) was made using a circular ROI of 10 degrees and data from July 21, 2011 to August 18, 2011 which corresponds to a time period when the source’s daily TS across the 100 MeV to 300 GeV energy band was greater than 25. Initially a likelihood analysis was run over the whole spectrum to get a power law fit for the -ray emission. The data were then divided into 13 logarithmic energy bins. Using the initial power law as a starting point for the analysis the flux was determined in each of the energy bins. The horizontal bars on each of the data points represent the width of the energy bin and the vertical bars are one sigma errors. Points with arrows pointing below them are upper limits. Upper limits on the target source’s flux were calculated when the test statistic within the energy bin was below 25.
III Swift Observations
Swift is a multi wavelength space-based observatory that has three different instruments on board, the Burst Alert Telescope (BAT), the Ultra Violet Optical Telescope (UVOT) and the X-Ray Telescope (XRT). Swift uses momentum wheels to rapidly change the direction in which it is pointing (Gehrels et al., 2004). The observatory’s primary objective is to observe -ray bursts making its ability to slew rapidly a necessity, however this ability has become extremely useful for studying blazars due to their rapid variability at high energy.
Swift observed this source with the UVOT and XRT on August 10, 16, 18, and 23 2011 with exposure times of 2085 s, 4890 s, 3666 s, and 1441 s respectively. The most current versions of the Swift data reduction software (07Jun2011_V6.11) and calibration data (caldb.indx20110725) were used. This resulted in four UVOT observations with 3 different filters , and which correspond to wavelengths of 3465, 2600 and 1928 Å respectively. Aperture photometry was done using the standard UVOT data reduction task UVOTSOURCE. A circular source region of radius 2.5” and background region of radius 12.5” were used for the calibration. UVOTSOURCE also performs coincidence loss corrections on the data. Magnitudes have been corrected for Galactic extinction using the method described in Fitzpatrick (1999).
The XRT observations were made in photon counting mode and a 23.6’ x 23.6’ image is available for each pointing. The source is clearly visible with no other sources in the region of interest for each pointing. Identical circular source and background extraction regions of 60” and 119”, respectively, were used for all four pointings. Source count rates of 0.054(5) counts/s, 0.040(3) counts/s, 0.049(4) counts/s, and 0.043(6) counts/s were measured. In order to increase the signal to noise ratios for spectral modeling the spectra of the individual observations were averaged into a single data set. An overall response file was created weighing the auxiliary response files by photon number and using the appropriate response matrix from the calibration archive, swxpc0to12s6_20010101v013.rmf. The averaged spectrum was rebinned by combining every 25 channels below 3.5 keV and every 50 channels above. The 12 ks spectrum was then modeled in the energy range from 0.3 eV to 8 keV with an absorbed power law. This resulted in a good fit with best fit parameters of cm-2 and Gamma= for the neutral hydrogen column density and the power law index, respectively (error confidence level 90%) and a reduced value of 1.2 for 10 degrees of freedom.
IV Near Infrared Observations with REM
The Rapid Eye Mount (REM) telescope is a 60 cm telescope observing at infrared and optical wavebands. It is able to react quickly to changes in the sky. It is located on the La Silla premises of the ESO Chilean Observatory making it ideal for observing highly variable southern sources. Observations of PKS 2142-758 were made on August 10, 2011 shortly after a flare in gamma-ray emission, with 150 s exposure time. To calibrate the data, 10 reference stars from the 2MASS catalogue were used with J magnitudes ranging from 11.10 to 14.9. The linear fit between instrumental and nominal magnitudes was always good, with a slope of nearly 1, and a dispersion of about 0.07 magnitude. Two near IR flux measurements of PKS 2142758 were made resulting in magnitudes of 15.05 0.16 in the band and 14.92 0.31 in the band. The errors reported are computed by IRAF/apphot and they are based on the Poisson statistics of the net counts and the detector noise: this method generally underestimates the actual error in the source’s magnitude. The source was rather faint for REM, so that the total net counts were rather low and the strongly structured background light leads to an additional error of 25-30 % (0.3 magnitude) in the flux measurement. Our total error for the source flux is about 50% at both frequencies.
V Radio Observations
The radio data reported here were obtained from two different monitoring programs one using the Australia Telescope Compact Array (ATCA) and the other using the Ceduna telescope.
ATCA has been monitoring TANAMI sources at a number of radio frequencies. ATCA data were reduced with the Miriad software package, following standard practices for continuum data. Flux densities were measured using the triple amplitude quantity, and are calibrated against B1934638 for frequencies below 25 GHz, and against Uranus for higher frequencies. One flux density measurement was made for each 2 GHz band, and represents the flux at the centre frequency, assuming that the spectral index across the band does not vary. For this study, PKS 214275 was observed on August 30th at 5.5, 17, 19, 38, 40 GHz.
The University of Tasmania operates a 30 m radio telescope at Ceduna in South Australia (e.g. McCulloch et al. (2005)). This telescope has been monitoring TANAMI sources at 6.7 GHz typically once every two weeks. The data are collected in four scan blocks, two scans in right ascension and two in declination. A block is rejected if any of its scans fail a Gaussian fit. The data are corrected for gain-elevation effects, and a pointing correction applied. B1934638 is used as the primary flux calibrator. Variation in system temperature due to ambient temperature changes over the course of 24 hours necessitates daily averaging of the data. The data used in the construction of this SED were observed on July 30th, 2011.
VI SED Modeling

The data from each instrument are plotted on the spectral energy distribution (SED) in Figure 3. An initial attempt at leptonic SED modeling was performed according to the method described in Dermer et al. (2009). This model assumes that the radio flux is non-thermal synchrotron radiation emitted by electrons which are isotropically oriented in the co-moving frame of the jet in a randomly oriented magnetic field in the jet plasma. Optical and UV emission is modeled as thermal emission from the accretion disk. The X-ray through -ray emission is produced by Compton scattering of seed photons produced in the dust torus. The contribution of the synchrotron self Compton effect is very small and plays almost no role, so external Compton processes are the primary source of high energy emission for this source. The variability timescale derived from the LAT light curve constrains the size of the -ray emitting region. The synchrotron self absorption process is included in this fit so the small region that is consistent with the variability timescale cannot explain the radio points. Table 1 lists the parameters that went into the model.
| Variability Timescale s |
|---|
| Radius of Emission Region = cm |
| Doppler Factor = 40 |
| Magnetic Field = .23 G |
| Broken power law electron distribution: |
| Minimum electron Lorentz factor = 2.3 |
| Break in Lorentz factor = 230 |
| Maximum electron Lorentz factor = |
| Low energy electron spectral index = 2.0 |
| High energy electron spectral index = 3.2 |
| Dust torus: |
| Dust temperature = K |
| Dust Luminosity = erg/s |
| Radius of Dust Torus = 16.2 parsecs |
| Accretion disk emission: |
| Black Hole Mass = solar masses |
| Accretion Rate = 1/12 eddington rate |
| Inner Radius = 6 Rg (Rg = cm) |
| Outer Radius = Rg |
| Luminosity of the disk = erg/s |
| Equipartition: |
| Jet power in magnetic field = erg/s |
| Jet power in particles = erg/s |
VII Conclusions and Future Work
The next step in this project is to construct and model an SED of the source when it is in a quiescent state. Comparison of the fitted parameters in the active and quiescent states should provide constraints on the gamma-ray production mechanism in this source. Ongoing VLBI (Very Long Baseline Interferometry) monitoring by the TANAMI program (Ojha et al., 2010) will allow us to resolve the jet structure of this source and follow its kinematics. In particular, apparent proper motion measurements will provide a much stronger constraint on the Doppler factor than is possible with the SED modeling.
Acknowledgements.
On behalf of the coauthors I would like to thank the Fermi and Tanami teams, Bill McConville for his assistance with Fermi data reduction, Neil Gehrels and the Swift team for scheduling the ToO. This research was funded in part by NASA through Fermi Guest Investigator grants NNH09ZDA001N and NNH10ZDA001N. This research was supported by an appointment to the NASA Postdoctoral Program at the Goddard Space Flight Center, administered by Oak Ridge Associated Universities through a contract with NASA.References
- Abdo et al. (2010) Abdo A.A., Ackermann M., Agudo I., et al., 2010, apj 721, 1425
- Atwood et al. (2009) Atwood W.B., Abdo A.A., Ackermann M., et al., 2009, Astrophys. J. 697, 1071
- Böttcher (2007) Böttcher M., 2007, Astrophysics and Space Science 309, 95 10.1007/s10509-007-9404-0
- Böttcher et al. (2008) Böttcher M., Dermer C.D., Finke J.D., 2008, apjl 679, L9
- Dermer et al. (2009) Dermer C.D., Finke J.D., Krug H., Böttcher M., 2009, apj 692, 32
- Fitzpatrick (1999) Fitzpatrick E.L., 1999, pasp 111, 63
- Gehrels et al. (2004) Gehrels N., Chincarini G., Giommi P., et al., 2004, apj 611, 1005
- Jauncey et al. (1978) Jauncey D.L., Wright A.E., Peterson B.A., Condon J.J., 1978, apjl 219, L1
- Lynden-Bell (1969) Lynden-Bell D., 1969, Nature 223, 690
- Mannheim & Biermann (1992) Mannheim K., Biermann P., 1992, aap 253, L21
- Mattox et al. (1996) Mattox J.R., Bertsch D.L., Chiang J., et al., 1996, apj 461, 396
- McCulloch et al. (2005) McCulloch P.M., Ellingsen S.P., Jauncey D.L., et al., 2005, AJ 129, 2034
- Ojha et al. (2010) Ojha R., Kadler M., Böck M., et al., 2010, aap 519, A45
- Pacciani et al. (2010) Pacciani L., Vittorini V., Tavani M., et al., 2010, apjl 716, L170
- Urry & Padovani (1995) Urry C.M., Padovani P., 1995, pasp 107, 803