A new connection between the opening angle and the large-scale morphology of extragalactic radio sources
Abstract
In the case of an initially conical jet, we study the relation between jet collimation by the external pressure and large-scale morphology. We first consider the important length-scales in the problem, and then carry out axisymmetric hydrodynamic simulations that include, for certain parameters, all these length-scales. We find three important scales related to the collimation region: (i) where the sideways ram-pressure equals the external pressure, (ii) where the jet density equals the ambient density, and (iii) where the forward ram-pressure falls below the ambient pressure. These scales are set by the external Mach-number and opening angle of the jet. We demonstrate that the relative magnitudes of these scales determine the collimation, Mach-number, density and morphology of the large scale jet. Based on analysis of the shock structure, we reproduce successfully the morphology of Fanaroff-Riley (FR) class I and II radio sources. Within the framework of the model, an FR I radio source must have a large intrinsic opening angle. Entrainment of ambient gas might also be important. We also show that all FR I sources with radio lobes or similar features must have had an earlier FR II phase.
keywords:
methods: numerical — radio continuum: galaxies — galaxies: jets1 Introduction
Extragalactic radio sources are traditionally divided into two morphological classes (Fanaroff & Riley 1974): those in class I (FR I) are edge-darkened and those in class II edge-brightened. Fanaroff & Riley found that the two classes differ in radio power, those with 178 MHz luminosities below W Hz-1 sr-1 (Hubble’s constant = 50 km s-1 Mpc-1) being in class I and those above in class II. In subsequent studies, the critical power, , was found to be correlated with the optical magnitude of the host galaxy (, Owen & Laing 1989; Owen & White 1991; Owen 1993; Ledlow & Owen 1996; Ghisellini & Celotti 2001). It is well known that brighter galaxies tend to have bigger central super-massive black holes (e.g. Gültekin et al. 2009), which are responsible for the jet production in the first place. Interestingly however, Wold, Lacy, & Armus (2007) do not find a correlation of FR class with the mass of the super-massive black hole in the host galaxy for a sample of 21 3CRR radio sources near the critical power. Thus, in determining the large scale morphology, the jet power is the most important influence – at least one other also plays a role, but this factor does not seem to be the black hole mass.
FR I radio sources often show narrow jets emanating from the core, which is usually thought to coincide with the AGN, and extending out to a bright flaring point. Beyond this flaring point, the flow widens and dims. These findings have been modeled as a transition from a laminar to a turbulent flow (e.g. Bicknell 1984, 1986a, 1986b; Komissarov 1990c, b, a; Wang et al. 2009), which mixes turbulently with the entrained gas. This basic model has been confirmed by numerical simulations: Rossi et al. (2008) show that a jet that is forced to entrain may make the desired transition. Perucho & Martí (2007) find the transition in flow character after an induced strong expansion phase in the jet. The reason for such an expansion phase and why it should occur at low jet power only, remains however unclear. Hardcastle, Sakelliou, & Worrall (2005) and Jetha et al. (2005) present studies of morphological features in three FR I sources, focusing on the density structure in the ambient X-ray gas as observed by Chandra and XMM-Newton. They find the flaring point is located at a place where the ambient gas temperature rises steeply from the inner cool core to the hotter intra-cluster gas. This is accompanied by a local flattening of the density profile. In each case, the location is a few tens of kpc from the core. It is clear that observations suggest the FR class of a radio source is significantly influenced by both the intrinsic jet properties and the properties of the environment.
The physics of the structure and evolution of FR II sources has been studied in some detail. Such sources often show evidence of a jet at various places from the core out to the edge of the source, which might be over a Megaparsec away (e.g. Mullin, Hardcastle, & Riley 2006). There, they feature one or more hotspots. A diffuse, cylindrical “cocoon” extends from the hot spots back towards the radio core. Axis ratios of these cocoons vary between one and about six (e.g. Kaiser & Alexander 1997, and references therein, Mullin, Riley, & Hardcastle 2008). This has inspired self-similar models of FR II radio source growth (Falle 1991; Kaiser & Alexander 1997). These models are valid far away from the characteristic scales of the problem. An outer scale (Komissarov & Falle 1998), at around which the source comes into pressure equilibrium with its surroundings, is given by
where is the kinetic power of the source, is the external density, and is the external sound speed. FR II radio sources approaching have been studied analytically (Alexander 2002) and numerically (e.g. Krause 2005; Gaibler, Krause, & Camenzind 2009). Up to , the source is overpressured with respect to its environment, and is also expected to have a strong bow shock (weakening as the source approaches ). Observations of weak bow shocks in radio sources kpc in size (e.g. McNamara et al. 2005; Nulsen et al. 2005) may be simply understood in terms of them being close to .
Crucial to the existence of the self-similar solution is the self-confinement of the jet by the source’s own cocoon pressure. This happens automatically in numerical models of the propagation of light jets (heavy jets show only a rudimentary cocoon). In such simulations, the overpressured cocoon drives a re-collimation shock into the beam as soon as the latter enters the computational domain, regardless of whether the beam is initially conical or cylindrical (e.g. Komissarov & Falle 1998; Krause 2003; Heath et al. 2007).
An initially overdense, conical beam, may be collimated via a re-collimation shock. It occurs when the external pressure becomes comparable to the sideways ram-pressure, , where is the jet density ( in a conical jet, where r is the distance to the AGN), the constant beam velocity, and the half opening angle (Scheuer’s (1974) model B). This position is related to and occurs somewhat downstream of the inner scale (e.g. Alexander 2006), given by
| (2) | |||||
On scales , we expect self-similar behaviour. At the jet density becomes roughly comparable to the external density, and the mass of the swept-up gas becomes comparable to the mass that has gone through the jet channel.
The development of the large-scale morphology of the radio source depends upon what happens around . If a proper re-collimation shock is driven into the beam, an FR II source will develop. Otherwise, a morphology of the FR I type might result.
Here, we present jet simulations on a spherical grid starting at a fraction of out to a few hundred times . We follow the approach of (Alexander 2006) in employing non-relativistic hydrodynamics, addressing the same scale, downstream of . This allows detailed studies of the re-collimation process and its relation to the large-scale morphology. We show that a proper re-collimation shock only occurs for small opening angles.
2 Re-collimation, cocoon formation and terminal shock limit
| Length-scale | formula | symbol | assoc. transition111Symbol of the associated transition point when the jet is in a cocoon. |
|---|---|---|---|
| Inner | |||
| Re-collimation | |||
| Cocoon formation | |||
| Terminal shock | |||
| Outer |
The physics of the region downstream of involves understanding of the three length-scales (see Alexander (2006) for further discussion, Table 1 summarises the definitions), associated to re-collimation (), cocoon formation () and the terminal shock (). The first, , is where the jet’s sideways ram-pressure equals the ambient pressure leading to potential re-collimation by the ambient gas:
| (3) |
where is the ratio of specific heats in the environment, , the solid angle of the jet, and the Mach-number with respect to the ambient sound speed. If, however, an overpressured cocoon forms, the jet-collimation can occur on smaller scales. Before the jet collimates, the jet density decreases with distance due to its fixed opening angle. The jet starts to develop a cocoon at the second length-scale where the density of the jet falls below that of its environment:
| (4) |
The third, is the length-scale where the ram-pressure of the un-collimated conical jet would fall below the pressure in the environment (see below for the case when an overpressured cocoon is present):
| (5) |
Since the terminal shock is advanced by the jet’s forward ram-pressure, it will advance only up to , unless the jet is collimated before reaching this third scale. If an overpressured cocoon is present, the critical scale for the jet termination shock will be further in. However, the scales for re-collimation and jet termination will be affected in the same way (compare eqs (3) and (5), the dependence on the environmental pressure is via the sound speed which enters the Mach number and for this consideration the environment would be the cocoon). The terminal shock is the prime site of particle acceleration and therefore synchrotron emission. It may therefore be identified with the hotspots of a radio source. If it remains at because the jet fails to collimate beforehand, the cocoon may still expand and the stationary shock at may be identified with the flaring point of an FR I source.
It is interesting to look at the relation of these scales to one another. The ratio is given by:
| (6) |
If then the jet will be collimated by the external pressure before the jet density has fallen to that of the surroundings. Once collimated the jet density does not decline further along its length. Therefore, for a cocoon does not form. Conversely, for a cocoon is formed first and the jet is collimated by the pressure in the cocoon. This second case is studied in detail by Komissarov & Falle (1998) and Alexander (2006), and the source transitions to near self-similar subsequent evolution. The ratio
| (7) |
gives the ratio of the collimated jet density to the external density. For a cocoon to form, , and for a substantial cocoon, . From Very Long Baseline Interferometry (VLBI), it is clear that the jets are initially relativistic (e.g. Britzen et al. 2008); on scales of kpc, their velocities are still a reasonable fraction of the speed of light (e.g. Hardcastle et al. 1999; Mullin & Hardcastle 2009). Hence, the external Mach-number for a jet is typically of order several hundred. For very small opening angles of degree, therefore a cocoon will not form. However, for larger opening angles cocoons will form.
The ratio is given by:
| (8) |
If then a lobed source, i.e. one that has formed a cocoon, also has the hotspots near the leading edges. From Equation (8), this is always the case. Hence, every radio source that has lobes went through a phase when it had its hotspots near the leading edges, i.e. it was once an FR II source. To remain an FR II source, the re-collimation shock needs to reach the axis, before the jet runs out of thrust. Calculation of this point is difficult. Alexander (2006) argues that re-collimation, in the case when the radio source is collimated by the pressure of a cocoon, should be completed at two to three times a length scale . corresponds to in the present paper, and the numerical factor is in excellent agreement with the results of the simulations we present below. Adopting a value of 2.5, the critical ratio becomes:
| (9) |
Thus, jets with a half opening angle below about have enough thrust to propel the terminal shock past the re-collimation shock. Once this occurs, the terminal shock may continue essentially indefinitely, since the beam is collimated, and the ram-pressure stays constant (the exception being an inverted pressure profile in the external medium). Such sources will end up as large-scale FR II radio sources.
Jets with a half opening angle greater than have the re-collimation shock so far downstream that the terminal shock is unable to reach it. In this case, the hotspot will stall at , and might turn into a flaring point. The exhaust plasma that leaves the beam may still form a classical cocoon for some time. The plasma downstream of the flaring point streams transsonically towards the tip of the cocoon. There is no clear distinction between jet and cocoon in this region. Ram-pressure balance between this plasma and the shocked ambient gas gives the velocity of the contact surface as where is the density ratio between the cocoon and the shocked ambient gas, and is the bulk velocity of the cocoon plasma. Therefore, as long as the cocoon plasma is underdense with respect to the shocked ambient gas, the contact surface must advance more slowly than the cocoon plasma. The cocoon plasma therefore builds up thermal pressure near its leading edge and forms a backflow in a part of the cocoon. The situation changes at some point because of entrainment of shocked ambient gas into the cocoon. When enough dense gas is mixed into the cocoon so that – spatially averaged – , the contact surface advances at the same velocity as the cocoon plasma. The morphology is then transformed into a chimney-like outflowing structure.
| Run | 222External Mach-number | 333Half opening angle / degree | 444Inner boundary of the computational domain / | 555Final size / | 666Length-scale where the sideways ram pressure equals the ambient pressure (re-collimation) | 777Length-scale where the sideways ram pressure equals the cocoon pressure at the end of the simulations | 888Length-scale where the density of the uncollimated jet would equal the ambient density (cocoon formation | 999Length-scale where the forward ram pressure of the uncollimated jet would equal the ambient pressure (terminal shock limit) | 101010Length-scale where the forward ram pressure of the uncollimated jet would equal the cocoon pressure at the end of the simulations | 111111Outer scale | 121212Radial resolution (max.) | 131313Meridional resolution (max.) / degree |
| M05 | 500 | 5 | 0.363 | 210 | 182 | 11 | 3.23 | 2087 | 130 | 3953 | 0.142 | 0.088 |
| M15 | 500 | 15 | 0.125 | 76 | 181 | 11 | 1.08 | 697 | 41 | 3953 | 0.049 | 0.352 |
| M30 | 500 | 30 | 0.062 | 50 | 176 | 9 | 0.54 | 352 | 18 | 3953 | 0.024 | 0.352 |
| m05 | 5 | 5 | 0.262 | 22 | 1.82 | 3.23 | 20.87 | 3.95 | 0.030 | 0.044 | ||
| m15 | 5 | 15 | 0.098 | 18 | 1.81 | 1.08 | 6.98 | 3.95 | 0.039 | 0.022 | ||
| m30 | 5 | 30 | 0.050 | 16 | 1.76 | 0.54 | 3.52 | 3.95 | 0.019 | 0.059 |
3 Numerics
We have carried out 2.5D axisymmetric hydrodynamics simulations with the FLASH code (v. 2.5 Fryxell et al. 2000; Calder et al. 2002) to demonstrate the physics outlined in the previous section. FLASH evolves the equations of compressible hydrodynamics conservatively, using third order (piecewise parabolic) interpolations. We have run six simulations of conical jets into a constant ambient density, chosing units of (length), (external density), and (external sound speed). The ratio of specific heats is . In these units, the external pressure is therefore .
We use spherical polar coordinates and the jet is implemented as a boundary condition. Other boundaries are reflective. In Section 2, we found that the opening angle and the Mach-number determine the characteristics of the flow. Therefore, we vary these parameters in the simulations. The other parameter that is required to define the simulation setup is the pressure ratio between the jet and the ambient medium. We set it to unity at the jet injection boundary, noting that the adiabatic expansion renders the beam pressure quickly insignificant. Finally, the computational domain specifies the outcome of the simulation. Our aim is to include all the relevant scales of Section 2. However, choosing a realistic external Mach number of 500, and starting the jet smaller than , we were unable to run the simulation for long enough for the jet to reach , as three to four orders of magnitude between the smallest and largest scales are required for the three opening angles we chose. Making use of the polar coordinates and the adaptive mesh refinement, we reach a few hundred times . Therefore, we have chosen a second set of simulations with an external Mach-number of 5. For this second set, all the relevant scales, including , are within the computational domain, and we reach four to five times . We choose three opening angles around the critical one defined in Equation (9). We label the simulations with a capital (small) M for the high and low Mach-number cases, respectively, followed by the half opening angle in degrees. The simulation parameters are summarised in Table 2.


4 Results
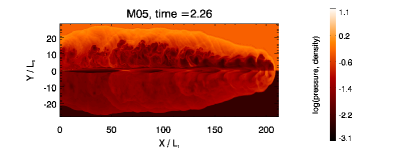
4.1 Structure
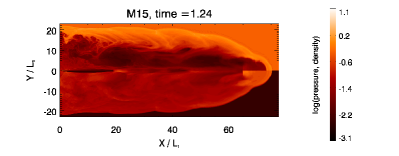
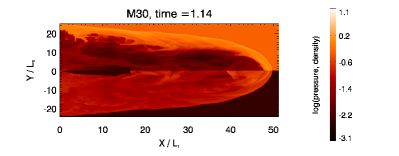
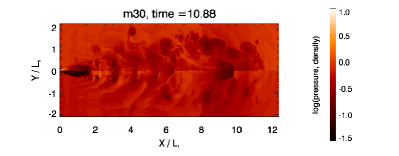
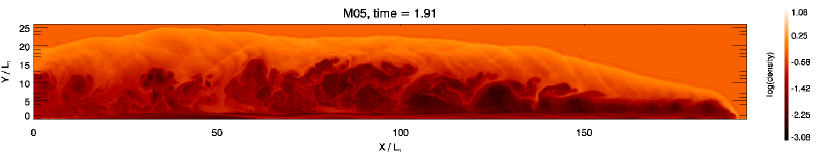
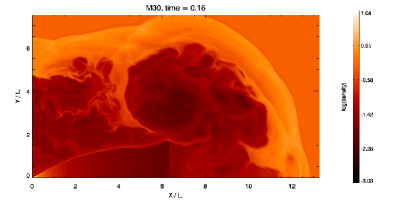
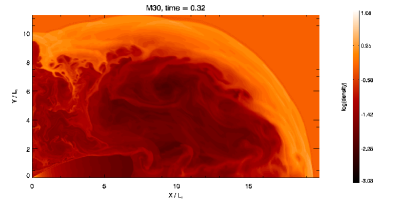
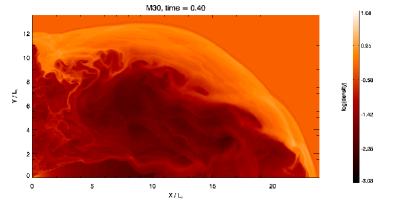
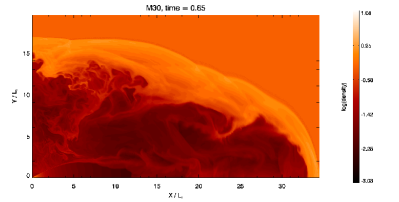
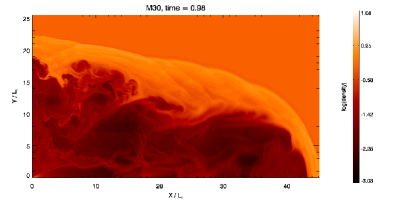
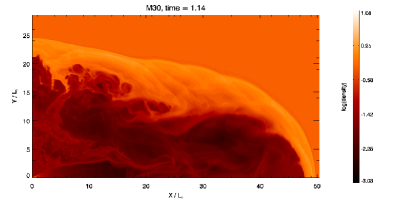
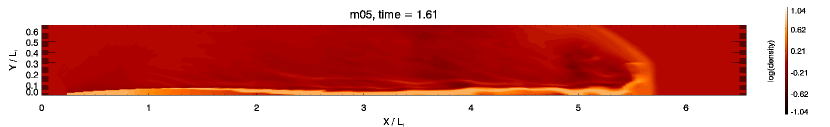
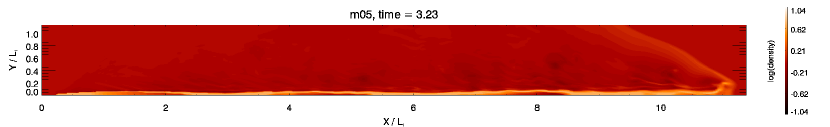
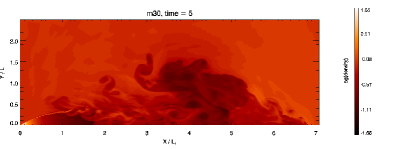
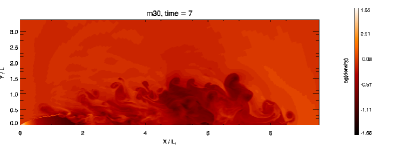
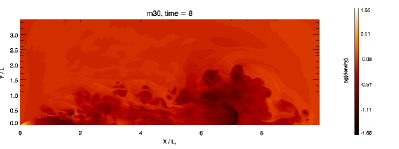
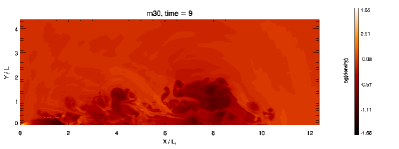
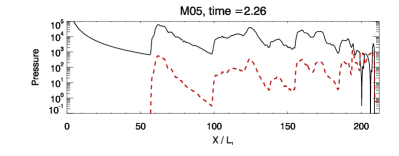
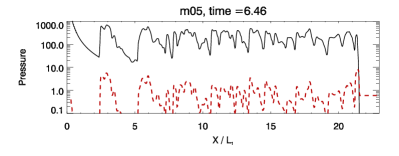
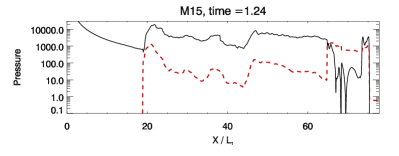
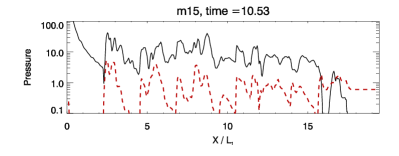
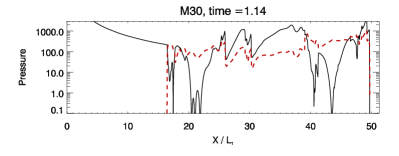
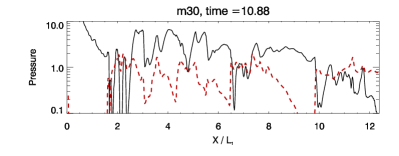
The spatial structure of the simulated radio sources is shown in Figure 1. From the discussion above, and Table 2, we expect – and find – all the high Mach-number simulations to be cocoon dominated, since is only a few , and , the length-scale which determines collimation, is much greater. is 20 to 80 times the maximum jet size, and therefore all the three jets are overpressured with respect to the external medium throughout the simulations. The strong bow shock seen in all three cases is evidence for this (Figures 2 and 3). Because of the high cocoon pressure, collimation occurs before ; there is however reasonable agreement with the length scales calculated for the sideways ram-pressure equalling the cocoon pressure. We denote the scales which refer to the cocoon pressure at the end of the simulations by and . They are also given in Table 2. Since the cocoon pressure declines with time, the re-collimation shock reaches the axis later for later simulation times (Figure 2, at , at and at , note the varying scale on the X-axis ). The re-collimation shock still reaches the axis comparatively late in run M05 – this is due to a pressure gradient in the cocoon towards the left (Figure 1). These features have already been noted by Komissarov & Falle (1998), and we find good agreement with their simulations. As predicted by Equation (9), the re-collimation shock always reaches the axis for the simulated jets with small opening angles and never reaches it for the ones with the large opening angles.
All the high Mach-number runs form very light jets and cocoons with . This is consistent with their ratios. At the times shown in Figure 1, the cocoons are overpressured by a factor of several tens to hundreds. As the jets evolve towards , the cocoon pressure drops and the collimated jets become even more underdense.
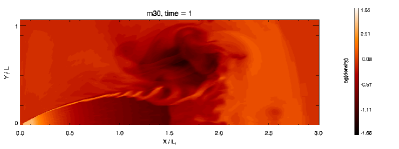
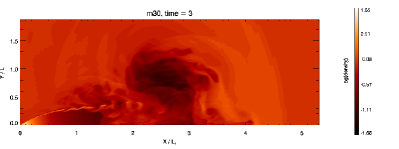
As predicted in Section 2, for run M30 the terminal shock cannot be propagated through the re-collimation shock. The jet does not therefore re-collimate properly, and a stable collimated beam cannot form. The terminal shock is however not strictly a standing shock. Its location is where the forward ram pressure equals the cocoon pressure (). At the end of the simulation , as calculated from the current cocoon pressure. This is in good agreement with the measured position. As can be seen from Figure 3, the position of the terminal shock advances with time, according to the declining cocoon pressure. In our simulation, the terminal shock never advances beyond the re-collimation shock, as expected from Equation (9) – the ratio between the terminal shock limit and the re-collimation scale only depends on the initial opening angle; run M30 demonstrates this result for a wide range of cocoon pressures.
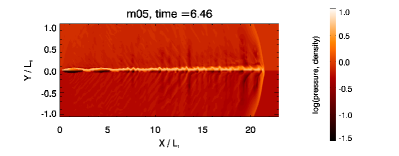
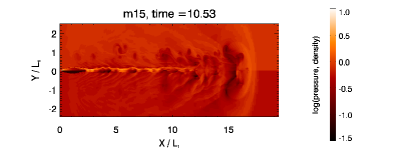
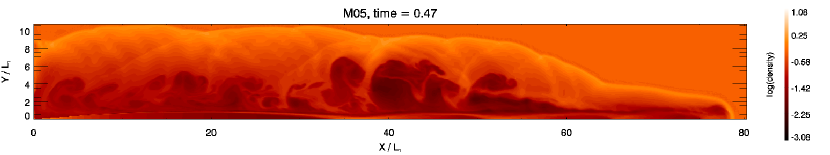
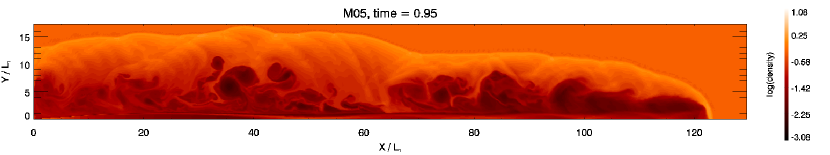
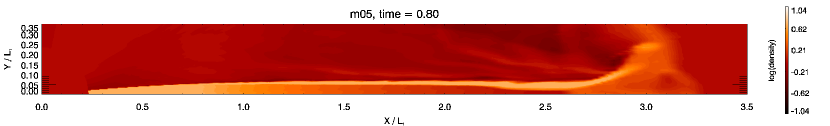
The low Mach-number runs may be found in the right column of Figure 1. In run m05, the re-collimation shock reaches the axis at about 3 , consistent with its value. This is only slightly larger than , and hence essentially no cocoon is formed. We expect – and find – the first reflection point of the re-collimation shock, where it meets the axis, to have a constant -value throughout the simulation (Figure 4). The density structure of the beam is a hollow spine with a dense sheath. On average, the beam stays overdense with respect to its environment, as expected from Equation (7). A minor filamentary cocoon forms for run m15 (Figure 1). The beam density in this case is almost matched to the environment. This is also as expected from the values of and (Table 2). For run m30, , and we expect an underdense jet with a significant cocoon, which is confirmed by the simulation. All the low Mach-number jets have expanded considerably beyond by the end of the simulation. Consequently, very weak bow shocks, if any at all, are found, except near the tip of the supersonically propagating runs m05 and m15. In a similar fashion to the high Mach-number case, only the simulation with a half opening angle of develops a stationary terminal shock (Figure 5). The predicted position ( in Table 2) is . From the simulation, we measure a value of , and it oscillates between and . The reason for the slight disagreement is the pressure enhancement downstream of the shock (Figure 6).
The cocoon in run m30 has transformed in an interesting way (Figure 5). While for the other simulations, the cocoon is oriented backwards, surrounding all of the jet, here it transforms into a roughly conical forward flowing structure. Compared with M30, in which the cocoon is overpressured by a factor of , m30 has expanded to more than three times and is in pressure equilibrium with the environment. Hence, if a cocoon had formed around the inner jet, it would have become Rayleigh-Taylor unstable. We have argued in Section 2 that such a morphological transformation should be related to strong entrainment. The re-collimation shock is unstable in the high opening angle runs; additionally in run m30 the ambient gas is in direct contact with the jet and efficient entrainment indeed happens at the re-collimation shock.
The terminal shock limit should be determined by the forward ram pressure becoming equal to the local thermal pressure. We confirm this from our simulations in Figure 6. For the runs with half opening angle , where the terminal shocks occur before re-collimation there is indeed a close match between the two near their terminal shock regions ( and for runs m30 and M30, respectively). In run M30, the terminal shock is clearly kept at its position by the cocoon pressure. For the other simulations, the ram-pressure gets sometimes remarkably close to the thermal pressure near the position where the re-collimation shock hits the axis. It is, however an oblique shock, and no exact match is required. The internal jet Mach-number is related to the ratio of the ram pressure to the thermal pressure. From Figure 6, the internal Mach-numbers are therefore of order ten for runs m05, M05 and M15. For run m15, it varies between two and six. Even for the high opening angle runs, the internal Mach-number downstream of the terminal shock quite often exceeds two.
4.2 Fanaroff-Riley classification
The simulations we present above show a clearly distinct morphology. In order to link them to the observed structures of radio sources, we have to derive properties of the associated synchrotron emission, which is due to non-thermal, relativistic particles and magnetic fields. Neither is included in our simulations. For the FR classification, we concentrate on low frequency radio emission. The latter is however commonly approximated by , where is the thermal pressure (e.g. Saxton et al. 2002). The idea behind this is the following: The emitting particles are accelerated in shocks, which also raise the pressure. After acceleration, the particles suffer adiabatic losses, while being advected away from the shock. Similarly, the pressure in the hydrodynamic simulation declines when the plasma re-expands behind a shock wave. The exponent follows from the equipartition argument.
For our low opening angle runs, strong shocks map on to pressure enhancements. However, for the high opening angle runs (M30, m30), the strongest shock for much of the simulation time is the standing terminal shock in the re-collimation region, but the pressure is fairly uniform from the post-shock region, downstream into the cocoon (Figure 6). It is therefore more realistic to include a measure of the shock strength directly into the emissivity. The compression rate in the flow is characterised by , where is the velocity vector. It also traces adiabatic compression and expansion, but the compression is strongest in shocks.
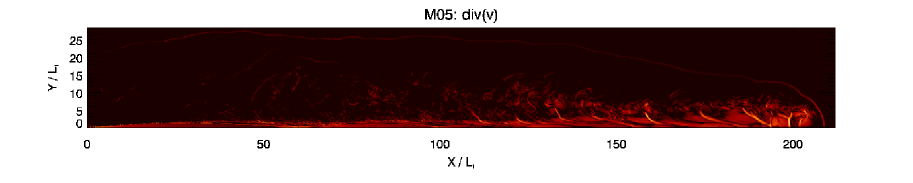
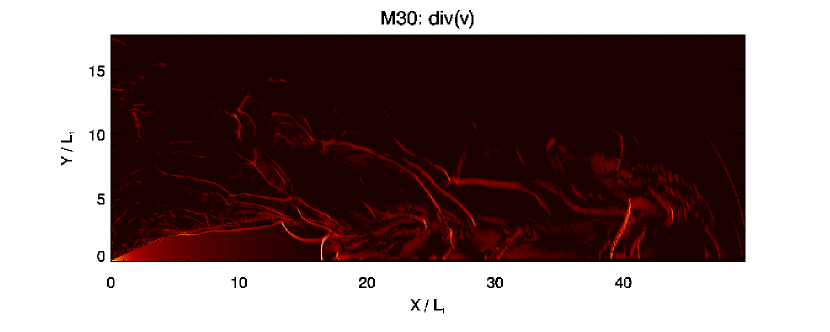
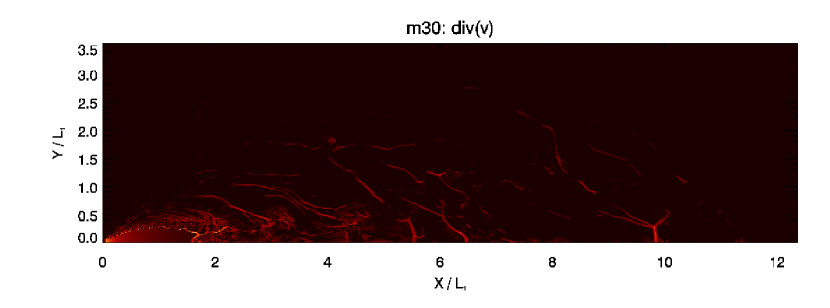
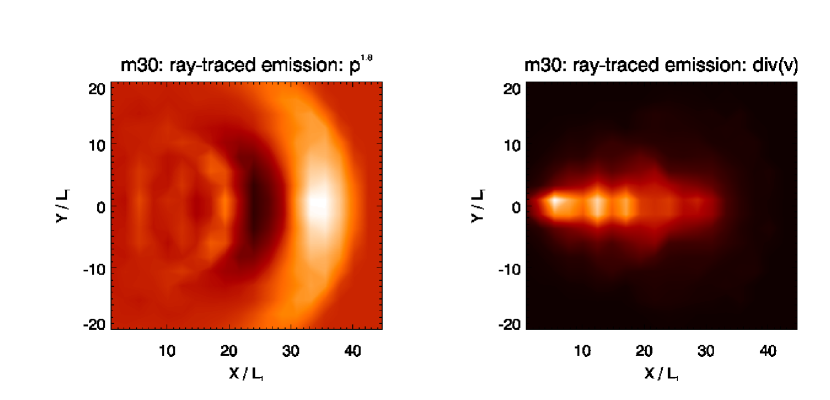
Figure 7 shows for runs M05, M30 and m30 for the final snapshots. Besides the initial adiabatic expansion in the conical part of the jet, the plots are dominated by linear shock features. Clearly, for run M05, the strongest shock is the classical Mach disk near the head of the source. Moderately strong shocks are found around the Mach disk and somewhat upstream. The shocks are concentrated in the outermost half of the jet. This is in sharp contrast to the high opening angle runs M30 and m30. Here, the strongest shock is the standing terminal shock in the re-collimation region, and many weaker shocks are located in the vicinity. We quantify this in Figure 8, where we plot the integral of the compression rate perpendicular to the axis, (i.e. positive values which are not related to shocks are set to zero). We use ten bins along each jet in order to avoid overemphasising isolated features, and give the bin size and the standard deviation of the compression rate in each bin as horizontal and vertical error bars, respectively. All runs with half opening angle of or less display the strongest shocks in the head region, which is evident from the large error bars there. In contrast, for the high opening angle runs the standing terminal shock in the re-collimation area is the strongest feature, also, when averages over larger areas are considered, as we have done here. Correspondingly, the compression rate reaches the highest values near that site, in the innermost part of the jet. Thus, the shock structure in high opening angle runs is clearly distinct from the one in low opening angle simulations. Yet, the maximum of the pressure is always close to the tip of the jet, also for runs M30 and m30. We exemplify this for the final snapshot of run m30 in Figure 9, where we compare emission maps using and as respective emission tracers. Clearly, the assumption that pressure maxima trace strong shocks is not generally correct for our high opening angle runs, and we need another proxy for the emissivity.
Shocks are most directly traced by the compression rate . Realistically, the particles would suffer losses while streaming away from the shocks, which smooths out the emission over a certain length behind the shock. We cannot hope to model the detailed appearance of these emission features with our simulations in any useful way. However, the total emission initiated by any given shock should be related to the strength of the shock and its area.
For connecting our results to observations we therefore believe it is appropriate to take the integrated compression rate defined above () as a measure of the emissivity. At the same time we have reduced the spatial resolution so that the emission due to each shock is assigned to a larger volume.
Also in observations the radio emission appears knotty. A given radio knot is most likely retaled to one particular shock or shock complex. Additionally, the FR classification has originally been established using low resolution radio maps (Fanaroff & Riley 1974). It is therefore appropriate that we also smooth the simulation results to a comparable resolution.
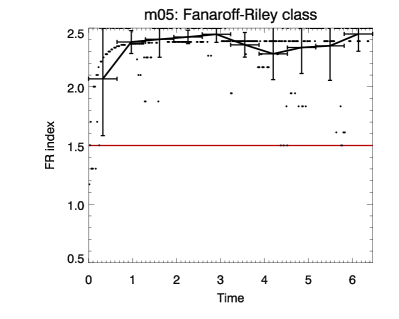
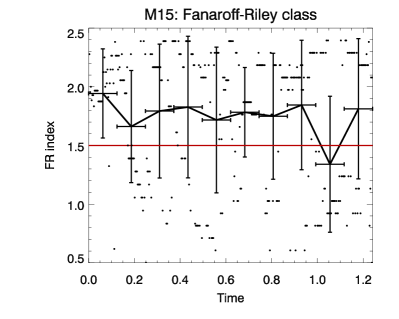
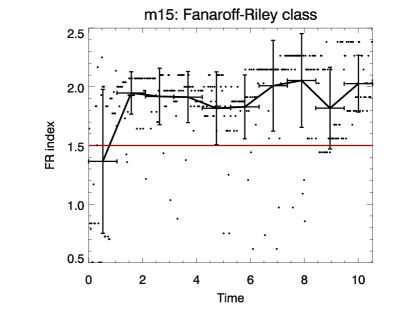
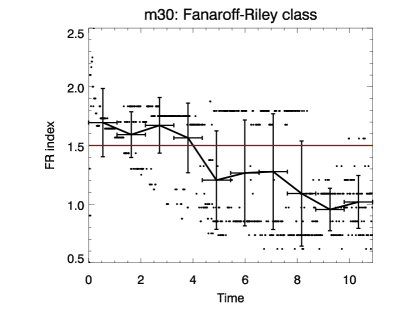
With this choice for the emissivity, we produced pseudo-radio maps for all the 2949 snapshots of our six runs, and smoothed it to 20 resolution elements along the axis. We defined the source size by the extent of the pseudo-radio emission along the -axis, up to the point where the emission drops below five per cent of the maximum value (). We also calculate the position of the brightest feature . Finally, we define the FR-index as:
| (10) |
With this definition, FR for an FR I radio source, and FR for an FR II radio source.
We show FR against simulation time in Figure 10. For runs M05 and M15, the average FR is almost always clearly above 1.7, indicating an FR II source, as expected. The values below 1.5 are mostly due to shocks near the inner boundary, which sometimes get quite strong, especially because of the reflecting boundary conditions we use. This artifact of the procedure does however not destroy the general trend. We also find a clear FR II morphology for the heavy low opening angle jets m05 and m15. Run m30 is an FR II source until it reaches its terminal shock limit around . From then onwards, it changes its character to an FR I radio source. For run M30, the FR index is on average above 1.5 for times earlier then , and below afterwards – but only marginally so. So, it makes principally the same transition as run m30, but the transition is much less marked. In this case the jet is quite underdense, forming a prominent cocoon, which protects it against entrainment of the ambient medium; it therefore transports more energy to its head region than the m30 jet. Consequently, the head region also contains strong shocks, and the emission maximum is often located there. We expect that the FR II branch of the diagram, which is already weaker than the FR I branch after , would die out completely, as in run m30, if there were stronger entrainment. This could happen either when the cocoon approaches the pressure of the environment, or if it had a sufficient source of gas, for example a gas disk in its equatorial plane.


5 Discussion
We have demonstrated both analytically and by hydrodynamics simulation that for jets collimated by the external pressure, the large-scale morphology developed as a result of the interaction of the jet with its surroundings near its collimation region. The ratios of three critical length scales to one another control the behaviour. Only two of them are independent, and they are set by the jet’s opening angle and external Mach-number.
We find that light jets with cocoons form for high external Mach-numbers and moderate to large opening angles. It is well known that the majority of extragalactic radio sources have extended radio lobes and the jets are therefore very light compared to the external medium.
We predict that all lobed sources go through a phase in which hot spots occur near the tip of the lobe. If the jets collimate before their ram-pressure falls below the thermal pressure of the environment, then the jet retains FR II morphology. In our combined analytical / simulation analysis, this depends on the initial opening angle of the jet with a transition for . Our simulations with and confirm this scenario, and consistently develop FR II morphology.
The jets with run out of thrust, before the re-collimation shock reaches the axis. This result does not depend on the external Mach-number, which differs by a factor of 100 between our two 30∘ runs.
Run m30 has high opening angle and low external Mach number. This results in a collimated jet density that is only slightly below the ambient density. Consequently, the cocoon is not as pronounced as in the higher external Mach number runs, and is not able to shield the jet from the ambient medium. Instabilities at the re-collimation shock, which are pronounced at high opening angle, entrain ambient gas directly in the jet in this run. This slows the jet down, which produces a conical turbulent flow downstream of the re-collimation shock. Because of the large opening angle, the ram pressure of the jet is insufficient to propagate the terminal shock through the re-collimation shock. In effect, the jet shows FR II morphology until the terminal shock reaches its limiting location, and appears as an FR I source afterwards.
Run M30 has a very similar shock structure to that of run m30. We also classify it on average as FR I at late times. This suggests that the transition from class II to class I is independent of the jet velocity, which differs by two orders of magnitude between the runs, but only depends on the initial opening angle.
The cocoon of run M30 differs from that of run m30: it has lower density and at the end of the simulation it still effectively prevents entrainment of ambient gas. As argued above, this also leads frequently (but still in the minority of snapshots) to dominant shocks in the head region. M30’s cocoon could transform to a morphology similar to that of run m30 if it entrained sufficient amounts of dense ambient gas. The cocoon itself is stabilised against entrainment of ambient gas due to Rayleigh-Taylor instabilities by its deceleration (Alexander 2002). The deceleration up to a source size of can be approximated by a power law (e.g. Kaiser & Alexander 1997). This power law breaks down when the source approaches , and the sideways expansion stalls (Gaibler et al. 2009 show this for FR II jet simulations). The cocoon is then Rayleigh-Taylor unstable and will be refilled with ambient gas, which will also lead to entrainment into the main beam (i.e. the forward flow downstream of the re-collimation shock). The cocoon will transform accordingly and this should result in a source structure similar to the m30 run. Our M30 run is however a factor of 100 away from this transition point, and for the present study we did not have the computational resources to simulate this far. Kaiser & Best (2007) invoke this expansion to and the subsequent entrainment as the sole mechanism to account for the FR dichotomy.
Observations of the FR I source Centaurus A (e.g. Hardcastle et al. 2007) suggest another source of entrainment. If the re-collimation shock is located inside a dense gas disk, that gas disk would be difficult to push aside, and the dense gas might come close to the beam (Neumayer et al. 2007), especially if the latter precesses (Morganti et al. 1999). Entrained gas can be resolved in this source (e.g. Tingay & Lenc 2009). This confirms that entrainment might be an important factor for a radio source to show FR I morphology. Centaurus A shows evidence for a high Mach number bow shock (Croston et al. 2009), and is therefore still far from pressure equilibrium with its surroundings. A mechanism as proposed by (Kaiser & Best 2007), which relies entirely on the radio source to be close to pressure equilibrium with its surroundings, therefore seems to have difficulties to explain the observations of Centaurus A. Stellar winds within the jet (Komissarov 1994) are another possible mechanism by which dense gas is brought to the jet plasma.
While entrainment has been recognised in many studies as being important for the emergence of an FR I morphology, we find there is another, necessary condition – a large opening angle for the jet. Regarding observed opening angles, probably the best studied cases are M87 (FR I) and Cygnus A (FR II). Junor et al. (1999) present an observational study of the inner jet in M87. The jet starts out at an apparent half opening angle of about at about 0.04 pc distance from the core. Its opening angle then reduces gradually to about about 14 pc distance from the core. In our simulations, collimation also happens gradually, over a comparable length scale ratio of about two orders of magnitude. Gracia et al. (2009) present a detailed analysis of the inner jet of M87, using a magnetohydrodynamics-based fit to the observational data. The available data constrains their models well. Among 2600 MHD models, they find several that fit the data well, apart from the innermost point with the largest opening angle. Discarding the innermost data point yields a second innermost opening angle of only about . While this might first appear to contradict our results (see below), the other features of their best-fitting models are in good agreement. They find that the limb brightening of the jet is due to enhanced intrinsic emission, rather than a beaming effect due to velocity structure. Further, they identify the bright feature ’knot A’ with a re-collimation shock. If the jet density is related to the emissivity, limb brightening before the re-collimation shock reaches the axis is predicted by our simulations. It is a natural consequence of the transition from a conical to a pressure collimated jet, which has already been noted by Komissarov & Falle (1998).
The opening angles derived from observations cannot be directly compared to the initial opening angles we impose in our simulations or use in our analytic work. This is because the jet base is both hard to resolve and might not display bright features over the full jet width. The first reflection point of the re-collimation shock on the axis, or for FR I sources the flaring point will be locations of bright emission, where an opening angle could easily be measured. Using this point, we obtain measured half opening angles of for our simulations of initial opening angle. The half opening angle at knot A in M87 is (Junor et al. 1999). The agreement with our results is reasonably good for M87, given that the observational value is a lower limit, since the full width at quarter maximum is used, and in addition, our simulations do not take into account magnetic and relativistic effects.
Measuring the opening angle at the first reflection point of the re-collimation shock yields a half opening angle of for runs M05 and M15. Komissarov & Falle (1998) present similar simulations to our low opening angle cases and compare then in detail to the FR II radio source Cygnus A. From Cygnus A’s measured cocoon aspect ratio, they predict an initial half opening angle between and . They identify knot 3 at 8 arcsec (about 6.4 kpc) distance from the core as the first reflection point of the re-collimation shock. As in the case of M87, they mention the limb brightening to support this identification. They quote an opening angle of , measured at 20 arcsec from the core, pointing out that the measurement is inconsistent with their predicted initial opening angle. However, when doing the measurement in a similar way for the simulation and for the observation, the opening angle on the scale of the re-collimation shock is actually very similar.
The most important parameter that correlates with the observed jet morphology is the jet power. We find that only jets with a large initial opening angle have the potential to form an FR I source. This suggests an anti-correlation of the opening angle with the jet power. Pushkarev et al. (2009) present a sample of parsec scale radio sources, all having opening angles of order a few degrees. Interestingly, they find an anti-correlation between the opening angle and the Lorentz-factor, which is consistent with the jet acceleration model of Komissarov et al. (2007). Therefore, there might indeed be a correlation of a jet’s opening angle with its power. We are not aware of a systematic study of the correlation of the jet opening angle with FR class.
We identify the quasi-stationary terminal shock in the high opening angle runs with the flaring point in FR I jets. This is in line with other theoretical work (e.g. Bicknell 1984; Perucho & Martí 2007). Observationally, Hardcastle et al. (2005) and Jetha et al. (2005) find that the flaring point is located in a region of flattening ambient pressure profile – a result that can be understood in the sense that in such a region it is much more likely that the jet’s ram-pressure will become equal to the ambient pressure.
If the identification of the flaring point with is correct, the location of the flaring point would constrain . Together with information on the jet speed, the external density and pressure, this would provide the possibility of measuring the power of FR I jets.
We do not expect that the general features we discuss here would change if we had done the simulations in three dimensions. Komissarov & Falle (1998) have done simulations of low opening angle axisymmetric FR II jets for both the relativistic and the non-relativistic case, with very comparable results. The critical angle for the morphological transition depends on the angle that the re-collimation shock makes with the axis. In this respect, our results for and opening angle are quite similar to their and cases. Also their relativistic simulations show quite similar behaviour. The critical angle of we derive is consistent with the fact that Komissarov & Falle (1998) still find FR II structure at for their relativistic and non-relativistic cases alike. While the value of the critical angle might depend on where the re-collimation shock exactly meets the axis, which may well depend on details and also possibly on the magnetic field, we expect the general result to be robust.
6 Conclusions
We have shown that the large-scale morphology of pressure collimated jets is determined by the processes near the region where the jet collimates due to the ambient pressure. We find that the main requirement to form a very underdense jet, and therefore a wide radio lobe is a high external Mach number. We find a clearly distinct shock structure for jets with initial half opening angles below and above about , respectively. Jets with lower opening angles always have FR II morphology, and we classify them accordingly by an appropriate FR-index based on the shock structure. Higher opening angle jets are found to transition from class II to class I. In the latter case, entrainment is identified as an important factor in the jet morphology. The initial opening angle near the jet base is much larger than the observed one. Predicting the observed opening angle from our simulations results in values which agree well with observations of M87 and Cygnus A.
Acknowledgements
The software
used in this work was developed by the DOE-supported
ASC/Alliance Center for Astrophysical Thermonuclear Flashes at the
University of Chicago.
References
- Alexander (2002) Alexander P., 2002, MNRAS, 335, 610
- Alexander (2006) —, 2006, MNRAS, 368, 1404
- Bicknell (1984) Bicknell G. V., 1984, ApJ, 286, 68
- Bicknell (1986a) —, 1986a, ApJ, 300, 591
- Bicknell (1986b) —, 1986b, ApJ, 305, 109
- Britzen et al. (2008) Britzen S. et al., 2008, A&A, 484, 119
- Calder et al. (2002) Calder A. C. et al., 2002, ApJS, 143, 201
- Croston et al. (2009) Croston J. H. et al., 2009, MNRAS, 395, 1999
- Falle (1991) Falle S. A. E. G., 1991, MNRAS, 250, 581
- Fanaroff & Riley (1974) Fanaroff B. L., Riley J. M., 1974, MNRAS, 167, 31P
- Fryxell et al. (2000) Fryxell B. et al., 2000, ApJS, 131, 273
- Gaibler et al. (2009) Gaibler V., Krause M., Camenzind M., 2009, MNRAS, 400, 1785
- Ghisellini & Celotti (2001) Ghisellini G., Celotti A., 2001, A&A, 379, L1
- Gracia et al. (2009) Gracia J., Vlahakis N., Agudo I., Tsinganos K., Bogovalov S. V., 2009, ApJ, 695, 503
- Gültekin et al. (2009) Gültekin K. et al., 2009, ApJ, 698, 198
- Hardcastle et al. (1999) Hardcastle M. J., Alexander P., Pooley G. G., Riley J. M., 1999, MNRAS, 304, 135
- Hardcastle et al. (2007) Hardcastle M. J. et al., 2007, ApJ, 670, L81
- Hardcastle et al. (2005) Hardcastle M. J., Sakelliou I., Worrall D. M., 2005, MNRAS, 359, 1007
- Heath et al. (2007) Heath D., Krause M., Alexander P., 2007, MNRAS, 374, 787
- Jetha et al. (2005) Jetha N. N., Sakelliou I., Hardcastle M. J., Ponman T. J., Stevens I. R., 2005, MNRAS, 358, 1394
- Junor et al. (1999) Junor W., Biretta J. A., Livio M., 1999, Nature, 401, 891
- Kaiser & Alexander (1997) Kaiser C. R., Alexander P., 1997, MNRAS, 286, 215
- Kaiser & Best (2007) Kaiser C. R., Best P. N., 2007, MNRAS, 381, 1548
- Komissarov (1990a) Komissarov S. S., 1990a, Astrophysics and Space Science, 171, 105
- Komissarov (1990b) —, 1990b, Astrophysics and Space Science, 165, 313
- Komissarov (1990c) —, 1990c, Astrophysics and Space Science, 165, 325
- Komissarov (1994) —, 1994, MNRAS, 269, 394
- Komissarov et al. (2007) Komissarov S. S., Barkov M. V., Vlahakis N., Königl A., 2007, MNRAS, 380, 51
- Komissarov & Falle (1998) Komissarov S. S., Falle S. A. E. G., 1998, MNRAS, 297, 1087
- Krause (2003) Krause M., 2003, A&A, 398, 113
- Krause (2005) —, 2005, A&A, 436, 845
- Ledlow & Owen (1996) Ledlow M. J., Owen F. N., 1996, AJ, 112, 9
- McNamara et al. (2005) McNamara B. R., Nulsen P. E. J., Wise M. W., Rafferty D. A., Carilli C., Sarazin C. L., Blanton E. L., 2005, Nature, 433, 45
- Morganti et al. (1999) Morganti R., Killeen N. E. B., Ekers R. D., Oosterloo T. A., 1999, MNRAS, 307, 750
- Mullin & Hardcastle (2009) Mullin L. M., Hardcastle M. J., 2009, MNRAS, 398, 1989
- Mullin et al. (2006) Mullin L. M., Hardcastle M. J., Riley J. M., 2006, MNRAS, 372, 113
- Mullin et al. (2008) Mullin L. M., Riley J. M., Hardcastle M. J., 2008, MNRAS, 390, 595
- Neumayer et al. (2007) Neumayer N., Cappellari M., Reunanen J., Rix H.-W., van der Werf P. P., de Zeeuw P. T., Davies R. I., 2007, ApJ, 671, 1329
- Nulsen et al. (2005) Nulsen P. E. J., Hambrick D. C., McNamara B. R., Rafferty D., Birzan L., Wise M. W., David L. P., 2005, ApJ, 625, L9
- Owen (1993) Owen F. N., 1993, in Jets in Extragalactic Radio Sources, Proceedings of a Workshop Held at Ringberg Castle, Edited by H.-J. Röser and K. Meisenheimer. Springer-Verlag Berlin Heidelberg New York. Also Lecture Notes in Physics, vol. 421, pp. 273–+
- Owen & Laing (1989) Owen F. N., Laing R. A., 1989, MNRAS, 238, 357
- Owen & White (1991) Owen F. N., White R. A., 1991, MNRAS, 249, 164
- Perucho & Martí (2007) Perucho M., Martí J. M., 2007, MNRAS, 382, 526
- Pushkarev et al. (2009) Pushkarev A. B., Kovalev Y. Y., Lister M. L., Savolainen T., 2009, A&A, 507, L33
- Rossi et al. (2008) Rossi P., Mignone A., Bodo G., Massaglia S., Ferrari A., 2008, A&A, 488, 795
- Saxton et al. (2002) Saxton C. J., Sutherland R. S., Bicknell G. V., Blanchet G. F., Wagner S. J., 2002, A&A, 393, 765
- Scheuer (1974) Scheuer P. A. G., 1974, MNRAS, 166, 513
- Tingay & Lenc (2009) Tingay S. J., Lenc E., 2009, AJ, 138, 808
- Wang et al. (2009) Wang Y., Kaiser C. R., Laing R., Alexander P., Pavlovski G., Knigge C., 2009, MNRAS, 397, 1113
- Wold et al. (2007) Wold M., Lacy M., Armus L., 2007, A&A, 470, 531