Dissecting the stellar mass-SFR correlation in star-forming disk galaxies
Abstract
Using a mass-limited sample of 24m-detected, star-forming galaxies at , we study the mass-star formation rate (SFR) correlation and its tightness. The correlation is well defined ( dex) for disk galaxies (), while more bulge-dominated objects often have lower specific SFRs. For disk galaxies, a much tighter correlation ( dex) is obtained if the rest-frame H-band luminosity is used instead of stellar mass derived from multicolor photometry. The specific SFR (sSFR) correlates strongly with rest-frame optical colors (hence luminosity-weighted stellar age) and also with clumpiness (which likely reflects the molecular gas fraction). This implies that most of the observed scatter is real, despite its low level, and not dominated by random measurement errors. After correcting for these differential effects a remarkably small dispersion remains ( dex), suggesting that measurement errors in mass or SFR are dex, excluding systematic uncertainties. Measurement errors in stellar masses, the thickening of the correlation due to real sSFR variations, and varying completeness with stellar mass, can spuriously bias the derived slope to lower values due to the finite range over which observables (mass and SFR) are available. When accounting for these effects, the intrinsic slope for the main sequence for disk galaxies gets closer to unity.
Subject headings:
galaxies: evolution — galaxies: formation — galaxies: fundamental parameters — galaxies: structure — galaxies: high-redshift1. Introduction
Star-forming galaxies obey a tight correlation between stellar mass and star formation rate (SFR), from the local Universe (e.g., Elbaz et al. 2007; based on Brinchmann et al. 2004; Peng et al. 2010), all the way to intermediate and at high redshifts (e.g., Noeske et al. 2007; Elbaz et al. 2007; Daddi et al. 2007; Pannella et al. 2009a; Magdis et al. 2010; Karim et al. 2011; Daddi et al. 2009; Stark et al. 2009; Lee et al. 2011; Gonzalez et al. 2010; Bouwens et al. 2011). With a scatter of dex at all redshifts where it has been measured, this relation is now known as the Main Sequence (MS) of star-forming galaxies. This finding has several interesting implications: (1) there is a high degree of uniformity among star-forming galaxies, and stellar mass is a crucial parameter regulating the SFR; (2) fluctuations in specific SFRs throughout the star formation histories of actively star-forming galaxies are minor in all but a small number of outliers (e.g., Rodighiero et al. 2011); (3) at high redshifts, the SFR of individual galaxies must increase rapidly with time (Daddi et al. 2007; Renzini 2009; Peng et al. 2010; Papovich et al. 2011).
The existence of such a tight relation raises several questions. First, it is often believed that stellar masses and SFRs for individual galaxies cannot be measured to much better than a factor of two precision, even in relative terms. This raises the question whether the small spread in the mass-SFR correlation is actually dominated by measurement errors, implying a potentially smaller intrinsic scatter. The question applies to other tight relations recently discovered for normal galaxies, like that between mid-IR and total IR luminosity (Elbaz et al. 2011, scatter dex), and between SFR and CO luminosity (scatter dex; Daddi et al. 2010ab; Genzel et al. 2010; Sargent et al. 2012, in preparation). Intimately related to this is a second issue which deals with the slope of the correlation. Writing SFR, it is generally found that , but results vary from to , depending on sample definition, the adopted SFR indicator, and (perhaps) redshift (e.g., Pannella et al. 2009a; Karim et al. 2011). Finally, it is generally found that the mass-SFR correlation holds for star-forming galaxies only, but the term “star-forming galaxy” is somewhat ambiguous. For example, one can refer to star-forming BzK samples at (e.g., Daddi et al. 2007; Pannella et al. 2009a), or to blue-cloud galaxies at to 1 (e.g., Elbaz et al. 2007; Peng et al. 2010), or to Lyman break galaxies at . It would be desirable to explicitly study what happens for objectively selected and complete samples of all star-forming galaxies down to low levels of specific SFR (henceforth, sSFR), well below the MS. To start addressing these questions, we will explore in this letter the role of physical parameters, including morphology, in driving the mass-SFR correlation. We assume a WMAP concordance cosmology and a Chabrier IMF.
2. Sample selection and measurements
We study a sample of galaxies at extracted from the -band selected catalog of Daddi et al. (2007) in GOODS-S. We consider all star-forming galaxies with a S/N detection and flux Jy at m from Spitzer+MIPS (e.g., Magnelli et al. 2011). We remove 56 AGNs significantly detected in the 2 Ms Chandra X-ray data (Alexander et al. 2003). There are 599 galaxies in the sample, of which 70% have spectroscopic redshifts and the remainder have accurate photometric redshifts from Grazian et al. (2006). Detailed spectral energy distributions (SEDs) are available based on multi-color imaging from the -band through the mid-infrared, which we use to derive rest frame magnitudes and colors by spline-interpolation between adjacent photometry. Stellar masses are derived from SED fitting ( hereafter), using a wide range of star formation histories, metallicity, and allowing for dust reddening, using the method described in Le Borgne & Rocca-Volmerange (2002) and as used in Elbaz et al. (2007; 2011). The Spitzer 24m fluxes are converted into SFRs using SED templates from Chary & Elbaz (2001). Analyses of Spitzer and Herschel far-infrared data have shown this approach to be reliable for galaxies at (Magnelli et al. 2009; Elbaz et al. 2010, 2011). The infrared-based SFR is added to the unobscured component computed from the UV 1500Å luminosity (extrapolated from the observed photometry using the best-fitting SED model), without correction for dust extinction. By comparing the latter to the total SFR, we obtain a direct estimate of the dust attenuation at 1500Å (A1500) that we use to correct absolute magnitudes and rest frame colors for reddening, based on the Calzetti et al. (2000) extinction law. These extinction-corrected magnitudes and colors are used throughout the following analysis.
One aspect that we want to explore is the effect of galaxy morphology on the mass-SFR correlation of star-forming galaxies. Using GALFIT (Peng et al. 2002) we model the HST+ACS z-band images of each object (Giavalisco et al. 2004, release 2.0), deriving the Sérsic index () and half-light radius. It is well known that star-forming galaxies become clumpier at higher redshifts (e.g., Elmegreen et al. 2004; Forster-Schreiber et al. 2009), hence we have also investigated the role of clumpiness. Galaxy clumpiness is generally defined as the fraction of light in high spatial frequency structures (Conselice 2003; Lotz et al. 2004). Here we measure clumpiness () after subtracting the GALFIT model () from the image () of each galaxy:
| (1) |
The images in both the numerator and denominator are convolved by the PSF, and we exclude pixels within to reduce the noise, thus measuring residual structures only above this intensity threshold. The average is performed over the segmentation map of the galaxy, as defined by SExtractor, which is meant to produce an intensive measurement of clumpiness, normalized by the spatial extent of the galaxy (AS). We would expect that this measurement should correlate better with SFR per unit surface area rather than with SFR itself, and we thus also use an extensive measurement of clumpiness defined as that should be more closely related to the SFR. We find that is better correlated with visual clumpiness classification performed for our sample. Clumpiness is sensitive to all sorts of structures, including clumps but also to the strengths of spiral arms and anything deviating from a single Sérsic fit.
3. Results
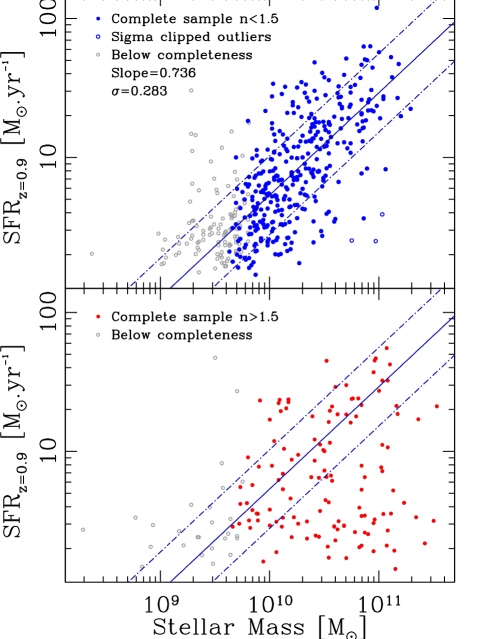
When plotting galaxies in the mass-SFR plane (Figure 1), we find that bona-fide disk galaxies (447 objects with , or 72% of the parent 24m-selected sample) display a clear, well-defined correlation. We adopt here a lower threshold than the canonical separation of disks/ellipticals in order to have a cleaner sample of disks, at the expense of completeness. Instead, some more bulge-dominated () galaxies fall near the correlation for disk galaxies, while others have lower sSFRs (Figure 1), consistent with the results of Wuyts et al. (2011). The latter galaxies are often visually classified as ellipticals and have red optical colors. We conclude that the mass-SFR correlation is primarily a sequence of star-forming disk galaxies. Comparing to color selections, 96% of galaxies fall in the blue-cloud, while conversely 73% of blue-cloud galaxies have , implying that a blue-clould selection of star-forming galaxies results in a higher dispersion. Including galaxies would also bias the slope, as completeness as a function of sSFR varies strongly with mass in a SFR-limited sample (we are considering only 24m-detected galaxies), i.e., a Malmquist bias. Red, bulge-dominated objects with sSFR more than 0.6 dex below the MS contribute of the total SFR density from galaxies. This is likely to be an overestimate because the 24m emission in some of these red spheroids, rather than from star formation, could come from winds in evolved stars (e.g., Vega et al. 2010) or to an AGN torus, whereas the rejection of X-ray-detected AGNs is strongly reducing the number of main sequence galaxies at the highest stellar masses (Mullaney et al. 2012). In the following analysis, we consider only the sample of 338 disk galaxies satisfying redshift dependent mass limits which guarantee completeness down to the lower edge of the MS. At stellar masses higher than such mass limits, galaxies can be detected to even lower sSFRs. This can lead to a spurious flattening of the measured slope.
| Parameters () | Coefficients () | RMS | Outliers rej. |
| Values (S/N) | dex | Fraction (%) | |
| (1) | (2) | (3) | (4) |
| , log M, log ((1+z)/1.9) | -6.631(15.3), 0.736(11.4), 2.791(9.1) | 0.283 | 0.89 |
| , log , log ((1+z)/1.9) | -11.733(29.0), 1.150(31.4), 0.689(3.0) | 0.186 | 2.20 |
| , log M, log ((1+z)/1.9) | -9.110(18.4), 0.979(20.4), 1.416(4.8) | 0.246 | 1.68 |
| , log M, log ((1+z)/1.9), | -10.147(32.4), 1.080(35.6), 0.093(0.48), -0.923(21.7) | 0.154 | 2.02 |
| , log M, log ((1+z)/1.9), | -7.329(21.9), 0.804(24.7), 1.632(6.64), -0.969(16.2) | 0.215 | 2.36 |
| , log M, log ((1+z)/1.9), , log Sext | -9.145(28.8), 0.983(32.0), 0.406(2.2), -0.956(24.4), 0.149(6.4) | 0.139 | 3.03 |
| Const, log M, log ((1+z)/1.9), , log Sext | -6.345(18.7), 0.709(21.4), 1.917(8.0), -0.944(16.6), 0.224(7.2) | 0.208 | 1.47 |
Notes: M, and M are in solar Units; the absolute scale of is arbitrary
We now explore to which extent real variations of galaxy properties contribute to the thickness of the mass-SFR relation. We treat SFR as the dependent variable and present multiple linear fits of log(SFR) as a function of log mass and other measured galaxy properties (’s):
| (2) |
where ’s are coefficient to be determined by the fit (see Table 1 for the different fits performed).
Given the fairly wide
redshift range explored, over which the normalization of
the mass-SFR relation changes appreciably, we scale
all SFR measurements to a common using the relation:
where the coefficient is also derived from the multilinear regression (Table 1). By main sequence ‘slope’ we mean the coefficient of log( (or equivalent) in the fit, whereas the scatter refers to the rms of the difference between the individual measures of log(SFR) and that predicted by the multilinear fit of Eq. 2. We apply an iterative 3 clipping to remove strong outliers in the fit, which results in rejecting from to at most of the galaxies.
The mass-SFR correlation for our disk sample is found to have a slope of 0.74 and a scatter of 0.283 dex (Figure 1). This is just slightly shallower than reported by Elbaz et al. (2007) but steeper than that of Noeske et al. (2007) at similar redshifts, and comparable to the slope and scatter found by Rodighiero et al. (2011) for galaxies.
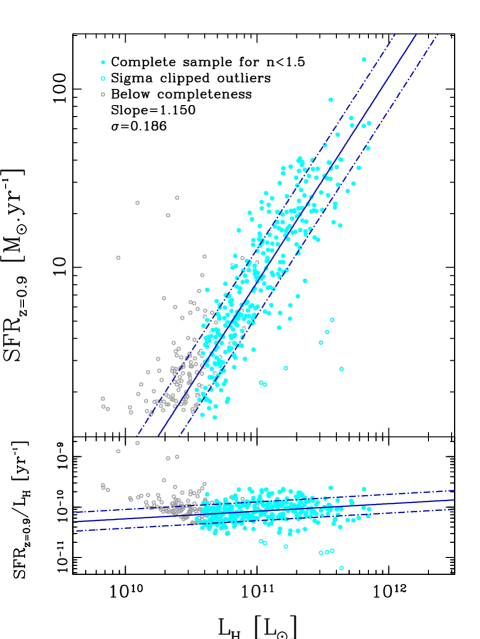
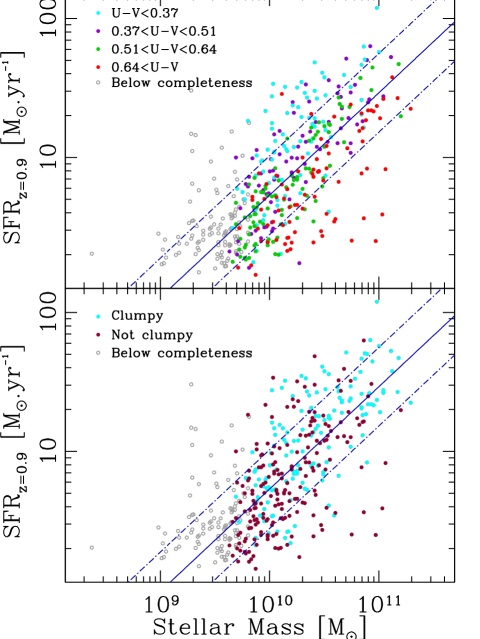
The rest-frame 1.6m luminosity () is sometimes used as a proxy for the stellar mass (e.g., Gavazzi, Pierini & Boselli 1996; Cowie & Barger 2008), so we also tried using this in the fitting. Remarkably, the SFR- relation is even tighter, with a scatter of only 0.186 dex (Table 1; Figure 2). The ratio is affected by the light from young stars, and hence it is somewhat affected by the SFR. However, is even more directly affected by star formation, and yet we find that the SFR- relation has a scatter of 0.40 dex. When using galaxy colors together with in the fit one obtains a relation with even smaller scatter (0.154 dex), hence colors seem to be the strongest factor affecting the mass-SFR sequence. Binning in colors produces roughly parallel sequences in the mass-SFR plane (Figure 3; top). The ratio is also strongly affected by color (e.g., Pannella et al. 2009b): redder galaxies have lower sSFR and higher , which helps reduce the scatter in the correlation compared to the SFR- relation. We thus introduce an ‘empirical mass’ by fitting the as a function of and color:
| (3) |
similar in concept to Eq. 6–7 of Daddi et al. (2004) for BzK galaxies and to Eq. 1 in Bell (2008) for local galaxies (but recall that here quantities are reddening corrected). The dispersion between and is only 0.20 dex. We find that the -SFR correlation has a scatter of 0.246 dex, slightly smaller than the scatter in -SFR (0.283 dex, Figure 1). A simple interpretation of this finding would be that, somewhat surprisingly, the ‘empirical mass’ is a more accurate stellar mass estimator by about 0.14 dex in relative terms (subtracting in quadrature), compared to using full SED fitting with a large number of galaxy population synthesis models. This would be possible if the large number of degrees of freedom (on star formation histories, etc) in the libraries of fitted templates acts to increase the uncertainties through the various degeneracies of actual galaxies, perhaps because actual galaxies have more homogeneous star formation histories than are permitted in the SED-fitting models, leading to a smaller range of ratios (at a given color) in the real world compared to the models, while the simple fit in Eq. 2 could be effectively equivalent to introducing priors in the SED-selection. Demonstrating this hypothesis would require extensive simulations that are beyond the scope of this work. We emphasize that Equation 2 has been empirically calibrated for our galaxy sample with an effective . It is not immediately obvious if the same relation could be applied at much lower or higher redshifts.
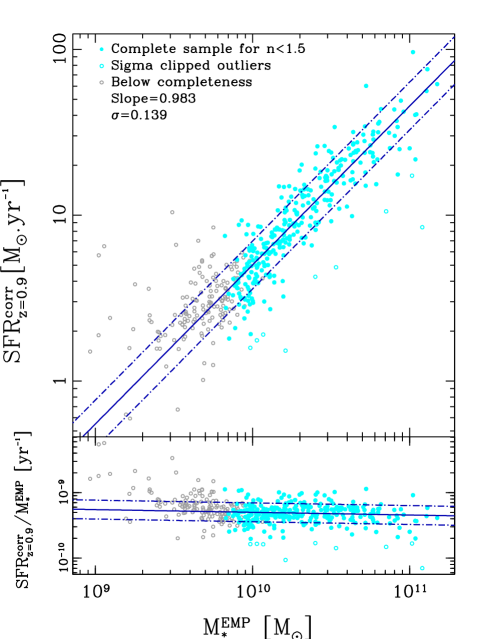
We also find that clumpiness correlates with the SFR residuals from the average relation: clumpy galaxies tend to have higher sSFRs (Figure 3-bottom; Table 1), an effect which is significant at (Table 1) when the regression includes together with reddening-corrected color. The latter fit has a scatter of 0.139 dex (Table 1; Figure 4) and a slope of 0.98, which is substantially steeper than the original fit. We also tried using and size but these parameters do not appear to have a measurable correlation with sSFR in our sample of disk galaxies.
4. Discussion
When color and clumpiness are included as fitting parameters together with stellar mass (Figure 4; Table 1), the resulting correlation ultimately reaches a scatter of about 0.14 dex, compared to 0.28 for the mass-SFR correlation (Figure 1). This implies that most ( dex) of the scatter in the original correlation is real, i.e., due to real variations of sSFR that can be traced to galaxy observables (namely, color and clumpiness). The combined effect of measurement errors on and SFR is thus at the level of dex, and likely smaller, as our two parameters and may not account for all of the physical variance. If the measurement errors in and SFR are similar, then each of these quantities is precise to better than 0.10 dex in relative terms, or about 25% in linear scale, which is quite amazing. It could be argued, however, that what we are comparing here is not a direct measurement of these quantities. For example, our SFR is derived from the total infrared luminosity , which in turn is inferred from 12m rest-frame luminosity (the UV contribution is generally negligible), hence our conclusions strictly apply to such an observable, and similar considerations could held for . In principle, the exact conversion between and the bolometric luminosity () could affect the slope that we infer for the mass-SFR relation, although our adopted value is perfectly consistent with all observables at (Elbaz et al. 2011). It could also be possible that this to conversion actually reduces the observed scatter, so that a smaller rms is found for the tracer (e.g. ) with respect to what it is designed to trace (e.g., SFR or ). This might be the case if the correlation between IR8 (=) and sSFR (Elbaz et al. 2011) were to hold also at 12m rest frame and inside the main sequence. On the other hand, for moderately star forming galaxies mid-IR might be better correlated to SFR than (see, e.g., Calzetti et al. 2007)
It is worth commenting on the reason for the dependence of sSFR on color and clumpiness. For the latter the interpretation appears to be quite straightforward given that a higher gas fraction is expected to be the reason for higher clumpiness (Bournaud, Elmegreen & Elmegreen 2007; Ceverino, Dekel & Bournaud 2010), and the higher gas fraction should directly imply higher SFRs (all other things being equal, hence higher sSFR). Higher sSFR obviously results in bluer colors, but age, metallicity, or extinction effects may also be at play. We explored if color differences could be connected to a metallicity dependence of the mass-SFR relation (Mannucci et al. 2010; Lara-Lopez et al. 2010). However, the effect of a metallicity-SFR relation should depend strongly on stellar mass, so it seems unlikely that it could produce the series of almost parallel sequences as a function of color seen in Figure 3. In addition, metallicity has a weak impact on optical colors of actively star-forming galaxies. Using synthetic galaxy spectra we find that higher metallicity actually can imply slightly bluer colors for young galaxies. We exclude the possibility that colors reflect, even in part, dust reddening, because the luminosities and colors used in this analysis have all been corrected for dust extinction (see Section 2). We also find that using A1500 as an extra parameter would further reduce the scatter to 0.125 dex. However, this may be due to the fact that A1500 is derived in part from the same infrared data used to determine the SFR.
We have demonstrated that a sizable fraction of the dispersion of the SFR- relation for main sequence galaxies in our sample can be traced to intrinsic differences in color and clumpiness at fixed mass, as SFR correlates with these quantities. While the existence of a main sequence of star-forming galaxies indicates that star formation proceeds in a quasi-steady fashion in most galaxies, it is quite natural to expect that the sSFR is also subject to up and down fluctuations, possibly responding to fluctuations in the gas accretion rate. On the other hand, the star formation process is intrinsically stocastic, as is the formation of clumps with enhanced SFR. In addition, some galaxies may sustain systematically lower or higher SFRs, over times comparable to the Hubble time, which would produce quite diverging mass growth histories over cosmological timescales (Renzini 2009). Addressing this question in detail is beyond the scope of this letter.
Finally, this work provides hints about the possible intrinsic slope of the mass-SFR correlation. Indeed, the slope on the stellar mass term rises from 0.74 to when including color and clumpiness or using the empirical mass in the fit (see Table 1). When the analysis is limited to sSFR ranges with high completeness, the average color of galaxies in our sample does not change with stellar mass, which disfavors the slope steepening being just the effect of spurious removal of mass-SFR trends. Instead, using color at least partially removes the bias due to the higher dynamic range in sSFR at higher masses, allowing to see galaxies with lower sSFR and redder colors. Also, fitting for color and clumpiness removes most of the (real) thickness of the mass-SFR relation, which can also artificially reduce the slope, as we are spanning only a relatively small range in both stellar mass and SFR, i.e., about 1.5 dex in this and in similar studies. The slope will also be biased by additional errors in the stellar mass, which is used here as the independent variable but is also affected by measurement errors. Therefore, our work suggests that the intrinsic slope of the mass-SFR correlation is probably closer to unity than is suggested by simple fits neglecting these biases.
We conclude by emphasizing that the H-band luminosity and the (reddening corrected) rest-frame color can be used to predict the 24m emission (a measure of dust and PAH luminosity) with better than a 40% accuracy, which is an impressive demonstration of the deep connection between the amount of stars already present (the stellar mass) and its time derivative (the star formation rate).
References
- (1) Alexander, D. M., et al. 2003, AJ, 126, 539
- (2) Bell E. F., 2008, ApJ, 682, 355
- (3) Bournaud F., Elmegreen B. G., Elmegreen D. M., 2007, ApJ, 670, 237
- (4) Bouwens R. J., et al., 2011, ApJ submitted arXiv:1109.0994
- (5) Brinchmann, J., Charlot, S., White, S. D. M., Tremonti, C., Kauffmann, G., Heckman, T., & Brinkmann, J. 2004, MNRAS, 351, 1151
- (6) Calzetti D., Armus L., Bohlin R. C., et al., 2000, ApJ, 533, 682
- (7) Calzetti D., et al., 2007, ApJ, 666, 870
- (8) Ceverino D., Dekel A., Bournaud F., 2010, MNRAS, 404, 2151
- (9) Chary, R., & Elbaz, D. 2001, ApJ, 556, 562
- (10) Conselice C. J., 2003, ApJS, 147, 1
- (11) Daddi, E., Cimatti, A., Renzini, A., Fontana, A., Mignoli, M., Pozzetti, L., Tozzi, P., & Zamorani, G. 2004, ApJ, 617, 746
- (12) Daddi, E., et al. 2007a, ApJ, 670, 156
- (13) Daddi, E., et al. 2009, ApJ, 694, 1517
- (14) Daddi, E., et al. 2010, ApJ, 713, 686
- (15) Daddi, E., et al. 2010, ApJ, 714, L118
- (16) Elbaz, D., et al. 2007, A&A, 468, 33
- (17) Elbaz D., et al., 2010, A&A, 518, L29
- (18) Elbaz, D., et al. 2011, arXiv:1105.2537
- (19) Elmegreen D. M., Elmegreen B. G., Sheets C. M., 2004, ApJ, 603, 74
- (20) Förster Schreiber, N.M., et al., 2009, ApJ 706, 1364
- (21) Genzel, R., et al. 2010, MNRAS, 407, 2091
- (22) Giavalisco M., Ferguson H.C., Koekemoer A., et al., 2004, ApJ. 600, L93
- (23) Gavazzi G., Pierini D., Boselli A., 1996, A&A, 312, 397
- (24) González, V., Labbé, I., Bouwens, R. J., Illingworth, G., Franx, M., Kriek, M., & Brammer, G. B. 2010, ApJ, 713, 115
- (25) Grazian A., Fontana A., de Santis C., et al., 2006, A&A, 449, 951
- (26) Karim, A., et al. 2011, ApJ, 730, 61
- (27) Lara-López M. A., et al., 2010, A&A, 521, L53
- (28) Le Borgne, D., & Rocca-Volmerange, B. 2002, A&A, 386, 446
- (29) Lee K.-S., et al., 2011, ApJ, 733, 99
- (30) Magdis, G. E., et al. 2010, ApJ, 720, L185
- (31) Magnelli B., Elbaz D., Chary R. R., Dickinson M., Le Borgne D., Frayer D. T., Willmer C. N. A., 2011, A&A, 528, A35
- (32) Mannucci F., Cresci G., Maiolino R., Marconi A., Gnerucci A., 2010, MNRAS, 408, 2115
- (33) Mullaney J. R., et al., 2012, MNRAS 419 95
- (34) Noeske, K. G., et al. 2007, ApJ, 660, L43
- (35) Pannella, M., et al. 2009a, ApJ, 698, L116
- (36) Pannella M., et al., 2009b, ApJ, 701, 787
- (37) Papovich C., Finkelstein S. L., Ferguson H. C., Lotz J. M., Giavalisco M., 2011, MNRAS, 412, 1123
- (38) Peng, C. Y., Ho, L. C., Impey, C. D., & Rix, H.-W. 2002, AJ, 124, 266
- (39) Peng Y.-j., et al., 2010, ApJ, 721, 193
- (40) Renzini, A. 2009, MNRAS, 398, L58
- (41) Rodighiero G., et al., 2011, ApJ, 739, L40
- (42) Stark, D. P., Ellis, R. S., Bunker, A., Bundy, K., Targett, T., Benson, A., & Lacy, M. 2009, ApJ, 697, 1493
- (43) Vega O., et al., 2010, ApJ, 721, 1090
- (44) Wuyts, S., et al. 2011, submitted to ApJ, arXiv:1107.0317