A Giant Metrewave Radio Telescope/Chandra view of IRAS 09104+4109: A type 2 QSO in a cooling flow
Abstract
IRAS 09104+4109 is a rare example of a dust enshrouded type 2 QSO in the centre of a cool–core galaxy cluster. Previous observations of this =0.44 system showed that as well as powering the hyper–luminous infrared emission of the cluster–central galaxy, the QSO is associated with a double–lobed radio source. However, the steep radio spectral index and misalignment between the jets and ionised optical emission suggested that the orientation of the QSO had recently changed. We use a combination of new, multi-band Giant Metrewave Radio Telescope observations and archival radio data to confirm that the jets are no longer powered by the QSO, and estimate their age to be 120-160 Myr. This is in agreement with the 70-200 Myr age previously estimated for star–formation in the galaxy. Previously unpublished Very Long Baseline Array data reveal a 200 pc scale double radio source in the galaxy core which is more closely aligned with the current QSO axis and may represent a more recent period of jet activity. These results suggest that the realignment of the QSO, the cessation of jet activity, and the onset of rapid star–formation may have been caused by a gas–rich galaxy merger. X–ray observations reveal a spiral structure in the ICM which suggests that the cluster is in the process of relaxation after a tidal encounter or merger with another system; such a merger could provide a mechanism for transporting a gas–rich galaxy into the cluster core without stripping its cold gas. A Chandra X–ray observation confirms the presence of cavities associated with the radio jets, and we estimate the energy required to inflate them to be 7.71060 erg. The mechanical power of the jets is sufficient to balance radiative cooling in the cluster, provided they are efficiently coupled to the intra–cluster medium (ICM). We find no evidence of direct radiative heating and conclude that the QSO either lacks the radiative luminosity to heat the ICM, or that it requires longer than 100-200 Myr to significantly impact its environment.
keywords:
galaxies: clusters: individual (CL 09104+4109) — galaxies: individual (IRAS 09104+4109) — galaxies: quasars: general — X–rays: galaxies: clusters — galaxies: active — cooling flows1 Introduction
It is now widely agreed that feedback from active galactic nuclei (AGN) is likely to be the dominant process governing star formation and gas cooling in systems ranging from large galaxies to the most massive galaxy clusters (McNamara & Nulsen, 2007; Peterson & Fabian, 2006). In the nearby Universe there is a wealth of evidence that radio galaxies in groups and clusters have an impact on the surrounding intra-cluster medium (ICM) by inflating cavities (e.g., Rafferty et al., 2006; Bîrzan et al., 2008; Dunn et al., 2010; O’Sullivan et al., 2011), driving shocks and sound waves (e.g., Nulsen et al., 2005; Fabian et al., 2006; Sanders & Fabian, 2007; Forman et al., 2007), and causing gas mixing (e.g., Fabian et al., 2005; Wise et al., 2007; Blanton et al., 2009; Simionescu et al., 2009; Kirkpatrick et al., 2011).
While a detailed, universally accepted description of the mechanisms underlying the origin and power of AGN jets remains elusive, the combination of the results from numerous analytic studies and increasingly sophisticated numerical simulation studies (e.g., Koide, 2003; Gammie et al., 2004; De Villiers et al., 2005; Hawley & Krolik, 2006; Komissarov, 2007; Punsly, 2007; Beckwith et al., 2008; McKinney & Blandford, 2009) do suggest an emerging consensus on a few key elements of the picture (c.f. Benson & Babul, 2009, for a more detailed overview):
First, jets are an ubiquitous feature of magnetized accretion flows onto black holes (De Villiers et al., 2005; Punsly, 2007; McKinney & Blandford, 2009). The jets may be highly relativistic, narrowly collimated and Poynting-flux dominated or broad, mildly relativistic and matter-dominated.
Second, the launching of powerful jets is most efficient when the accretion flow in the vicinity of the black hole has a large scale-height, as is the case when the flow is radiatively inefficient and advection-dominated (e.g., Meier, 2001; Churazov et al., 2005; Nemmen et al., 2007). Radiatively inefficient flows are believed to arise at low accretion rates (i.e ) (e.g., Narayan & Yi, 1994). Above this threshold accretion rate, the flow transitions to a radiatively efficient thin disk. There is a considerable body of work suggesting that the jet production is suppressed in thin disks (Livio et al., 1999; Meier, 2001; Maccarone et al., 2003). At very high accretion rates (i.e ), the nature of the flow and even its radiative properties are not well understood, though there are suggestions that as the flow becomes optically thick, the disk scale height increases and powerful jets may be launched.
Third, the outflows draw their energy from both the gravitational energy released by the accretion flow as well as the rotational energy of the black hole itself. This link between black hole spin and outflow power has long been indicated from theoretical considerations (c.f., Blandford & Znajek, 1977; Punsly & Coroniti, 1990; Meier, 1999, 2001) and in recent years, has received further support from numerical studies (c.f., Hawley & Krolik, 2006; Komissarov, 2007; Punsly, 2007; McKinney & Blandford, 2009). MHD simulations show that the magnetic fields anchored in the rotating accretion flow will give rise to both an outflow of material from the accretion flow and the surrounding corona, as well as a hydromagnetic jet that originates in the innermost regions of the accretion flow. Of these two components, the former is thought to dominate if the black hole is spinning slowly; the frame-dragging of the accretion flow within the ergosphere can greatly magnify the amplitude of the outflow (Meier, 1999, 2001; Nemmen et al., 2007; Benson & Babul, 2009). The power of the electromagnetic component rises very steeply at high black hole spins. When the accretion flow reaches the black hole event horizon, the gas is expected to drain off the field lines while the field lines, which for all intents and purposes can be thought of as being anchored on the black hole’s event horizon, establish a structure similar to that first described by Blandford & Znajek (1977). In the event that the black hole is spinning, the winding of the magnetic field lines in the ergosphere will drive helical twists that manifests as highly collimated, Poynting-flux dominated jets. In the picture outlined here, jets arise regardless of whether the black hole is spinning or not; however, a rapidly spinning black hole can greatly enhance the total outflow power.
However, it has been argued that the mechanical power of radio jets is unlikely to represent more than 10% of the total energy budget of all types of AGN (Cattaneo & Best, 2009). The remaining 90% is released radiatively, generally by AGN with little or no jet activity, but it is as yet unclear whether this radiation can effectively heat gas on galactic or cluster scales.
Current structure formation models suggest that feedback from black holes at redshifts 1 is required to establish the shallow gas entropy profiles in groups (e.g., McCarthy et al., 2011) and quench star formation in giant galaxies, so as to produce the distribution of luminosities and colours observed today (Bower et al., 2006; Croton et al., 2006). It is widely assumed that radiative “quasar–mode” feedback, which should dominate at this epoch, can effectively heat the ICM via a wind which blows any cool gas and dust out of the galaxy (e.g., Hopkins et al., 2005) and drives shocks into the ICM. However this is a largely untested hypothesis, since powerful quasars are rare at low–redshifts () where current instrumentation could resolve such winds, particularly in the dense cluster environments where their impact could be most easily studied. The handful of examples which have been examined using Chandra and XMM-Newton (e.g., Belsole et al., 2007; Siemiginowska et al., 2010; Russell et al., 2010; Russell et al., 2012) show no evidence of strong quasar–mode heating, but the difficulty of identifying disturbed structures or ascertaining the current accretion state means that the issue is as yet unresolved.
We have chosen to investigate this issue by examining IRAS 09104+4109 (also known as IRAS J0913454+405628) a quasar and FR-I radio galaxy located in the dominant galaxy of the =0.442 galaxy cluster CL 09104+4109 (also known as MACS J0913.7+4056 and hereafter referred to as CL09). In this paper we combine new multi-frequency Giant Metrewave Radio Telescope (GMRT) and archival Very Large Array (VLA) and Very Long Baseline Array (VLBA) observations with a reanalysis of the Chandra and XMM-Newton data, to examine in detail the interaction between the AGN, radio jets and ICM in CL09. Section 1.1 describes our current knowledge of the cluster and AGN, based on previous multiwavelength studies in the literature. In Sections 2 and 3 we describe the radio and X–ray observations, and their reduction. The resulting radio images are shown in Section 4, and X-ray imaging and spectroscopic analysis is described in Section 5. Section 6 describes the spectral analysis of the radio source and presents limits on its age and physical properties. In Section 7 we summarise our observational results, examine the impact of the radio source on the ICM, and consider the origin of various structures in the cluster. In Section 8 we discuss the likely history of the cluster, BCG and AGN, and the ability of the QSO to balance radiative cooling in the ICM. Our conclusions are summarised in Section 9.
Throughout the paper we assume a flat cosmology with H0 = 73 km s-1 Mpc-1, = 0.73 and = 0.27. For the redshift of CL09 (, Sloan Digital Sky Survey Data Release 3), this gives a luminosity distance 2372 Mpc, an angular diameter distance 1140 Mpc, and angular scale of 1′′=5.5 kpc. We assume a galactic hydrogen column of , taken from the Leiden/Argentine/Bonn Galactic Hi Survey (Kalberla et al., 2005).
1.1 Summary of previous studies
IRAS 09104+4109 is a hyper-luminous infrared galaxy (HLIRG, Sanders & Mirabel, 1996), having an infrared luminosity 1046 (1013, Kleinmann et al., 1988). The flux density of the galaxy peaks at 50 m and spectral energy distribution (SED) modelling suggests that 70% of the emission between UV and Sub-mm is produced by a dust–shrouded active nucleus (Ruiz et al., 2010) with a total bolometric luminosity (Vignali et al., 2011). The AGN is thus classed as a type II QSO, with dust reprocessing almost all its optical and ultraviolet emission into the infrared (Kleinmann et al., 1988; Vignali et al., 2011; Ruiz et al., 2010).
The remaining 30% of the emission from the galaxy arises from star–formation (Vignali et al., 2011; Ruiz et al., 2010). The galaxy colour profile becomes significantly bluer within 20 kpc of the centre, and the star–formation rate (SFR) based on the equivalent width of [Oii] is 4112 (Bildfell et al., 2008). Modelling of optical and near-ultraviolet (NUV) photometry suggests that recent star formation with a probable age of 70-200 Myr has contributed a small but significant fraction of the stellar mass in the brightest cluster galaxy (BCG, probably 5% Pipino et al., 2009).
Although the QSO is obscured, the BCG contains relatively little dust, 5107 (Combes et al., 2011), with a mean temperature 120 K (Kleinmann et al., 1988). Based on a detection of CO emission Combes et al. (2011) estimate that the BCG contains only 3.2109 of molecular hydrogen, significantly less than many star–formation dominated ULIRGs (see also Evans et al., 1998). It is possible that the star–formation and QSO have consumed or evaporated much of the cool material in the system, or that the winds from the QSO have swept the BCG clean.
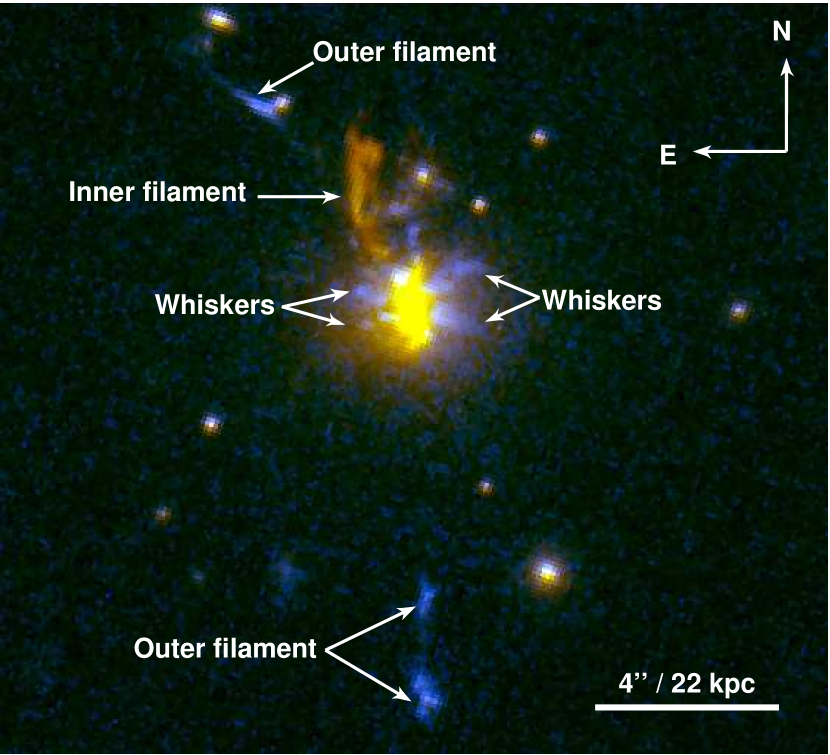
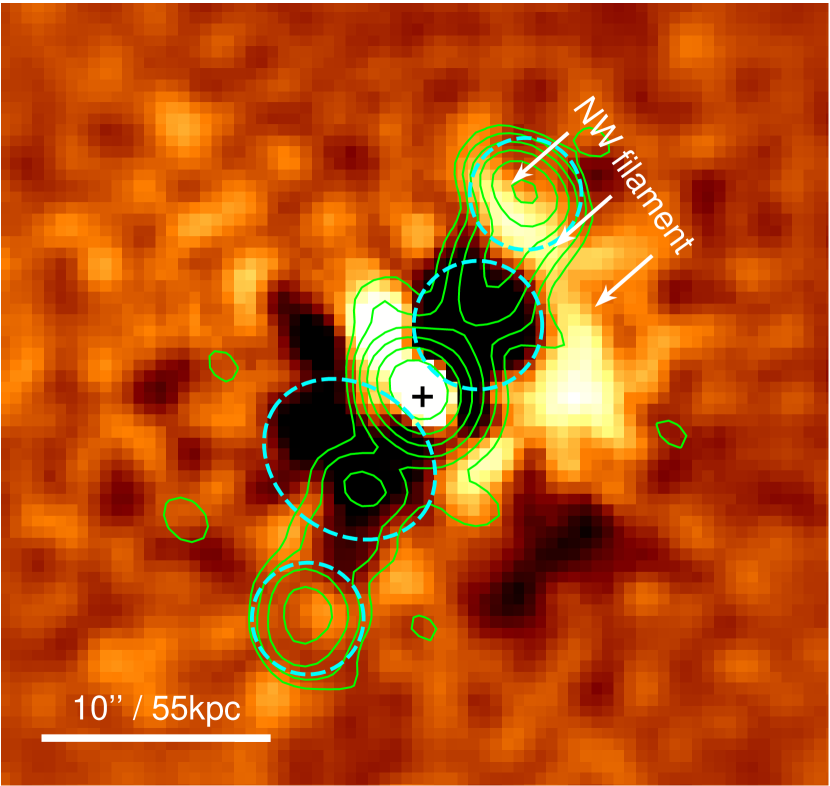
Ground-based spectrophotometry shows a “plume” of [Oiii] emission extending 5′′ (27 kpc) north of the galaxy, with a velocity only 100 different from that of the nucleus (Crawford & Vanderriest, 1996). Hubble Space Telescope (HST) imaging shows this to be an extended cool gaseous filament (Armus et al., 1999, labelled “inner filament” in Fig. 1) illuminated by spectrally hard photons from the AGN (Crawford & Vanderriest, 1996), while ground–based spectroscopy suggests that it contains dust (Tran et al., 2000). Other filamentary structures around the BCG include apparent gaseous filaments north and south of the BCG at radii of 5-9′′ (27-50 kpc, labelled “outer filaments”) and smaller–scale “whiskers” extending 5-7 kpc from the BCG on roughly east-west axes (Armus et al., 1999, see Fig. 1). These filaments have significantly bluer colours than the [Oiii] plume, but their origin is unclear. Possibilities include material stripped from cluster galaxies, gas cooling from the hot ICM, or material illuminated by the AGN through openings in the dust shrouding the BCG.
On arcsecond scales HST imaging shows highly polarized emission north and south of the AGN, with a polarization angle roughly perpendicular to its extension. These structures are thought to be the optical/UV scattering cones of the AGN (Hines et al., 1999). Ground–based polarimetry also shows the [Oiii] filament to be highly polarized (Tran et al., 2000). Attempts to determine the true opening angle of the cones and their inclination to the line of sight result in a range of solutions (half-opening angles 15∘-40∘and inclinations 34∘-50∘ Tran et al., 2000; Hines et al., 1999), but the projected half-opening angle measured from the HST images is 35∘10∘ (Hines et al., 1999).
Hines & Wills (1993), using VLA 1.4 and 5 GHz observations, found that IRAS 09104+4109 also hosts a double-lobed radio source (NVSS J091345+405630) with straight jets extending 60 kpc northwest and southeast of the nucleus, whose radio luminosity places it in the FR I- FR II transition region. Its spectral index111The radio spectral index is defined according to , where is the flux density at the frequency . is , fairly steep for a radio galaxy . The jet axis lies just outside the ionisation cones of the AGN, and it has been suggested that this misalignment, along with the brightness of the radio core (unresolved in 6cm and 20cm VLA observations) may indicate that AGN has recently changed orientation, with a new jet aligned close to the line of sight producing the bright core via relativistic beaming (Hines & Wills, 1993; Hines et al., 1999; Armus et al., 1999).
ROSAT HRI observations of the CL09 cluster showed extended X-ray emission centred on the BCG, with a central hole 4′′ (20 kpc) across (Fabian & Crawford, 1995). ROSAT imaging and ASCA spectral analysis both indicate the presence of a strong cooling flow in the cluster core (Fabian & Crawford, 1995; Crawford & Vanderriest, 1996). More recent Chandra observations have confirmed the presence of a strong cool core with a short cooling time (2.1 Gyr within 50 kpc) and shown that the hole is one of two cavities located northwest and southeast of the core along the jet axis (Hlavacek-Larrondo et al., 2011; Iwasawa et al., 2001). The enthalpy of these cavities is more than sufficient to balance radiative losses within the cooling region (Hlavacek-Larrondo et al., 2011, hereafter HL11).
2 Radio Observations and Data Reduction
2.1 GMRT Observations
CL09 was observed using the GMRT at 240 MHz, 330 MHz, 610 MHz (project 15SRC01) and 1.28 GHz (project 17-050) in a full-synthesis run of approximately 11 hours at 1.28 GHz and 9 hours at each of the other frequencies (including calibration overheads). Details on these observations are summarised in Table 1, which reports: observing date, frequency and total bandwidth, total time on source, full-width half maximum (FWHM) and position angle (PA) of the full array, and rms level (1) at full resolution.
The 330 MHz and 1.28 GHz data were recorded using the upper and lower side bands (USB and LSB, respectively) simultaneously, which provide a total observing bandwidth of 32 MHz. The 240 MHz and 610 MHz observations were carried out in simultaneous mode with 32 MHz bandwidth (USB+LSB) at 610 MHz and 8 MHz at 240 MHz. The data were collected using the default spectral-line mode with 128 channels for each band, resulting in a spectral resolution of 125 kHz per channel. The data sets were calibrated and reduced using the NRAO222National Radio Astronomy Observatory. Astronomical Image Processing System (AIPS) package. The data were initially inspected using the task SPFLG to identify and remove bad channels and visibilities affected by radio frequency interference (RFI). The data were then calibrated. The flux density scale was set using amplitude calibrators (3C48, 3C147 and 3C286), observed at the beginning and at the end of the observing run, and the Perley & Taylor (1999) extension of the (Baars et al., 1977) scale. The source 0834+555 was used as phase calibrator at all frequencies.
The bandpass calibration was carried out using the flux density calibrators. A central channel free of RFI was used to normalise the bandpass for each antenna. After bandpass calibration, the central 84 (48) channels were averaged to 6 channels of 2 MHz (1 MHz) at 330 MHz, 610 MHz and 1.28 GHz (240 MHz) to reduce the size of the data set and, at the same time, to minimise the bandwidth smearing effects within the primary beam of the GMRT antenna.
After further careful editing of the in the averaged data, a number of phase-only self-calibration cycles and imaging were carried out for each data set. The large field of view of the GMRT required the implementation of wide-field imaging technique in each step of the data reduction, to account for the non-planar nature of the sky. The USB and LSB were calibrated separately. The final data sets were further averaged from 6 channels to 1 single channel333Bandwidth smearing is relevant only at the outskirts of the wide field, and does not significantly affect the region presented and analysed in this paper., and then combined together to produce the final images. These were corrected for primary beam pattern of the GMRT antenna using PBCOR in AIPS. The rms noise level (1) achieved in the final full resolution images are summarised in Table 1.
The average residual amplitude errors on each individual antenna are 5% at 610 MHz and 1.28 GHz and 8% at 240 MHz and 330 MHz (e.g., Chandra et al., 2004). Therefore, we can conservatively assume that the absolute flux density calibration is within 5 at 610 MHz and 1.28 GHz and 8% at lower frequency.
| Observation | Frequency | Bandwidth | Integration | FWHM, PA | rms |
|---|---|---|---|---|---|
| date | (MHz) | (MHz) | time (min) | (full array, , ∘) | (mJy beam-1) |
| Dec 2008 | 240 a | 8 | 390 | , | 1.3 |
| Mar 2009 | 327 | 32 | 280 | , 17 | 0.20 |
| Dec 2008 | 610 a | 32 | 390 | , | 0.08 |
| Dec 2009 | 1280 | 32 | 390 | 2.82.1, 53 | 0.02 |
Notes to Table 1 – Observed in dual 240/610 MHz mode.
| Project | Array | Observation | Frequency | Bandwidth | Integration | FWHM, PA | rms |
|---|---|---|---|---|---|---|---|
| date | (GHz) | (IF1/IF2, MHz) | time (min) | (full array, , ∘) | (Jy b-1) | ||
| AH406 | AnB | Jul 1990 | 8.41/8.46 | 50 | 40 | 0.90.7, 72 | 20 |
| AT211 | A | Apr 1998 | 1.47/1.67 | 25 | 110 | 1.31.1, | 25 |
| AT211 | B | Aug 1998 | 1.47/1.67 | 25 | 40 | 4.64.1, | 40 |
| AT211 | A | Apr 1998 | 4.64/4.89 | 50 | 30 | 0.40.4, | 50 |
| AT211 | B | Aug 1998 | 4.64/4.89 | 50 | 90 | 1.41.4, | 25 |
| AT211 | C | Apr 1998 | 4.64/4.89 | 50 | 45 | 7.24.1, | 40 |
2.2 VLA Archive Data
We extracted all observations of CL09 useful for the analysis presented in this paper from the VLA public archive and re-analysed them. The observing details are provided in Table 2, which shows the project code and array configuration in the first two columns; the other columns provide the same information as Table 1.
Calibration and imaging were carried out using AIPS, following the standard procedure, i.e., Fourier-Transform, Clean and Restore. We applied phase-only self-calibration to remove residual phase variations and improve the quality of the images. Correction for the primary beam attenuation was applied to the final images using the task PBCOR in AIPS. All flux densities are on the Perley & Taylor (1999) extension of the Baars et al. (1977) scale. Average residual amplitude errors are % at all frequencies.
2.3 VLBA Archive Data
CL09 was observed at 1.4 GHz by the VLBA on 2003 March 13 (project BH0110) for approximately 12 hours in phase referencing, with a recording bandwidth of 8 MHz. We extracted the calibrated data from the VLBA archive, processed with the VLBA data calibration pipeline (Sjouwerman et al., 2005) implemented in AIPS. The data set was further self-calibrated in phase with the AIPS task CALIB to reduce phase fluctuations, and used to produce the final image with a resolution of 8.3 mas 6.3 mas. The rms noise level measured on the image plane is 25 Jy beam-1.
3 X-ray Observations and Data Reduction
CL09 was observed during Chandra cycle 10, on 2009 January 06 for 77 ks (ObsID 10445), with the ACIS-I instrument operating in very faint telemetry mode. A summary of the Chandra mission and instrumentation can be found in Weisskopf et al. (2002). The data were reduced and analysed using ciao 4.3 and CALDB 4.4.3 following techniques similar to those described in O’Sullivan et al. (2007) and the Chandra analysis threads444http://asc.harvard.edu/ciao/threads/index.html. The observation did not suffer from significant background flaring, and the final cleaned exposure time was 73.3 ks.
Point sources were identified using the wavdetect task, with a detection threshold of 2.3810-7, chosen to ensure that the task detects 1 false source in the ACIS-I field, working from a 0.3-7.0 keV image and exposure map. All point sources were excluded, except in some cases the source corresponding to the cluster–central AGN. Spectra were extracted using the specextract task. Spectral fitting was performed in XSpec 12.7.0e. Abundances were measured relative to the abundance ratios of Grevesse & Sauval (1998). A galactic hydrogen column of 0.018 and a redshift of 0.44 were assumed in all fits. Spectra were grouped to 20 counts per bin, and counts at energies outside the range 0.5-7.0 keV were generally ignored during fitting.
Background spectra were drawn from the standard set of CTI-corrected ACIS blank sky background events files in the Chandra CALDB. The exposure time of each background events file was altered to produce the same 9.5-12.0 keV count rate as that in the target observation. Very faint mode background screening was applied to both source and background data sets.
XMM-Newton has also observed CL09, for 14 ks (ObsId 0147671001). This observation is described in detail in Piconcelli et al. (2007) and a detailed summary of the XMM-Newton mission and instrumentation can be found in Jansen et al. (2001, and references therein). To provide a comparison with Chandra image analysis, we reduced this data using sas v11.0.1 following the methods described in O’Sullivan et al. (2011). The EPIC instruments were operated in full frame mode, with the medium optical blocking filter. Periods including background flaring, when the total count rate deviated from the mean by more than 3, were excluded, leaving useful exposures of 12.0 ks (MOS1), 12.3 ks (MOS2) and 8.4 ks (pn). Point sources were identified using edetectchain, and regions corresponding to the 85 per cent encircled energy radius of each source (except that at the peak of the diffuse emission) were excluded.
4 Radio analysis
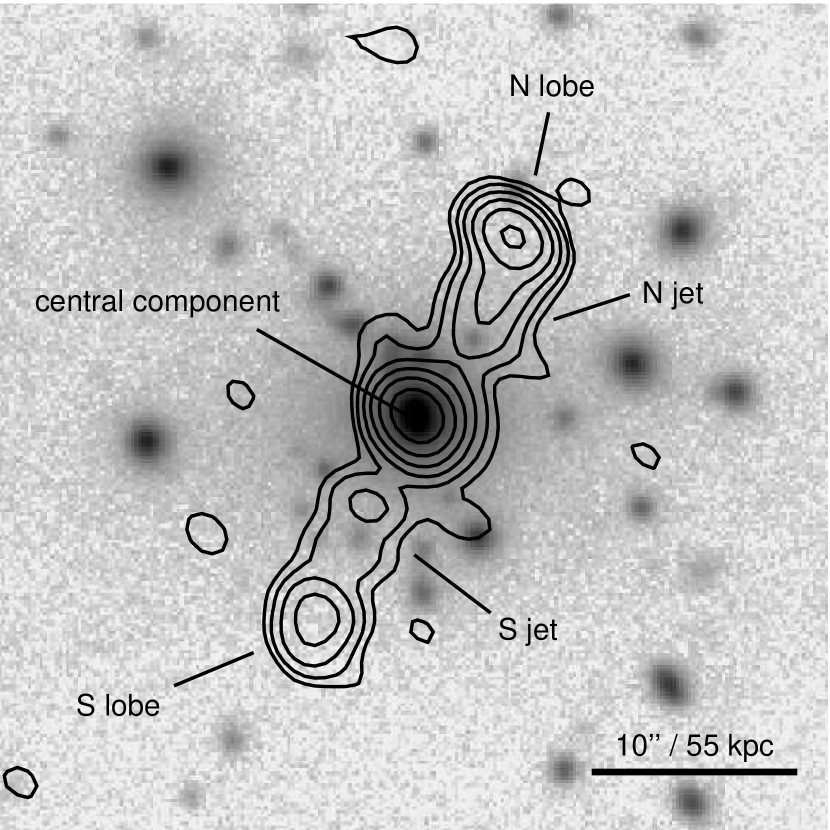
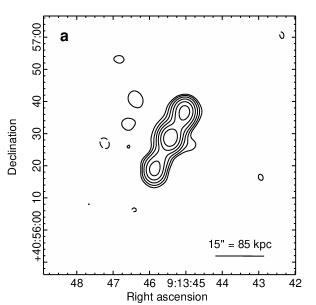
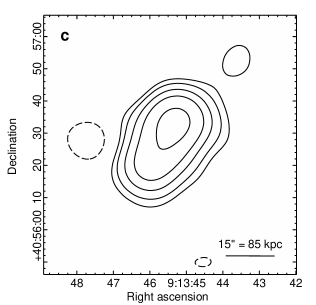
The 1.28 GHz GMRT image at the resolution of is presented in Fig. 2, as contours overlaid on the r’–band optical image from the Canada–France–Hawaii Telescope (CFHT). The image shows a double-lobe radio source with two fairly straight and weak jets and a dominant, compact component at the location of the cD galaxy. Fig. 3 presents the GMRT images at 610 MHz, 330 MHz and 240 MHz. While the source is resolved into a triple at the 5′′-resolution of the 610 MHz image, it is not spatially resolved in the images at 330 MHz and 240 MHz (FWHM11′′ and 14′′, respectively). The source has an angular size of , corresponding to a linear size of 150 kpc, fairly consistent at all frequencies and resolutions.
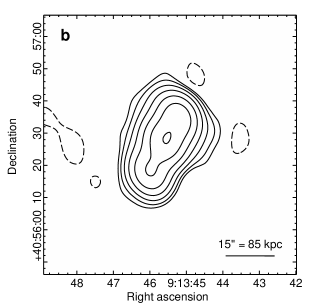
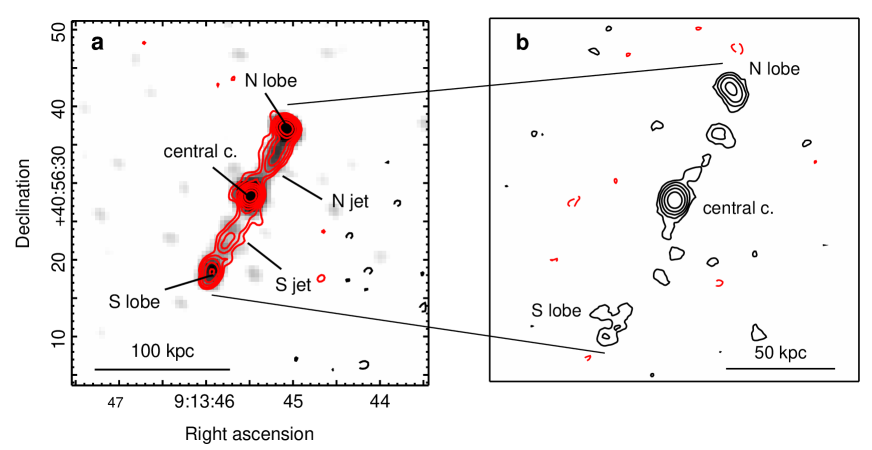
Fig. 4a shows the VLA image at 1.5 GHz, obtained from the combination of the A- and B-array data sets (Table 2; see also Hines & Wills, 1993). The source morphology in this image is very similar to Fig. 2. The combined A+B-array contour image at 4.8 GHz is presented in Fig. 4b. Here, the brightest features are the central component and northern lobe; the S lobe is very faint and jets are barely visible. The central component and N lobe are also detected in the -resolution image at 8.4 GHz (not shown here; Table 2).
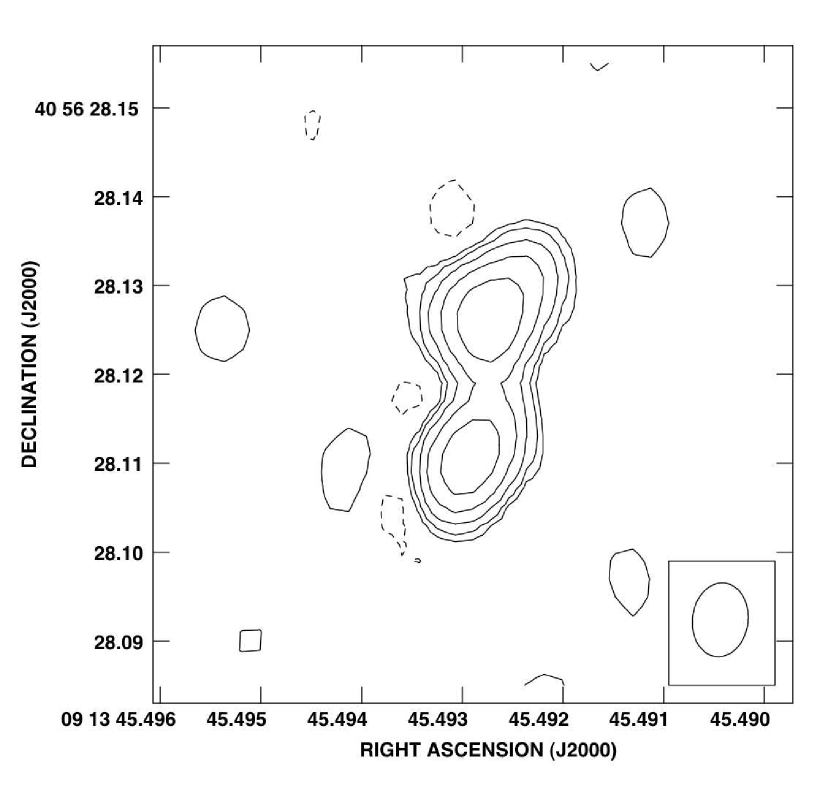
Fig. 5 zooms on the central region of CL09, by presenting the VLBA image at 1.4 GHz. At VLBA resolution ( mas), the central component is resolved into a quite symmetric double of 35 mas size (i.e., 0.2 kpc). No clear core component is visible. The double accounts for a total flux density of 5.7 mJy, which is in agreement with 5.90.3 mJy measured for the central component in the VLA image at 1′′-resolution (Table 2). This implies that no further, extended structure is present in the central region in addition to the VLBA double.
The radio flux densities of CL09, obtained from the GMRT and VLA images presented above, are summarised in Table 3, along with the associated uncertainties. The flux density at 4.8 GHz was measured on the C-array image (not shown here; see Table 2). At 8.4 GHz we measured a lower limit on the flux, since only the central component and N lobe were detected. Inspection of the VLSS image at 74 MHz suggests the presence of a weak, unresolved source at the position of CL09. The source is not listed in the VLSS catalogue, implying that its flux density at 74 MHz is less then the local rms level of the survey (1=100 mJy/beam, with FWHM= 80′′80′′). We therefore assume an upper limit of 500 mJy for the flux density of CL09 at 74 MHz, also reported in Table 3. We also include two values from the literature; the 151 MHz measurement from the 7C survey (Riley et al., 1999), corrected to our adopted flux scale (Helmboldt et al., 2008), and a 15 GHz measurement made using the Arcminute Microkelvin Imager (Hlavacek-Larrondo et al., 2011). The 1.5 GHz radio power of the source, 1.11025 W Hz-1 is consistent with the transition between FR I and FR II sources (Bridle & Perley, 1984; Owen & Laing, 1989; Owen & White, 1991) as is often the case with optically luminous cluster and group–central radio galaxies.
| Frequency, | (mJy) |
|---|---|
| 74 MHz | 500a |
| 151 MHz | 2519b |
| 240 MHz | 154.014 |
| 327 MHz | 99.78.0 |
| 610 MHz | 42.62.1 |
| 1.28 GHz | 17.60.9 |
| 1.5 GHz | 14.50.7 |
| 4.8 GHz | 3.50.2c |
| 8.4 GHz | 1d |
| 15 GHz | 0.800.04e |
| 1.250.01 |
Notes to Table 3 – 5 upper limit from the VLSS; from the 7C survey (Riley et al., 1999), converted to our adopted flux density scale using the conversion factor listed by Helmboldt et al. (2008); measured on the C-array image; lower limit since only the core and N lobe are detected in the 8.4 GHz image; Arcminute Microkelvin Imager measurement reported by Hlavacek-Larrondo et al. (2011).
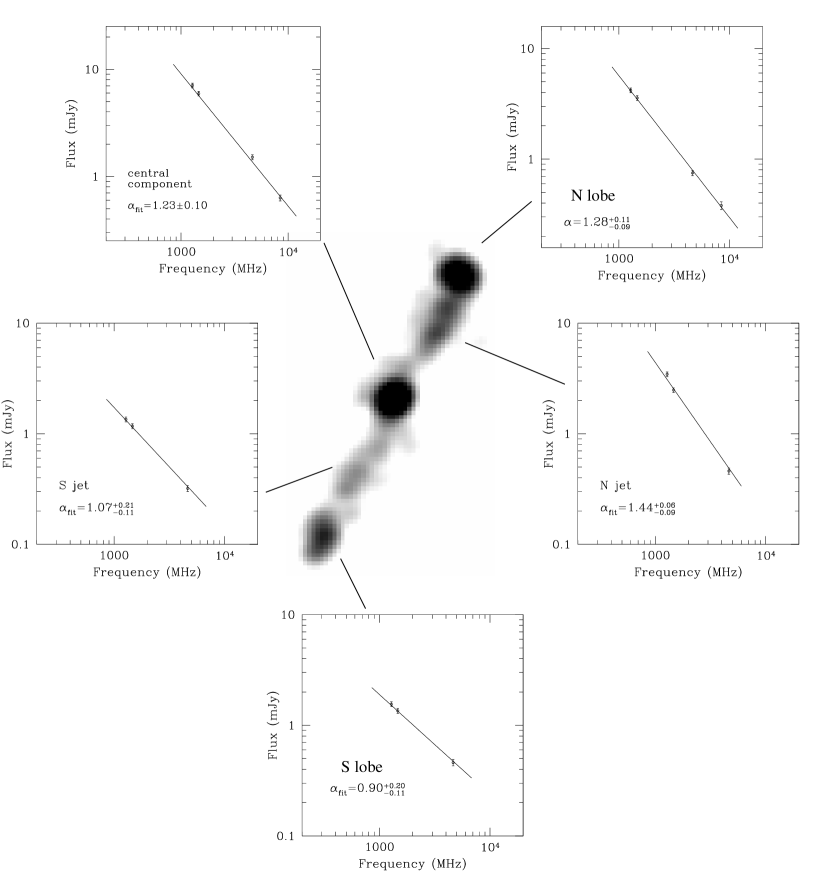
| Component | ||||||
|---|---|---|---|---|---|---|
| (mJy) | (mJy) | (mJy) | (mJy) | |||
| Central component | 7.060.35 | 5.930.30 | 1.510.08 | 0.630.04 | 1.280.04 | 1.230.10 |
| N lobe | 4.190.21 | 3.570.18 | 0.750.04 | 0.380.03 | 1.270.05 | 1.28 |
| S lobe | 1.550.08 | 1.350.07 | 0.460.03 | 0.940.06 | 0.90 | |
| N jet | 3.450.22 | 2.480.18 | 0.460.03 | 1.560.06 | 1.44 | |
| S jet | 1.350.07 | 1.170.06 | 0.320.02 | 1.120.06 | 1.07 |
5 X-ray analysis
5.1 X-ray images
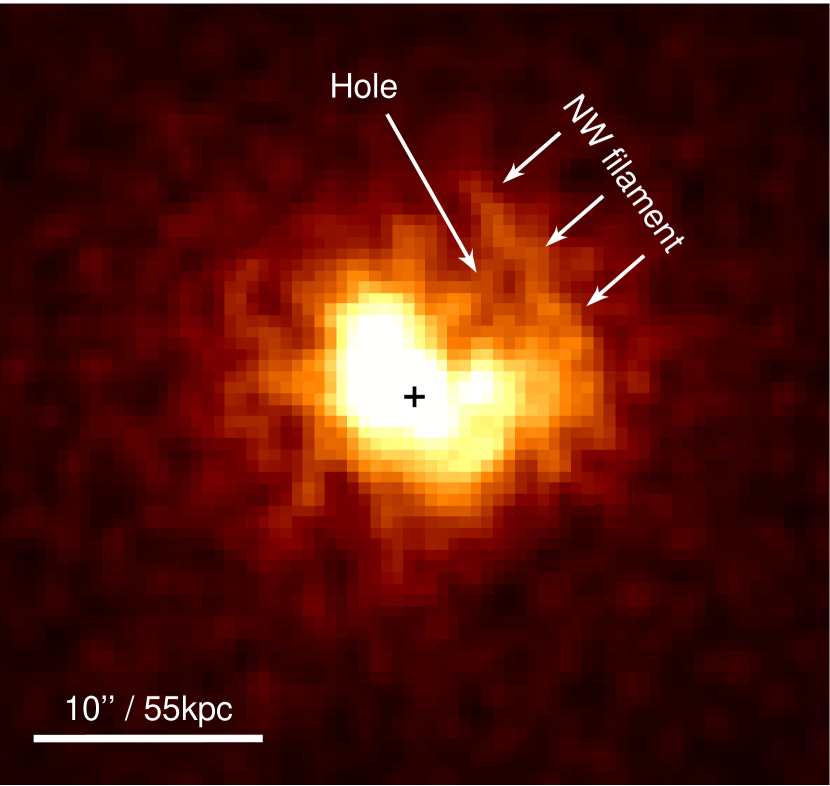
We initially examined the structure of the ICM using the exposure corrected 0.3-3 keV image of CL09 shown in Fig. 6. As noted by Iwasawa et al. (2001), the ICM emission is brightest to the northeast, west and southwest of the core, with a depression to the northwest. This hole was first observed in ROSAT HRI data (Fabian & Crawford, 1995; Crawford & Vanderriest, 1996). The hole is bounded on its northwest side by a linear filamentary structure. To determine the significance of the filament, we placed 1.5′′7′′ box regions on the filament and immediately to either side, and determined the number of counts in each region. The exposure corrected 0.3-3 keV surface brightness of the filament is 2 greater than the region inside (in the hole) and 3.6 greater than the surface brightness immediately outside.
As well as the northwest hole, HL11 identify a second cavity to the southeast. To provide a clearer view of the structures in the ICM, we modelled the surface brightness distribution of the cluster in the ciao sherpa package using an elliptical -model, with an additional constant component to represent the background. A monoenergetic exposure map with energy 1.39 keV (chosen to match the mean photon energy of the 0.3-3 keV image) was used to correct for exposure variations across the source. The effect of the PSF is probably minimal and was therefore neglected. The best fitting model had core radius 4.42′′0.11 (24.30.6 kpc), =0.5780.004, ellipticity 0.1360.010, and position angle 9.3∘2.2, indicating that the major axis of the ICM runs almost east-west. All parameters of the -model were allowed to vary freely in the fit, including the central position. Inclusion of a second -model had no significant effect on the model parameters, the second component primarily modelling emission in the core of the BCG.
Fig. 7 shows the residual image created by subtracting the best-fitting model from the 0.3-3 keV image, smoothed with a 2′′-width Gaussian to bring out small-scale features. A central bright source is visible coincident with the BCG core and inner component of the radio source. There is a bright extension out to 5.5′′ northeast, almost perpendicular to the radio jet axis, which is correlated with the brightest of the gaseous filaments north of the BCG and with a small spur of 1.28 GHz radio emission (see Fig. 8). However the strongest features are two dark regions of negative residuals to northwest and southeast, roughly coincident with the jet axis, but not extending as far as the radio lobes. These are the cavities, where thermal ICM plasma has presumably been driven out by the relativistic plasma of the radio jets, leaving a deficit in X-ray emission. The northwestern cavity corresponds to the hole seen in the raw image, and has bright residuals extending around its western and northern sides, including the northwest filament. These bright features may arise from ICM gas pushed out of the cavity. The southeast cavity is less well-correlated with the jet structure, extending to the east beyond the radio emission. There is also a weak negative residual to the southwest of the central component, which is uncorrelated with the jet. Our estimates of cavity size and position differ somewhat from those of HL11. We discuss these differences (and the physical properties of the cavities) in Section 7.3.
Heavier smoothing reveals residual features on larger scales. Fig. 9 shows the same Chandra 0.3-3 keV image smoothed with a 6′′Gaussian. The northwest cavity, surrounded by brighter emission, is still visible as a dark hole in the image centre. However, the heavier smoothing brings out negative residuals running from the north around the west side of the core and connecting to the west side of the southwest cavity. The weak negative residuals seen in Fig. 7 southwest of the core and extending east of the southeast cavity are thus likely to be part of a larger structure, rather than cavities. The positive residual to the northeast of the core is also found to extend further, curving around the eastern and southern side of the core.
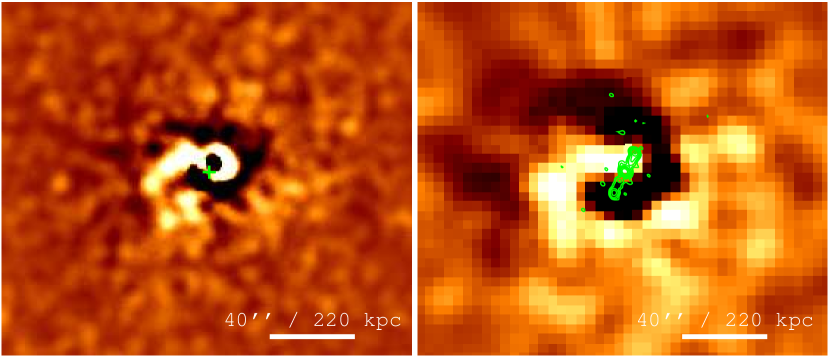
To check the robustness of the features revealed by the surface brightness modelling, we performed a separate fit to a 0.5-3 keV XMM-Newton image (Fig. 9). The northwest cavity is not resolved, as its 4′′ radius is smaller than the XMM point-spread function. However, the spiral structures seen in the Chandra image are clear, and can be traced in both positive and negative residuals curving out from the core to 300 kpc.
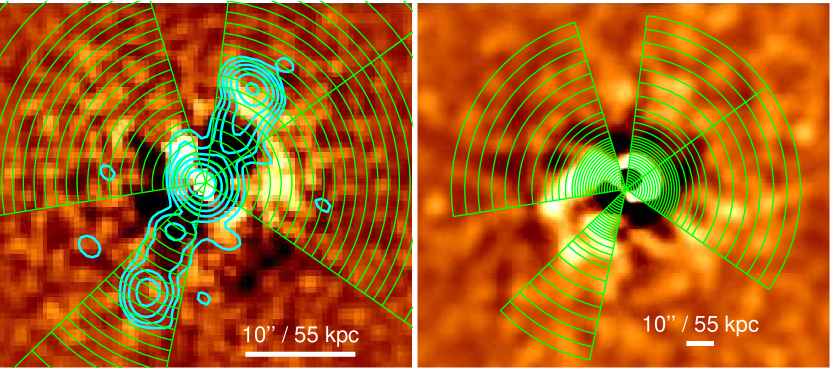
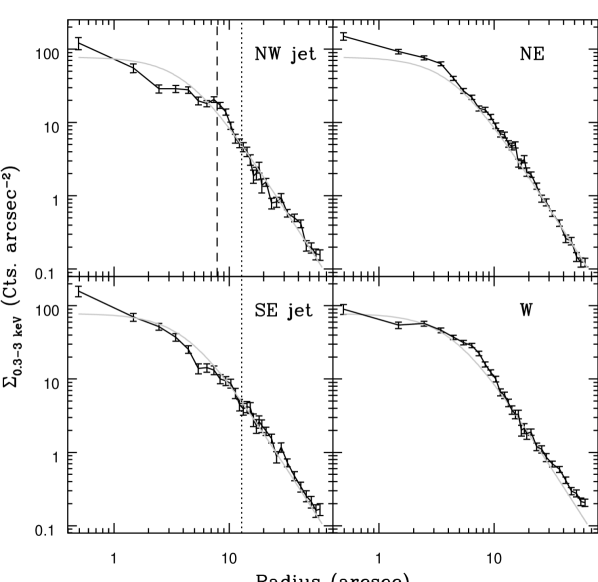
Measuring the significance of the cavities and spiral structure is difficult, since they affect the ICM as far as it can be clearly traced in the images. We therefore compare radial profiles across the features with the best-fitting surface brightness model. Fig. 10 shows profiles in four directions, two along the radio jets, and two roughly perpendicular to them. Surface brightness deficits are visible at radii of 2-6′′ along the northwest jet (the hole) and 5-7′′ along the southeast jet. In individual bins, the deficits are significant at the 4-5 level. The northwest filament is visible as a surface brightness excess at 7-10′′ radius. Neither profile shows a significant deficit at the position of the radio lobes. A significant excess is seen at radii 5′′ in the northeast profile, corresponding to the residual emission extending in this direction from the core. The western profile has an excess at 5-10′′, agrees with the average surface brightness profile at 10-20′′, and rises above it at larger radii. This corresponds to the residual features observed; first a surface brightness excess on the west side of the northwest cavity, then the region of low relative surface brightness which forms part of the negative residual spiral in Fig. 9. These results confirm that the cavities and associated small-scale structures are both real and significant, and provide some support for the spiral features observed in the residual maps.
5.2 Gas properties
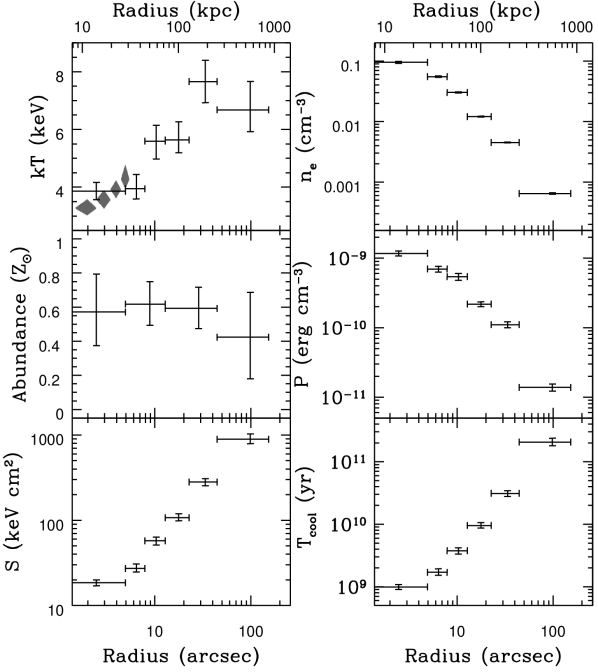
To determine the physical properties of the ICM, we extracted spectra in radial bins with widths chosen to ensure at least 3000 net source counts per annulus. A central 1′′ radius region was excluded to remove emission from the AGN. The spectra were fitted with an absorbed APEC thermal plasma model (Smith et al., 2001), using the XSpec projct model to account for the effects of projection. Abundances were tied between some bins to reduce uncertainties and the typical value was found to be 0.6, declining outside 40′′ (220 kpc). Fig. 11 shows radial profiles of the various gas parameters derived from the fit. Our temperature, electron density and entropy profiles are in good agreement with those of HL11. We are able to trace the ICM to 150′′ (850 kpc) within which the cluster has a bolometric X-ray luminosity 2. The radio jets extend to 14′′ (77 kpc), corresponding roughly to the outer radius of the third annulus. The luminosity within this radius is 8.5. The peak temperature is 7.7 keV, falling to 3.90.3 keV in the central 5′′ (28 kpc), where the cooling time is 1 Gyr.
To check for any indication of strong heating or cooling in the central region, we also fit projected APEC models to spectra extracted from four 1′′-wide radial bins, starting at 1.5′′. We find a close agreement between the projected and deprojected core temperatures, with no indication of a change in temperature gradient from that observed in the deprojected profile. In general the temperature profile shows that the heating the AGN has delivered (either radiatively or mechanically via the jets) has been insufficient to disrupt or destroy the strong cool core of the cluster.
We cannot accurately estimate the rate at which gas is cooling out of the ICM, since the XMM RGS data are not deep enough to allow high-resolution spectral modelling. We can estimate mass deposition rates based on the Chandra ACIS spectra, but these are very likely to be overestimated (since the calculation neglects heating and other important physical effects) and should be considered upper limits. Replacing the single temperature APEC model for the central bin in the deprojection analysis with a cooling flow model (MKCFLOW, Mushotzky & Szymkowiak, 1988) we find a mass deposition rate =319 within 27 kpc. However, the fit is not a significant improvement over the APEC model and has an unrealistic maximum temperature (11 keV). Alternatively, we can estimate the isobaric cooling rate:
| (1) |
where is the mean molecular weight (0.593), is the proton mass, is the bolometric X-ray luminosity of the central spectral bin, and the corresponding temperature. This gives an estimate of 235.
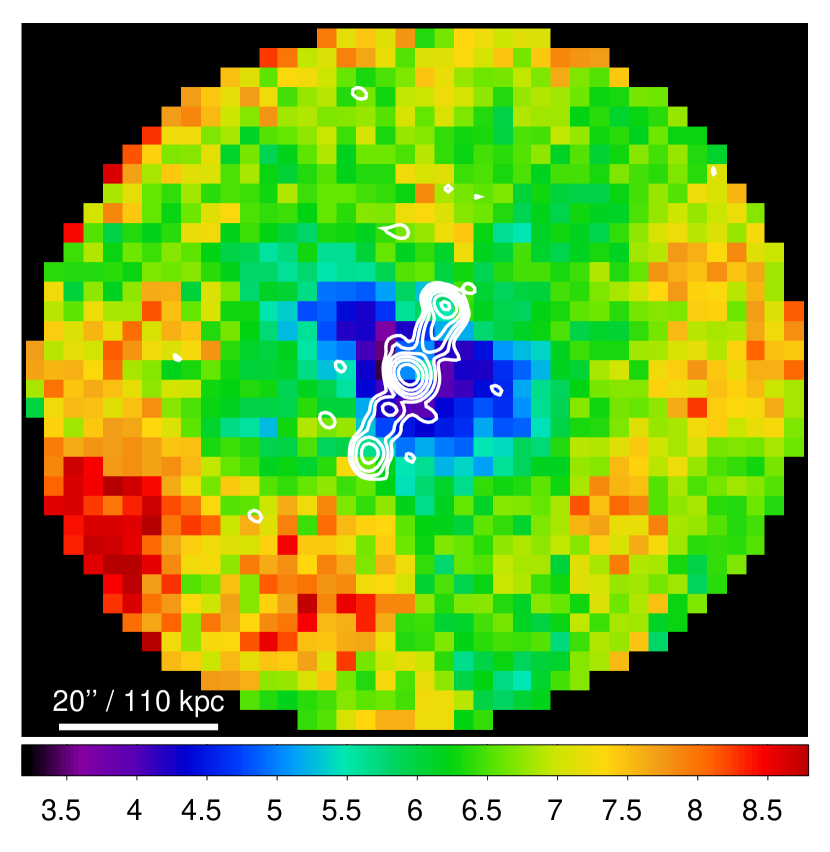
Using the mapping technique described in O’Sullivan et al. (2011), we created spectral maps of the cluster core. Each 2.52.5′′ pixel of the map represents an absorbed APEC model fitted to a spectrum extracted from a circular region chosen to contain at least 1000 net counts. The extraction regions had radii of 2-30′′ and therefore the spectra for neighbouring regions are generally not independent. Fig. 12 shows the temperature map. Uncertainties on fitted temperatures are 7-17%. The map shows that the coolest part of the ICM is extended along a northeast-southwest axis, roughly perpendicular to the (projected) axis of the radio jets, and not aligned with the major axis of the best fitting surface brightness -model. However, we note a good correlation between cool temperatures and optical filaments; all the filaments are found in regions with kT5 keV, and the complex of filaments northeast of the BCG extends along the same axis as the coolest part of the ICM.
The spectral map does not show any structures correlated with the cavities, northwest filament, or spiral structures discussed in section 5.1. Extracting spectra from the cavity regions shown in Fig. 7 and from regions chosen to cover the northwest filament and residuals around the northern cavity, we found no significant temperature differences beyond those expected from the map. Similarly, placing regions to match the spiral residuals shown in Fig. 9, we find only a 1.5 significant temperature difference between the positive and negative residuals, the negative region being marginally cooler (5.780.30 keV compared to 6.35 keV).
5.3 Mass Profiles
We determine the total gravitational mass profile of the cluster, and its gas mass profile, using the Joint Analysis of Cluster Observations system (JACO, Mahdavi et al., 2007). This allows us to fit models jointly to the Chandra and XMM-Newton data, taking advantage of the improved signal–to–noise ratio thus available. The dark matter distribution was modelled as an NFW (Navarro et al., 1995, 1997) profile with a freely fitted concentration parameter. For the gas profile, we used a model consisting of three –models, with the central component multiplied by a power law with free slope to model the bright emission from the central cool core. The minimum radius to which the mass profile can be determined is limited by the point–spread function (PSF) of the XMM-Newton EPIC instruments. Since the angular size of the BCG is small (3′′ across), we cannot resolve the mass profile within the galaxy. We therefore do not include an additional mass model to account for the stars, but consider them to be included in the NFW model.
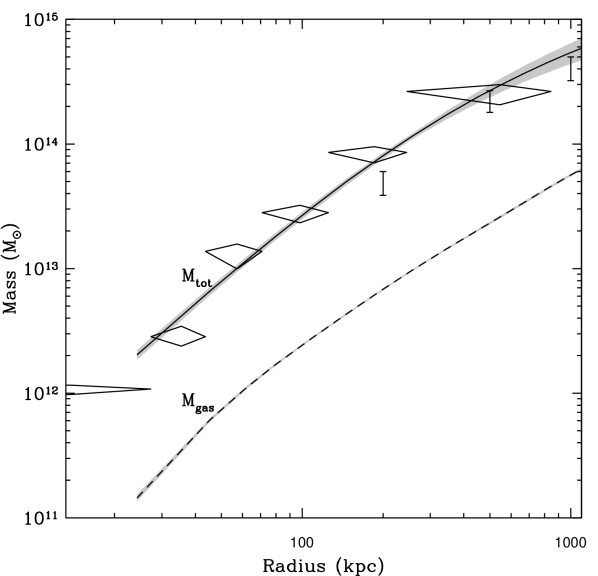
The results of this fitting are shown in Fig. 13. For comparison, we have also included mass data points derived from the temperature and density profiles shown in Fig. 11. These are calculated under the assumption of hydrostatic equilibrium, as is the case with the JACO modelling, but using the apparent gradients between bins. The two estimates agree reasonably well. From the fitted model we are able to estimate characteristic masses and radii for CL09, as well as the enclosed gas fraction, for different degrees of overdensity. These are shown, with 1 uncertainties, in table 5. The gas fraction within R2500 is well within the range of gas fractions found for the sample of massive clusters studied by Allen et al. (2008).
| Overdensity, | RΔ | MΔ,X | MΔ,wl | fgas |
|---|---|---|---|---|
| (kpc) | 1014 | 1014 | ||
| 2500 | 48729 | 2.600.50 | 2.140.43 | 0.090.01 |
| 500 | 108897 | 5.831.69 | 4.120.98 | 0.110.02 |
| 200 | 1648164 | 8.102.64 | - | 0.120.03 |
We also include a comparison with weak lensing mass estimates drawn from the Canadian Cluster Comparison Project (CCCP). This is a multiwavelength study of a sample of X-ray luminous clusters of galaxies, which includes CL09. To determine weak lensing masses, deep imaging data were obtained using Megacam on the Canada-France-Hawaii Telescope. The weak lensing analysis is described in Hoekstra et al. (in prep). A detailed discussion of the analysis and the various issues that arise when interpreting the data is provided in Hoekstra (2007), which analysed an initial sample of 20 clusters.
Fitting the measurements between 0.5-2 Mpc with a singular isothermal sphere model, we find a best fit which corresponds to a velocity dispersion of =974. We also compute aperture masses, which we convert to spherical masses under the assumption that the density profile can be described by an NFW profile (see Hoekstra, 2007, for details). The resulting masses are marked on Fig. 13. Table 5 lists characteristic masses measured at values of determined from the X-ray analysis (note we cannot determine this way). The uncertainties include the statistical error caused by the intrinsic shapes of the sources and the noise from distant large scale structure (e.g. Hoekstra et al. 2011). The lensing results are in good agreement with the X-ray mass determinations.
6 Radio spectral analysis and physical parameters
6.1 The integrated spectrum

In Fig. 14 we show the integrated radio spectrum of CL09 between 74 MHz and 15 GHz, obtained using the flux densities in Table 3. The source has a straight spectrum with steep slope, , between 151 MHz and 15 GHz. The upper limit at 74 MHz suggests a low-frequency flattening of the spectrum, with below 151 MHz. We fitted the spectrum using a continuous injection (CI) model (e.g., Kardashev, 1962), in which electrons are continuously injected in a region of constant magnetic field. The CI best-fit model (solid line in Fig. 14) provides an injection spectral index and a break frequency MHz. Two additional data points are marked on Fig. 14, at 327 MHz (from the WENSS survey, Rengelink et al., 1997) and 28.5 GHz (Coble et al., 2007). It is unclear why these measurements disagree with the other data points, and we therefore do not include them in the fit.
We note that a spectral break at a frequency higher than 15 GHz is implausible for energetic reasons. Assuming =2+1, where is the slope of the injection energy spectrum of the electrons, and 15 GHz, the observed spectral index at lower frequency ( = 1.25 ) gives =3.5, which implies an extremely steep spectrum of the injected electrons and an untenably large energy budget of the electron population, contributed by electrons at lower energies.
Fig. 15 shows the integrated spectra of the individual components of CL09, computed from the flux densities in Table 4. Given the absence of an obvious spectral curvature and limited number of data points, we used a simple power-law model to fit the spectrum of each component. The slopes provided by the best-fit models are summarised in Table 4. The spectral indices of the individual components are all steep (), including the central component.
6.2 Physical parameters
We calculated the physical parameters of the source using the standard assumptions that the relativistic particle and magnetic field energy densities are uniformly distributed over the radio source volume and in approximate energy equipartition. We also imposed a low-energy cutoff (where is the electron Lorentz factor) in the energy distribution of the radiative electrons, instead of adopting a fixed interval of frequency (typically 10 MHz-100 GHz; e.g., Pacholczyk, 1970). It has been shown that a frequency cutoff of 10 MHz may neglect the input of electrons for typical equipartition magnetic fields of 1–10 G (Brunetti et al., 1997; Beck & Krause, 2005). Since a large fraction of the relativistic particle energy may be at lower , imposing a low-energy cutoff allows to take into account the contribution from these particles. In our calculations, we adopt =100, which corresponds to a low-energy cutoff of 50 MeV.
We adopted an injection spectral index =0.75 provided by the CI best–fit model (see Section 6.1), and normalised the model to the radio luminosity at 151 MHz, the lowest frequency at which the source is detected, and thus the least affected by spectral ageing of the electron population. Cylindrical geometry was adopted to calculate the volume of the source. The results are summarised in Table 6, where we list the radio luminosity at 151 MHz, injection spectral index , break frequency, volume, and equipartition magnetic field . The last three columns provide estimates of the radiative age , velocity growth and integrated luminosity of the source (see Sect. 6.3).
6.3 Radiative age
Under a number of assumptions, the knowledge of the break frequency in the spectrum of a radio source allows us to estimate the time elapsed since the source formation (e.g., Myers & Spangler, 1985). If radiative losses dominate over expansion losses, the magnetic field is uniform across the source and remain constant over the source life time, and reacceleration processes can be neglected, the radiative age (the time since the AGN last powered the jet, launching relativistic electrons into it) can be obtained as
where is expressed in GHz, and and in G (Parma et al., 2007). is the equipartition magnetic field, and is the equivalent magnetic field of the cosmic microwave background (CMB) radiation, i.e., the magnetic field strength with energy density equal to that of the CMB at the redshift .
Using the break frequency in Table 5, we estimate a radiative lifetime of 130 Myr for CL09. We also derive an estimate of the source growth velocity , where is the speed of light, obtained assuming a constant velocity and a linear size of LLS=150 kpc, as measured from the radio images in Sect. 4, i.e., . We found (1200). For comparison, the ICM sound speed varies from 870-1120 over the length of the jets.
| log | V | L | |||||
| (W Hz-1) | (MHz) | (105 kpc3) | (G) | ( yr) | () | () | |
| 26.19 | 0.750.05 | 51 | 2.3 | 9.9 | 1.3 | 0.004 | 2.11042 |
7 Summary and Analysis of Results
7.1 The cluster
Our X–ray observations show CL09 to be a luminous, massive cluster with a strong cool core. The ICM is only mildly elliptical in the plane of the sky, with no visible subclumps or near neighbours. Spectral mapping shows a degree of ellipticity in the temperature distribution, particularly in the core. To some extent this ellipticity may be a product of the jet/ICM interactions, with the inflation of cavities reducing the amount of cool gas along the jet axis. However, there is no indication of azimuthal asymmetries outside the core which might invalidate our temperature profile or mass analysis. In general, it seems fair to describe the cluster as essentially relaxed, despite the structures detected in the ICM.
In order to look for more subtle deviations, we compared the physical properties of CL09 to other clusters via the M–T and L–T relations. We took the L–T relation for the REXCESS cluster survey (Pratt et al., 2009), specifically the relation between temperature and luminosity in the 0.15-1R500 radial range. Using the value of R500 determined in Section 5.3, we extracted a Chandra spectrum and fitted an absorbed APEC model. The resulting luminosity falls almost exactly on the relation. Following the same approach, we compare with the M–T relations of Vikhlinin et al. (2006) and Arnaud et al. (2005). In both cases the cluster falls on the relation to within the 1 uncertainties.
The weak spiral structure found in the residual images may be an indicator of gas motions in the ICM. Such structures are typical of sloshing motions, where the cluster core is disturbed by the nearby passage of another massive object (Ascasibar & Markevitch, 2006; ZuHone et al., 2011). Spiral structures are observed in both surface brightness and temperature in a number of disturbed galaxy clusters and groups (e.g., Clarke et al., 2004; Randall et al., 2009; Laganá et al., 2010; Blanton et al., 2011). We do not observe the expected spiral structure in the temperature map of CL09, nor do we observe the sharp paired cold fronts observed in many sloshing systems. However, this may simply be because the Chandra observation has insufficient depth to allow fine-grained temperature mapping.
There is no clear evidence of a perturber in the X–ray data, but we can consider what kind of system might be required to disturb the cluster. Disturbance will be more easily caused by higher mass systems, but given the mass of CL09, M200=8.11014, it seems likely that a group–scale system with a mass of a few 1013 would be required. Such a group would be expected to have a luminosity 1043, and would thus be detected if it were still close to CL09. As no perturber is detected, we are left with the possibility that either the disturbing system had a very low mass (e.g., an individual infalling galaxy or poor group), that the gas associated with the disturber has been stripped, that it is outside the ACIS-I field of view, or that it has already fully merged with CL09 leaving only the spiral residuals as a record. Simulations of cluster–cluster mergers also show spiral structures in cases where the merger is off-axis (e.g., Poole et al., 2006). The cool core and weak spiral pattern in CL09 suggest that if a merger took place, the cluster cores coalesced some time ago and the cluster is now largely relaxed.
7.2 The radio source
Our analysis of the GMRT and VLA observations of the large–scale radio source provide a relatively clear picture of its status. The source is an FR I/FR II transition system, with relatively straight, resolved jets and fairly small, bright lobes. The source has a steep spectral index between 151 MHz and 15 GHz (=1.250.01), with a probable break at 50 MHz. Separate spectral indices measured in the jets, lobes and central component are also steep and broadly comparable, with no clear change of spectral index with distance from the centre. The source is therefore probably old (=130 Myr) and no longer powered by the AGN. There is no indication of faint, low–frequency emission on scales larger than the jets and lobes, and therefore no indication of any earlier radio activity.
The VLBA observation reveals a small–scale (200 pc) double source, both components of which are extended. No point–like core is detected, indicating that both components of the double source are probably lobes, rather than being associated directly with the AGN. The flux from the VLBA double is comparable to the flux of the central component of the large–scale source, with no indication of any additional emission on other scales. The similarity in flux suggests, firstly, that the inner double is a separate structure from the large–scale jets. There is no indication of intermediate–scale structures between the inner double and the base of the large–scale jets 20–30 kpc from the centre. The well–defined, compact lobes of the inner double also support this conclusion. Secondly, if the central component of the large–scale source is merely the unresolved inner double, the steep spectral index measured for the central component is also applicable to the VLBA double, implying that it too is old. Double sources with such small physical scales are often assumed to be young, but it has been suggested that many such sources may be short-lived (Kunert-Bajraszewska et al., 2010), and examples where spectral index measurements show that the jets have already shut down are not unknown (e.g., Orienti et al., 2010). The age of the inner double cannot be confirmed without new VLBA observations at other frequencies. Such observations would also determine whether the central AGN is truly radio quiet or whether it is self–absorbed at 1.4 GHz, which is not uncommon for radio cores.
In the plane of the sky, the axis of the VLBA inner double differs from that of the large–scale jets by 17∘. The similar sizes of the two components of the inner double suggests that it is not strongly relativistically beamed. Under the assumption that the jets are intrinsically symmetric, the jet-to-counterjet brightness ratio can be used to constrain the velocity (where is the speed of light) and orientation of the jets (see Giovannini et al., 1994, and references therein). We measure a ratio between the N and S lobe flux densities of the double. Adopting , i.e., the spectral index of the unresolved central component on arcsecond scale (Tab.4), we estimate =0.03. Given the distribution of jet velocities on the milliarcsecond scale, where usually (e.g., Giovannini et al., 2001), it is very likely that the inner double is lying almost in the plane of the sky, as is larger than 80∘ for .
7.3 Cavity energetics and timescales
From the surface brightness analysis, we have fairly strong evidence of a cavity corresponding to the northern jet and another whose position coincides with the southern jet but which is somewhat larger than the current radio emission. The southern cavity lies within the negative spiral residual, and it is therefore difficult to reliably determine its size. Neither of these cavities is correlated with the radio lobes, only with the jets.
| Cavity | radius | Dcore | 4 | tsonic | tbuoy | trefill | Psonic | Pbuoy | Prefill |
|---|---|---|---|---|---|---|---|---|---|
| (kpc) | (kpc) | (1060 erg) | (Myr) | (Myr) | (Myr) | (1044) | (1044) | (1044) | |
| N | 15.5 | 22.7 | 2.2 | 20.7 | 41.9 | 122.8 | 32.8 | 16.3 | 5.5 |
| S | 22.117.7 | 24.9 | 5.0 | 25.9 | 54.7 | 158.0 | 61.2 | 29.0 | 10.0 |
| N lobe | 13.8 | 53.1 | 0.7 | 45.9 | 53.1 | 52.1 | 4.9 | 4.2 | 4.3 |
| S lobe | 13.8 | 61.9 | 0.7 | 53.6 | 66.9 | 56.3 | 4.2 | 3.3 | 4.0 |
We might also have expected evidence of cavities coincident with the radio lobes. Although no clear X-ray holes are seen at the positions of the lobes, we can test whether weak surface brightness depressions might be present. Adopting the regions shown in Fig. 7 (circles of radius 13.8 kpc) we compare the exposure corrected surface brightness with equally sized regions placed to either side of the lobes, along an ellipse defined by the best fitting surface brightness model. The southern lobe region has a surface brightness within 1 of its neighbours. The northern lobe region is actually brighter than the neighbouring regions, since it contains part of the northeast filament. We therefore have no evidence of cavities coincident with the radio lobes.
We can also test whether our data are sufficiently sensitive to detect cavities of the expected size at the position of the lobes. We estimate the flux deficit expected for cavities of size comparable to the radio lobes, based on the mean density and temperature at that radius. We predict that such cavities should produce a deficit of 30 counts (0.3-3 keV), which is equivalent to only a 2.9 drop for the southern lobe. We cannot therefore be certain that we would reliably detect cavities, if they do exist. A comparable calculation for the northern cavity (i.e., the X–ray hole) suggests that we should expect a decrement of 400 counts. There are no undisturbed regions at that radius which can be used for comparison, but the observed flux is 320 counts lower than that predicted by the best-fitting surface brightness model.
Inverse–Compton scattering of cosmic microwave background (CMB) photons by electrons in the relativistic plasma of the radio lobes could potentially produce additional X-ray flux in the areas where we expect to see cavities. Under the assumption of equipartition, we estimate the energy of the electron population of each lobe to be 5-101056 erg, for an injection spectral index =0.7, minimum Lorentz factor =100, and an equal division of the energy in the relativistic particle population between electrons and protons or positrons (k=1). Following the method described in O’Sullivan et al. (2010), we estimate the expected inverse–Compton flux from this electron population using the relations of Erlund et al. (2006). The expected 0.3-3 keV flux from each lobe is 1.3-2.210-17, a factor 10-4 lower than the flux measured in these regions. It is therefore clear that our failure to detect cavities is not caused by inverse-Compton emission. We note that the synchrotron self–Compton emission from the radio lobes will be even fainter, since the energy density of radio photons in the lobes is a factor 10-3 lower than that of the CMB.
Since we cannot be certain that the radio lobes do not have associated cavities, we estimated the energy required to inflate the observed cavities, and any potential cavities at the position of the lobes. These estimates are shown in Table 7, as are dynamical estimates of the timescale over which the cavities have formed and the implied mechanical power of the radio jets.
Cavity volumes and the uncertainty on the volume are estimated following the methods described in O’Sullivan et al. (2011). We assume the jets to be in the plane of the sky, and parameters from our radial spectral fits, which account for projection effects. We define the energy of each cavity to be 4, the enthalpy of a cavity filled with a relativistic plasma. We estimate the time for the cavity to rise to its current position at the speed of sound (tsonic), the time for it to buoyantly rise to its position (tbuoy, Churazov et al., 2001), and the time for the ICM to refill the current cavity volume (trefill). For comparison, the bolometric X-ray luminosity within the radius to which the radio jets extend (77 kpc) is 8.5. The mechanical energy required to inflate the observed cavities () is greater than this luminosity, assuming the commonly used buoyant timescale. Even if we use the longer radiative age estimate (130 Myr), the enthalpy of the cavities (4) still exceeds the cooling luminosity. The power of the jets is therefore more than sufficient to balance cooling in the cluster core. If we assume that all the energy of the cavities is available to heat the ICM, the jets can balance cooling out to at least 200 kpc (for the refill timescale), or out to the edge of our temperature profile (for the buoyant timescale).
Our estimates of the cavity sizes and positions differ from those of HL11. We find the northwest cavity to be somewhat smaller (HL11 use a cavity region which extends across the northwest X–ray filament, which we consider likely to be the cavity rim) and the southeast cavity to be of similar size but closer to the cluster core. These differences arise from our different approaches to identifying cavities. HL11 examine unsharp–masked and residual images, but select the cavity regions from the raw image, whereas we select regions from the residual image. This demonstrates the inherent subjectivity of cavity identification. HL11 estimate timescales and powers for the cavities which also differ from ours, but our estimates of total jet power are in reasonable agreement, given the uncertainties. One potentially important difference in interpretation is that the outer edges of the cavity regions used in HL11 overlap the radio hotspots, and they therefore say that the cavities and hotspots coincide. Our regions do not overlap the radio lobes, and both their cavity regions and ours are poorly correlated with the radio lobes.
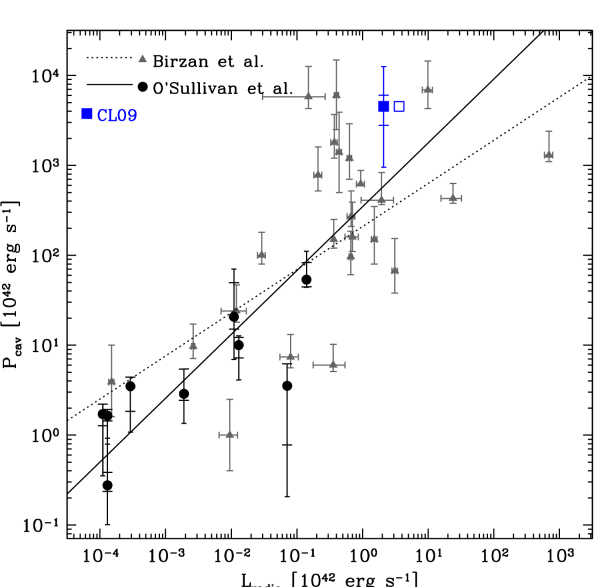
HL11 also compare CL09 to the known relations between jet power, radio luminosity and cooling luminosity. We perform the same comparison, using our estimates of these parameters. Fig. 16 shows a plot of cavity power (for the detected cavities only) against integrated 10 MHz–10 GHz radio luminosity, which we estimate to be 2.1. CL09 falls above the best fitting relation, but is comparable to a number of other clusters with large jet powers. Its offset from the relation is in part due to spectral ageing which has both steepened the spectral index and lowered the flux we measure across all frequencies. We can partially correct for this effect by estimating the radio luminosity using the injection spectral index =0.75 normalised to the 151 MHz flux, which (of the frequencies at which we detect the source) is least affected by radiative ageing. We estimate this partially corrected radio luminosity to be 3.6. This moves the source closer to the best fitting relation, but only by a small amount. A more important issue is the timescale used. All data points in Fig. 16 use the buoyancy timescale, but for CL09 a longer timescale may be more appropriate, given the longer radiative age estimated from the radio spectral analysis, and the possible link between the onset of star–formation and shut–down of the jets (discussed in Section 8.1). This would move the cluster downward, toward the best–fitting relation. However, we note that if there are undetected cavities coincident with the radio lobes, including them would move the point further away from the relation.
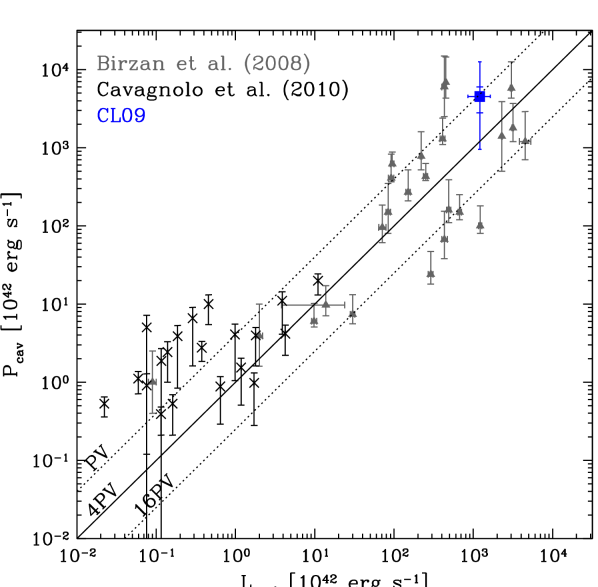
Fig. 17 shows a plot of cavity power against Lcool, the luminosity of the region within which the cooling time is 7.7 Gyr. CL09 has a cavity enthalpy in excess of the cooling luminosity, falling on the line, indicating that the mechanical power needed to inflate the cavities is sufficient to balance cooling without any contribution from the energy stored in the relativistic particles or magnetic field of the radio jets. CL09 is quite comparable to the clusters of the Bîrzan et al. (2008) sample, falling within the scatter of the cluster population. In both Fig. 16 and 17, our results are qualitatively similar to the findings of HL11, suggesting that the radio source in CL09 is capable of balancing radiative cooling and that it is mildly underluminous for its jet power.
It should be noted that the jets are very likely to have expanded supersonically for some portion of their history and would have driven shocks into the ICM during this period. Shocks associated with radio jets are typically weak, with Mach numbers 1.5 (Forman et al., 2005; McNamara et al., 2005, e.g.,). Shocks driven by the tips of the radio jets would have continued to move out into the ICM after the jets shut down, becoming increasingly difficult to detect as they move into regions of lower X–ray surface brightness. The northwest filament might represent a shock front, or merely material pushed out subsonically by an expanding cavity. Unfortunately the data are too shallow to allow us to determine whether the temperature of the northwest filament differs from the surrounding ICM. The strength of any potential shock can be estimated from the Rankine-Hugoniot jump conditions (e.g., Landau & Lifshitz, 1959), based on the density jump. Assuming temperature differences have a minimal impact on surface brightness, the density jump can be approximated as the square root of the surface brightness jump. The surface brightness model does a rather poor job of representing the ICM in this region, but correcting for the underlying trend in surface brightness according to the model prediction, the remaining surface brightness jump is only a factor of 1.08, suggesting a shock of Mach 1.03. This suggests that the northwest filament is likely to be the product of near-sonic expansion, rather than a supersonic shock.
Estimating the age of the VLBA double is difficult, since its angular scale is far smaller than that of the X-ray pressure profile. We can calculate an approximate sonic timescale under the assumption that the central temperature (and therefore sound speed) is similar to that observed in our innermost projected temperature bin, 3.3 keV. This implies a sound speed of 870 and an timescale of order 105 yr. The buoyant velocity depends on the gravitational mass inside the mean radius of the lobes, which is unknown, but would exceed the sound speed unless the enclosed mass is 2.4109, and would be 2/3 of the sound speed for 109. We have no way of recognising supersonic expansion on these scales, so the cavities could be younger than the sonic estimate. Conversely, we cannot confirm the presence of cavities, and if the lobes are partially filled by entrained thermal plasma the effects of buoyant forces could be reduced to the point where the lobes remain in the core for long periods (as in NGC 5044, David et al., 2009). These estimates of the age of the VLBA lobes should therefore be treated with caution.
As well as the age of the radio source, we are also interested in placing limits on the age of the current period of quasar activity. Current simulations of AGN in groups and clusters often model the feedback as either a bipolar outflow or a simple injection of thermal energy (e.g., Dubois et al., 2010; McCarthy et al., 2010; McCarthy et al., 2011). Both cases produce larger–scale hot outflows which drive material into the outskirts of the system. The current radiative luminosity of the QSO (a few 1047) is comparable to the mechanical power of the outflows modelled in these simulations, and the authors argue that radiative feedback should be efficiently converted into a mechanical outflow in the group or cluster core (Dubois et al., 2010). If the QSO were producing a large–scale wind, we would expect it to inflate a central cavity and/or drive shocks out into the surrounding ICM. We might expect to detect such a feature once it grew to a sufficient size to be resolved. Similarly, if the QSO were directly heating the ICM, we might expect to see a central temperature rise. We are limited by the bright central X–ray source, but we would expect to detect features of comparable size to our innermost temperature bin, 13.8 kpc (2.5′′). For a sound speed of 870 this suggests a timescale of 15.6 Myr. The lack of features on this scale suggests that the AGN is either ineffective in heating the ICM or has only been powerful enough to do so for a relatively short time. It should also be noted that the QSO has as yet only heated the dust enshrouding it, rather than destroying or sweeping it out of the galaxy.
7.4 The northeast optical filament and the radio spur
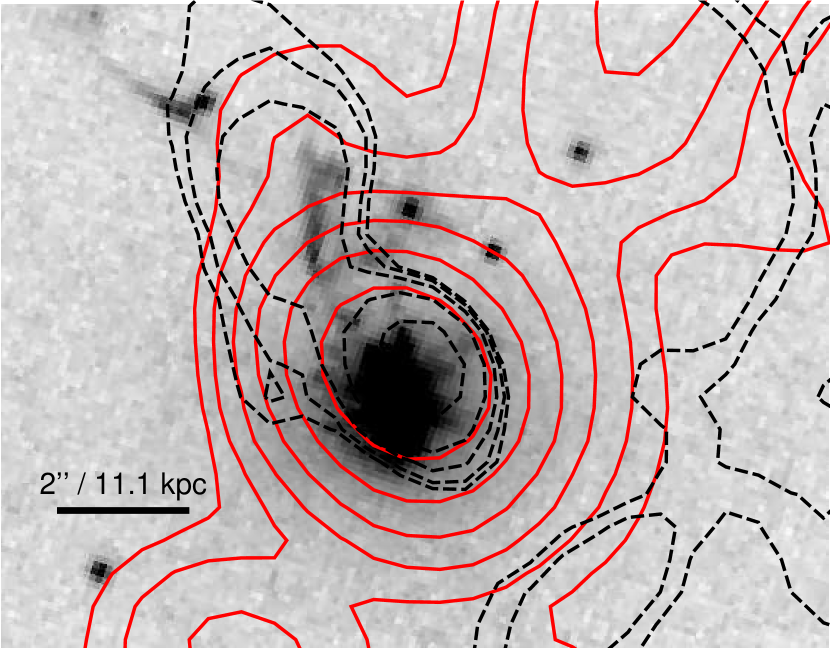
The small residual X–ray feature northeast of the core in Fig. 7 extends in roughly the same direction as a spur of radio emission. Fig. 8 shows the 1.28 GHz radio and X-ray residual contours overlaid on the HST 622W–band image. The X-ray and radio features appear to be correlated with the brightest of the gaseous filaments north of the BCG.
Optically luminous filaments of ionised gas have now been observed in numerous nearby cool core clusters, and they are known to be associated with the coolest, densest regions of the X–ray emitting ICM (e.g., Heckman et al., 1989; Conselice et al., 2001; Fabian et al., 2003; Crawford et al., 2005; Hatch et al., 2007; Hicks et al., 2010; Donahue et al., 2010; Oonk et al., 2010; McDonald et al., 2011). This association is clear in CL09, with the optical filaments falling within the coolest part of the temperature map. This suggests that the ionised gas is either the product of cooling from the ICM, or that it enhances cooling through conduction of heat from the hot gas or by mixing with the hot phase.
A correlation with radio emission is more difficult to explain. The spur is detected at 6 significance in the 1.28 GHz map, and a similar feature on the far side of the central component is detected at 3 significance. The northeast spur should be detected in the VLA 1.5 GHz map, but is not; however a feature coincident with the southwestern counterpart is detected. We cannot be sure whether these spurs are real structures. A number of other small structures are seen in the 1.28 GHz map which seem likely to be noise features or marginally detected background sources (e.g., the small blob of emission attached to the tip of the northern lobe). We therefore consider their possible origin, but note that deeper observations are needed to confirm or refute their existence.
Star formation is observed in some optical filaments in galaxy clusters (e.g., Johnstone et al., 1987; McNamara & O’Connell, 1993; Voit & Donahue, 1997; Crawford et al., 1999; O’Dea et al., 2004; Canning et al., 2010; Oonk et al., 2011; McDonald et al., 2011), and could produce some degree of radio emission. Measuring the 1.28 GHz flux density of the spur is difficult, given its proximity to the bright central component, but our best estimate is 0.25 mJy. Using the known relation between radio flux and star formation rate (Bell, 2003; Garn et al., 2009), we estimate that an SFR of 95 would be required to produce the feature. Star formation at this level would likely be obvious in the optical images and would have been detected in previous spectroscopy. For comparison, (Bildfell et al., 2008) estimate an SFR or 41 for the whole BCG.
The spurs could be evidence of a third epoch of jet activity, with a different axis to both the large–scale jets and the VLBA double. If the spurs represent the full extent of a jet, we might expect small-scale cavities at the position of the spurs. It is unclear whether we could detect such small features, but the bright X–ray feature associated with the northeast spur would certainly not be expected.
Alternatively, if the spurs were remnants of a jet which was active before the large–scale jets but on a similar spatial scale, their radio emission at larger radii might have faded beyond our ability to detect. In this case the optical filaments might be gas uplifted from the core by cavities which have now moved out to large radii where they cannot be detected in the Chandra observation. A similar correlation is seen in the Perseus cluster, between optical filaments behind an old cavity and a ridge of emission in the radio mini halo(Fabian et al., 2011), but we note that there is no evidence of any diffuse radio halo in CL09 down to the sensitivity of our low-frequency observations. The suggestion that the spurs are a remnant of a previous outburst is thus highly speculative and the data provide no supporting evidence for this hypothesis beyond the presence of the spurs.
Only a deep higher resolution observation can determine whether the spurs are real and physically correlated with the other structures in the cluster core. We therefore conclude that while the X–ray/optical correlation is related to cooling in the dense ICM, the reality and origin of the radio emission is uncertain and cannot be resolved with the current data.
8 Discussion
8.1 History of the AGN and the cluster
Previous studies of CL09 have noted several features which suggest that the orientation of the AGN, radio jets and surrounding dusty torus may have recently changed. These include the misalignment of the radio jets and the ionisation cone of the quasar (as traced in polarized optical line emission, Hines & Wills, 1993; Crawford & Vanderriest, 1996; Hines et al., 1999; Armus et al., 1999; Tran et al., 2000), the steep high–frequency spectral index of the radio lobes, and the flatter index and high luminosity of the radio core found by Hines & Wills (1993). It was argued that the large–scale radio jets were no longer powered by the AGN, and that some event had caused the AGN to change its axis and launch new jets at an angle close to the line of sight, which were as yet too small to be resolved (Hines & Wills, 1993; Crawford & Vanderriest, 1996).
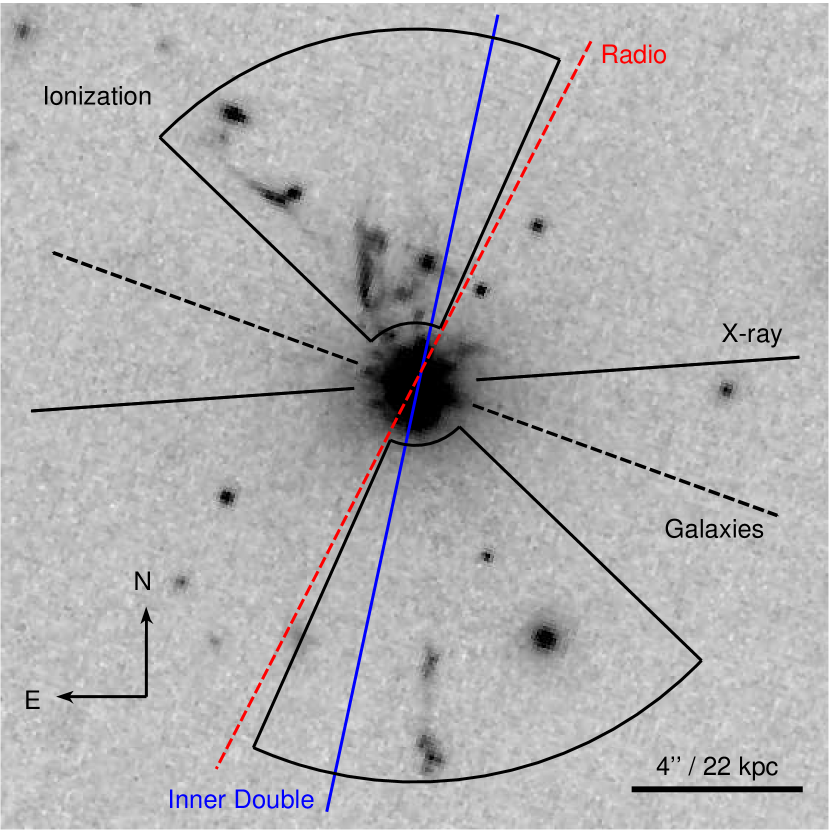
Our results support this general picture and improve on it. Fig. 18 shows in diagrammatic form the orientation of the various structures associated with the AGN and BCG. As noted by Hines & Wills (1993) the axis of the large–scale radio jets falls outside the ionisation cones of the AGN. The VLBA inner double source has a position angle 80∘ (from west), within the opening angle of the ionisation cones and torus. However, while it was previously argued that any new jet must be inclined close to the line of sight, the similar sizes of the two components of the VLBA inner double suggest that it is in fact aligned close to the plane of the sky. While the projected orientation of the VLBA source is consistent with the ionisation cones, they do not appear to be perfectly aligned, and an orientation close to the plane of the sky would conflict with the inclination of 37∘to the line of sight found from optical polarisation measurements (Hines et al., 1999). This may indicate that as well as a change in AGN orientation between the epoch of the large–scale jets and that of the VLBA double, there has been a further change and the inner double has shut down.
The current state of the radio jets is still open to question. Both dynamical and synchrotron ageing arguments suggest that the large–scale jets are old, and their spectral index confirms that they have not been powered by the AGN for some considerable time. The steep spectral index of the central component of the large–scale source suggests that the inner double is also old. In this case the lack of a resolved core in the VLBA data and the misalignment of the inner double with respect to the ionisation cones would be explained; the AGN would be in a radiatively efficient accretion state with no current radio activity. However, given the small size of the inner double (200 pc) and short dynamical timescale for the lobes (105 yr), and the lack of a direct measurement of their spectral index, it is also possible that the core is active but self–absorbed at 1.4 GHz. Multi-frequency VLBA observations would be needed to measure the spectral index of the inner double and resolve this question.
Hines & Wills (1993) also noted that the radio axis is roughly aligned with the minor axis of the distribution of galaxies within CL09 and suggested that this correlation could be driven by the pressure gradient of the ICM. If buoyant forces are important in the growth of the radio jets, they will tend to align themselves with the steepest pressure gradient, in this case along the minor axis of the cluster ICM. Fig. 18 shows that both the large–scale radio jet and the VLBA inner double are aligned close to the minor axis of the cluster galaxy distribution, but are somewhat less well aligned with the ICM. The alignment may be coincidental, as the pressure gradients on 200 pc scales are probably trivial and therefore the alignment of the VLBA double is unlikely to be governed by buoyant forces. It should also be noted that the coolest part of the ICM is more clearly perpendicular to the jet axis, but this is probably caused by the excavation of cavities by the jets, rather than the temperature distribution affecting jet propagation.
More interestingly, the various AGN axes are poorly aligned with the BCG, whose major axis runs almost north–south. Crawford & Vanderriest (1996) note that the velocity structure of the [Oiii] emission in the BCG suggests rotation about a roughly east–west axis. The relatively small rotational velocity (200) argues against the gas being located in a simple equilibrium rotating disk given the deep potential well of the BCG, but a rotating structure which has yet to reach equilibrium with the galaxy seems possible. The coincidence between the onset of the most recent period of star formation (200 Myr ago Pipino et al., 2009) and the cessation of jet activity (130 Myr ago), both of which could be caused by an increase in the available cool gas supply, suggests that there was a sudden influx of gas into the galaxy 200 Myr ago. This raises the possibility that the BCG has recently undergone a gas–rich merger. The presence of dust mixed with the ionised gas in the inner filament and galaxy core (Tran et al., 2000) supports this hypothesis. Such a merger could provide the cold gas needed to fuel the current powerful star formation and rapidly increase the accretion rate of the AGN, causing it to shift from a radiatively inefficient mode with large–scale jets, to a radiatively efficient quasar mode. The axis of the AGN could also have changed in response to the different angular momentum of the infalling material, and might not yet have stabilised.
CL09 is a massive cluster with an extended dense ICM. A single gas–rich galaxy falling into the cluster would likely be stripped before it could merge with the BCG. However, a gas–rich galaxy in the core of an infalling galaxy group or cluster could be protected by the surrounding intra-group medium, since this would need to be stripped before galactic gas could begin to interact with the ICM of CL09. This could potentially insulate the galaxy until the two cluster cores merged. Simulations suggest that a cluster–cluster merger beginning 4-5 Gyr ago could produce an apparently relaxed cluster with weak spiral disturbances in the ICM, but with the cluster cores merging only in the last few hundred Myr (Poole et al., 2006). A merger scenario therefore seems plausible. The distribution of galaxies could potentially provide evidence of a merger, and it is intriguing to note that an apparent chain of galaxies extends from northeast of the BCG across its northern side, overlapping the northern optical filament. However, without velocity measurements from these galaxies, we cannot be certain that this is not a mere chance superposition.
Assuming that the star formation is taking place in a disk and follows the standard Kennicutt-Schmidt relation (Kennicutt, 1998),
| (2) |
we can use the star formation rate (=41 Bildfell et al., 2008) and available gas mass (Combes et al., 2011, 3.2109) to estimate the radius of the star formation region, . Taking the rotational velocity of the [Oiii] emission (200 Crawford & Vanderriest, 1996) to be representative, we find that the disk is likely to have a radius 270 pc (0.05′′). This radius is considerably smaller than the region of blue optical colours in the core of the BCG (20 kpc radius, Bildfell et al., 2008). The blue core is probably produced by a relatively small mass of young stars formed during a more energetic period of star formation shortly after the cold gas entered the BCG 100 Myr ago. The ongoing star formation traced by the [Oii] emission is probably fuelled by material left over from this initial burst, which has had time to fall into the central regions of the BCG. A compact, dense, gas–rich star forming disk around the AGN provides a natural explanation for the heavy obscuration seen in X-ray and IR-NUV SED fitting (e.g., Vignali et al., 2011).
The presence of cavities, and in particular their correlation with the jets but not the lobes, complicates our picture of nuclear activity. For the southern jet it seems possible that the observed cavity is part of a larger structure extending out to include the lobe, but that the Chandra observation is not deep enough to detect its outer parts. However, if the northern cavity was formed by the jet, the rim of material around the cavity must have been formed at the same time, with the northern jet first inflating the cavity and then pushing through its outer rim to form a lobe outside. Again, the northern lobe would in this case have an associated cavity, which we fail to detect because the observation is too short and the lobe is partly obscured by the rim of the inner cavity. This formation of multiple cavities might be explained by variation of jet power during the outburst, or by pre-existing structures in the ICM.
An alternative scenario is that the cavities were formed by a separate AGN outburst, and are unrelated to the currently visible radio emission. If the cavities were formed first, by some earlier AGN outburst, the weak correlation between radio and X-ray structure would be explained, since the jets need not pass through the cavities. We would require only that the jet axis changes with time (Babul et al., 2012, and references therein), or that motions within the ICM have moved the cavities away from their original axis (Morsony et al., 2010). The opposite case, in which the jets formed first and the cavities through a second outburst, would require the radio emission from this second jet to be disguised. It is just possible that the apparent knots in the radio jet are in fact the lobes of some later outburst. However, this seems unlikely given their poor correlation with the cavity morphology and the consistent spectral indices across the jets and lobes.
In either case, the straightness of the radio jets and the fact that they extend across the boundaries of the spiral X–ray residuals strongly suggests that the position of the BCG relative to the surrounding ICM has remained fairly constant over the last 100-150 Myr. If the BCG position has remained relatively static, any cluster–cluster merger must have occurred several Gyr ago, allowing time for the cluster to have largely relaxed. It also seems likely that any infalling system which provided the gas to fuel star–formation and the AGN was significantly less massive than the BCG.
8.2 The QSO as a source of feedback heating
Energetically, it seems clear that the radio jets are capable of balancing cooling in CL09, provided that: i) the duty cycle is relatively long, so that there are not long periods of cooling with no jet activity, and ii) that the energy injected by the jets can be efficiently coupled into the ICM. These are conditions which apply to all systems in which feedback by AGN jets has been proposed, though in CL09 the evidence of multiple epochs of jet activity make it more likely that condition (i) is being met, at least over timescales 50-150 Myr. The presence of cool gas and star formation in cluster cores is thought to suggest that cooling from the hot ICM is not been completely stopped by AGN feedback (e.g., Bildfell et al., 2008; Pipino et al., 2009). In CL09 we only require cooling to be suppressed and, since the mechanical energy involved in inflating the cavities () is roughly equal to the cooling luminosity of the cluster core, it seems that the jets are easily capable of providing this suppression. It should also be noted that gas may have been brought into the cluster core via a merger, rather than cooling from the ICM.
There is no evidence of heating of the hot ICM through radiative feedback. The accretion related luminosity of the AGN (a few 1047, Vignali et al., 2011; Ruiz et al., 2010) is a factor 100 higher than our estimated jet powers, and comparable to the Eddington luminosity for a 1.5109 black hole, similar to those in nearby BCGs such as M87, or 10 per cent. of the Eddington luminosity if the black hole mass is of order 1010. It therefore seems likely that the AGN is close to its Eddington luminosity, and even with a lower coupling efficiency than for jet feedback we might expect to see some impact on the ICM. Radiative heating of the ICM might occur directly, or via a wind or radiation-driven convection. Optical spectra of the AGN show a blueshifted component with a velocity offset of 1300 (Crawford & Vanderriest, 1996) suggesting an outflow at least on small scales. However, if the ICM is being heated we might expect to see either a central temperature rise, a central cavity, or structures associated with outflowing gas. There is no evidence of any such structures, at least on the 2.5′′ (14 kpc) scales we can resolve outside the central point source, and thus no evidence of heating on the scale needed to balance cooling.
This lack of evidence could be an issue of power or of timescale. It has been suggested that photoionization and Compton heating may only be able to raise the temperature of gas to 1 keV (Sazonov et al., 2005). If radiative feedback can heat gas above this temperature, following Siemiginowska et al. (2010) we can estimate the efficiency of the coupling between the QSO radiation and the surrounding ICM. For the cool core, the opacity of the gas to Compton scattering is where within a radius =70 kpc, and is the Thompson scattering cross-section. This suggests that 0.7% of photons will interact with gas in the core, but only the fraction of these with energies 1 keV could heat the gas. This fraction is not well known, but is likely to be 10%. Taking into account these factors, the luminosity available to heat the gas may only be a few 1044, comparable to the cooling luminosity. The quasar could thus be too weak to stop cooling, despite its apparent high luminosity. Alternatively, the QSO may simply not have been in its current state long enough to affect the cluster core. If our hypothesis of a gas rich merger is correct, the transition to a quasar state was triggered by an increase in accretion rate which also shut down the radio jets, and is fuelled by the same material which fuelled star–formation. Observational studies of galaxies hosting moderate–luminosity supermassive black holes have found a delay of 100 Myr between the times of greatest star formation activity and peak AGN luminosity (Schawinski et al., 2009). This is supported by simulations, which suggest that the delay is caused by the need to remove angular momentum from cold gas brought into the galaxy via mergers (Hopkins, 2012). IRAS 09104+4109 is a considerably more massive system than those considered by these simulations, but a similar delay is certainly possible. The QSO has had at most 100-200 Myr to heat its surroundings, and a dynamical delay in fuelling could mean that it may only have reached its current high radiative power more recently. However, given the lack of any clear effect on the ICM, we must conclude that in CL09, there is only evidence of feedback via the radio jets, and that only this feedback mode is required to balance cooling from the hot ICM. In this regard IRAS 09104+4109 appears similar to H1821+643 (Russell et al., 2010) and 3C 186 (Siemiginowska et al., 2010), both (unobscured) quasars located in cooling flow clusters whose radiative output appears to have had little impact on their environment.
9 Conclusions
Using a combination of deep X–ray and multi-frequency radio observations, we have examined the type-II QSO IRAS 09104+4109, located in the BCG of the rich, cooling flow cluster CL 09104+4109. Prior studies have shown that the BCG is an HLIRG powered by a combination of AGN emission and star formation, and hosts an old, steep spectrum FR I-FR II radio source which has inflated cavities in the ICM. Our analysis allows a more detailed examination of the relationships between the cluster, BCG and AGN, and provides insight into the history of the system. Our results can be summarised as follows:
-
1.
We present new GMRT observations at 240, 317, 610 and 1280 MHz, and reanalyse archival VLA observations at 1.5 and 4.8 GHz. We confirm the previous findings that the radio source has symmetrical straight jets ending in small lobes, with a bright central component. The radio spectrum of the source is an unbroken powerlaw extending down to 240 MHz, with a steep spectral index =1.250.01. Spectral index variations across the source are minimal, and the central source has a comparable index to both the northern and (within the uncertainties) southern lobes. The steep spectral index indicates that the jets are not currently active and the source is passively ageing. The straightness of the jets suggests that the position of the BCG relative to the local ICM has not significantly changed over the lifetime of the source.
-
2.
Analysis of a previously unpublished archival 1.4 GHz VLBA observation of the central source resolves it into an extended double source 200 pc across. Both components are extended, suggesting that these are small–scale inner radio lobes, probably formed by a separate period of jet activity to the large–scale jets. The dynamical timescale of the lobes is 105 yr. The inner double may therefore be young compared to the large–scale radio jets, unless the buoyancy of the lobes is suppressed by mixing with entrained thermal plasma. However, while the spectral index of the inner double cannot be measured directly, its flux is identical (within uncertainties) to the flux measured for the central component of the large–scale source and there is no evidence of significant additional emission which might affect the spectral index measured on larger scales. If the spectral index of the central component is an accurate measure of the index of the inner double, the inner lobes are not currently powered by the AGN. No radio core is detected, but it is unclear whether this is because the AGN is not currently launching jets, or whether the core is active but self-absorbed at 1.4 GHz. The axis of the inner double differs from that of the large–scale jets by 17∘, supporting the hypothesis the AGN axis has changed.
-
3.
We measure deprojected radial profiles of temperature and density of the ICM out to 850 kpc, and determine the gravitational mass and gas mass profiles of the cluster. The core temperature of 4 keV and peak temperature of 8 keV agree well with previous estimates (Hlavacek-Larrondo et al., 2011). The total mass profile agrees well with gravitational lesing measurements, and the cluster falls on both the L-T and M-T relations. The central cooling time within 5′′ (27.5 kpc) is 9.90.9 yr, and we estimate an isobaric cooling rate of 235 within this radius. We map the 2-dimensional temperature structure of the cluster core, and find that the coolest gas (kT5 keV) has an asymmetrical distribution anti-correlated with the axis of the large–scale jets. The cool, optically-luminous gas filaments detected by HST lie within this region of cool ICM temperatures.
-
4.
We confirm the presence of X-ray cavities northwest and southeast of the BCG, coincident with the radio jets, at a radius 24 kpc. However, the precise relationship between the jets and cavities is unclear. The northern cavity is bounded on its west and northwest side by regions of excess surface brightness which may represent a shell of gas expelled from the cavity. The southern cavity appears larger, extending along the jet and to the east outside the radio contours, and lacks any clear shell. Cavities are not detected coincident with the radio lobes, but the Chandra exposure is probably insufficient to detect cavities of the expected volume. We estimate the enthalpy of the detected cavities (7.71060 erg for both, summed) and for any undetected cavities at the location of the radio lobes. The northwest rim of the northern cavity has a relatively sharp, linear appearance, raising the possibility that it may be a shock. Unfortunately the Chandra observation lacks the depth to detect any temperature increase above that of the surrounding ICM, but based on the surface brightness increment we find that if the feature is a shock it is only mildly trans-sonic.
-
5.
We find that the large–scale jets are no longer powered by the AGN, but are relics of activity which ceased 150 Myr ago. The radiative age estimate derived from the radio spectral index (130 Myr) is in agreement with the refill timescales estimated for the cavities associated with the radio jets (120-160 Myr). The radiative and dynamical timescales are in agreement with optical/NUV estimates of the likely age of the star formation in the BCG, 70-200 Myr. The similarity between these timescales and the presence of dust in theionised gas of the inner filament, and in the galaxy core, suggests that the galaxy experienced a sudden influx of cool gas 200 Myr ago, most likely as a result of a merger with a gas–rich interloper. A rapid inflow of gas from such a merger could have triggered star formation and increased the accretion rate of the AGN, causing it to cease jet production and shift into a radiatively efficient accretion mode.
-
6.
In both Chandra and XMM data, subtraction of the best fitting elliptical surface brightness -model leaves a spiral residual feature in the ICM, extending to 200 kpc. This is similar to features seen in other clusters and in simulations, associated with “sloshing” motion of the cluster core caused by a tidal encounter with another massive system, or with a previous merger. No sharp surface brightness or temperature features are observed, and the temperature map shows no correlation with the spiral residual, suggesting that the cluster has had time to relax. A merger with a galaxy group or cluster, beginning 4-6 Gyr ago with core merger occurring 0.5-1 Gyr ago, might explain both this spiral feature and the evidence of a recent gas–rich galaxy merger with the BCG.
-
7.
We estimate the mechanical power output of the radio jets from the cavity enthalpies. Assuming that the jets are efficiently coupled with the ICM, we find that the jets are capable of balancing radiative cooling within the radius to which they extend (77 kpc), and probably out to at least 200 kpc. Cooling times at these radii are 9.5 Gyr, and it therefore seems likely that the jets are capable of maintaining the thermal balance of the cluster as a whole. While no direct evidence of gas heating by the AGN jets is observed, weak shocks of the type usually associated with jet sources would now be difficult to detect, given the age of the outburst and the relatively shallow Chandra data.
-
8.
Although optical spectra of the AGN may suggest an outflow on small scales, we see no evidence of a large–scale radiatively driven wind of the sort predicted by some simulations of quasars in dense environments. The lack of any central cavity, temperature rise, or evidence of outflowing gas suggests that either the quasar is insufficiently luminous, that it has had insufficient time to produce detectable changes, or that radiative feedback is ineffective in heating the hot ICM. It is also notable that the quasar is still enshrouded by 3109 of cool gas (inferred from CO measurements) and 2107 of dust. While some of this material has been heated and/or ionised, the quasar has not destroyed it or swept it out of the BCG. The estimated bolometric luminosity of the quasar is a few and if our merger hypothesis is correct it entered its current radiatively efficient state 50-150 Myr ago.
Acknowledgments
The authors thank the anonymous referee for their comments, which have
improved the paper. We also thank D. Dallacasa, T. Clarke, G. Brunetti,
A. J. R. Sanderson and D. J. Burke for useful discussions of the data and
analysis, A. Siemiginowska for comments on the paper, and J.
Hlavacek–Larrondo for providing her estimates of cavity location. E.
O’Sullivan acknowledges support from the European Community under the Marie
Curie Research Training Network and from Chandra Award number AR1-12014X.
S. Giacintucci acknowledges the support of NASA through Einstein
Postdoctoral Fellowship PF0-110071 awarded by the Chandra X-ray
Center (CXC), which is operated by the Smithsonian Astrophysical
Observatory (SAO). A. Babul and C. Bildfell would like to acknowledge
support from NSERC through the Discovery Grant program. A. Babul also
acknowledges the hospitality extended to him by the Astrophysics and Space
Research Group at the University of Birmingham in 2011. M. Donahue
acknowledges the support of a Chandra GO grant GO9-0143X. Chandra
observation ObsID 10445 was proposed by K. Cavagnolo (now at 3B Scientific
in Atlanta, GA), MD, and G. M. Voit. MD acknowledges discussions with B.
McNamara. We thank the staff of the GMRT for their help during the
observations. GMRT is run by the National Centre for Radio Astrophysics of
the Tata Institute of fundamental Research. We would also like to thank the
Lorentz Center in Leiden for hospitality and support during July 2011
during which time the present study was planned. We acknowledge the usage
of the HyperLeda database (http://leda.univ-lyon1.fr). The National Radio
Astronomy Observatory is a facility of the National Science Foundation
operated under cooperative agreement by Associated Universities, Inc.
References
- Allen et al. (2008) Allen S. W., Rapetti D. A., Schmidt R. W., Ebeling H., Morris R. G., Fabian A. C., 2008, MNRAS, 383, 879
- Armus et al. (1999) Armus L., Soifer B. T., Neugebauer G., 1999, Ap&SS, 266, 113
- Arnaud et al. (2005) Arnaud M., Pointecouteau E., Pratt G. W., 2005, A&A, 441, 893
- Ascasibar & Markevitch (2006) Ascasibar Y., Markevitch M., 2006, ApJ, 650, 102
- Baars et al. (1977) Baars J. W. M., Genzel R., Pauliny-Toth I. I. K., Witzel A., 1977, A&A, 61, 99
- Babul et al. (2012) Babul A., Sharma S. K., Reynolds J., 2012, MNRAS, submitted
- Beck & Krause (2005) Beck R., Krause M., 2005, Astronomische Nachrichten, 326, 414
- Beckwith et al. (2008) Beckwith K., Hawley J. F., Krolik J. H., 2008, ApJ, 678, 1180
- Bell (2003) Bell E. F., 2003, ApJ, 586, 794
- Belsole et al. (2007) Belsole E., Worrall D. M., Hardcastle M. J., Croston J. H., 2007, MNRAS, 381, 1109
- Benson & Babul (2009) Benson A. J., Babul A., 2009, MNRAS, 397, 1302
- Bildfell et al. (2008) Bildfell C., Hoekstra H., Babul A., Mahdavi A., 2008, MNRAS, 389, 1637
- Bîrzan et al. (2008) Bîrzan L., McNamara B. R., Nulsen P. E. J., Carilli C. L., Wise M. W., 2008, ApJ, 686, 859
- Blandford & Znajek (1977) Blandford R. D., Znajek R. L., 1977, MNRAS, 179, 433
- Blanton et al. (2011) Blanton E. L., Randall S. W., Clarke T. E., Sarazin C. L., McNamara B. R., Douglass E. M., McDonald M., 2011, ApJ, 737, 99
- Blanton et al. (2009) Blanton E. L., Randall S. W., Douglass E. M., Sarazin C. L., Clarke T. E., McNamara B. R., 2009, ApJ, 697, L95
- Bower et al. (2006) Bower R. G., Benson A. J., Malbon R., Helly J. C., Frenk C. S., Baugh C. M., Cole S., Lacey C. G., 2006, MNRAS, 370, 645
- Bridle & Perley (1984) Bridle A. H., Perley R. A., 1984, ARA&A, 22, 319
- Brunetti et al. (1997) Brunetti G., Setti G., Comastri A., 1997, A&A, 325, 898
- Canning et al. (2010) Canning R. E. A., Fabian A. C., Johnstone R. M., Sanders J. S., Conselice C. J., Crawford C. S., Gallagher J. S., Zweibel E., 2010, MNRAS, 405, 115
- Cattaneo & Best (2009) Cattaneo A., Best P. N., 2009, MNRAS, 395, 518
- Cavagnolo et al. (2010) Cavagnolo K. W., McNamara B. R., Nulsen P. E. J., Carilli C. L., Jones C., Birzan L., 2010, ApJ, 720, 1066
- Chandra et al. (2004) Chandra P., Ray A., Bhatnagar S., 2004, ApJ, 604, L97
- Churazov et al. (2001) Churazov E., Brüggen M., Kaiser C. R., Böhringer H., Forman W., 2001, ApJ, 554, 261
- Churazov et al. (2005) Churazov E., Sazonov S., Sunyaev R., Forman W., Jones C., Böhringer H., 2005, MNRAS, 363, L91
- Clarke et al. (2004) Clarke T. E., Blanton E. L., Sarazin C. L., 2004, ApJ, 616, 178
- Coble et al. (2007) Coble K., Bonamente M., Carlstrom J. E., Dawson K., Hasler N., Holzapfel W., Joy M., La Roque S., Marrone D. P., Reese E. D., 2007, AJ, 134, 897
- Combes et al. (2011) Combes F., García-Burillo S., Braine J., Schinnerer E., Walter F., Colina L., 2011, A&A, 528, A124
- Conselice et al. (2001) Conselice C. J., Gallagher III J. S., Wyse R. F. G., 2001, AJ, 122, 2281
- Crawford et al. (1999) Crawford C. S., Allen S. W., Ebeling H., Edge A. C., Fabian A. C., 1999, MNRAS, 306, 857
- Crawford et al. (2005) Crawford C. S., Sanders J. S., Fabian A. C., 2005, MNRAS, 361, 17
- Crawford & Vanderriest (1996) Crawford C. S., Vanderriest C., 1996, MNRAS, 283, 1003
- Croton et al. (2006) Croton D. J., Springel V., White S. D. M., De Lucia G., Frenk C. S., Gao L., Jenkins A., Kauffmann G., Navarro J. F., Yoshida N., 2006, MNRAS, 365, 11
- David et al. (2009) David L. P., Jones C., Forman W., Nulsen P., Vrtilek J., O’Sullivan E., Giacintucci S., Raychaudhury S., 2009, ApJ, 705, 624
- De Villiers et al. (2005) De Villiers J.-P., Hawley J. F., Krolik J. H., Hirose S., 2005, ApJ, 620, 878
- Donahue et al. (2010) Donahue M., Bruch S., Wang E., Voit G. M., Hicks A. K., Haarsma D. B., Croston J. H., Pratt G. W., Pierini D., O’Connell R. W., Böhringer H., 2010, ApJ, 715, 881
- Dubois et al. (2010) Dubois Y., Devriendt J., Slyz A., Teyssier R., 2010, MNRAS, 409, 985
- Dunn et al. (2010) Dunn R. J. H., Allen S. W., Taylor G. B., Shurkin K. F., Gentile G., Fabian A. C., Reynolds C. S., 2010, MNRAS, 404, 180
- Erlund et al. (2006) Erlund M. C., Fabian A. C., Blundell K. M., Celotti A., Crawford C. S., 2006, MNRAS, 371, 29
- Evans et al. (1998) Evans A. S., Sanders D. B., Cutri R. M., Radford S. J. E., Surace J. A., Solomon P. M., Downes D., Kramer C., 1998, ApJ, 506, 205
- Fabian & Crawford (1995) Fabian A. C., Crawford C. S., 1995, MNRAS, 274, L63
- Fabian et al. (2011) Fabian A. C., Sanders J. S., Allen S. W., Canning R. E. A., Churazov E., Crawford C. S., Forman W., Gabany J., Hlavacek-Larrondo J., Johnstone R. M., Russell H. R., Reynolds C. S., Salomé P., Taylor G. B., Young A. J., 2011, MNRAS, 418, 2154
- Fabian et al. (2003) Fabian A. C., Sanders J. S., Crawford C. S., Conselice C. J., Gallagher J. S., Wyse R. F. G., 2003, MNRAS, 344, L48
- Fabian et al. (2005) Fabian A. C., Sanders J. S., Taylor G. B., Allen S. W., 2005, MNRAS, 360, L20
- Fabian et al. (2006) Fabian A. C., Sanders J. S., Taylor G. B., Allen S. W., Crawford C. S., Johnstone R. M., Iwasawa K., 2006, MNRAS, 366, 417
- Forman et al. (2007) Forman W., Jones C., Churazov E., Markevitch M., Nulsen P., Vikhlinin A., Begelman M., Böhringer H., Eilek J., Heinz S., Kraft R., Owen F., Pahre M., 2007, ApJ, 665, 1057
- Forman et al. (2005) Forman W., Nulsen P., Heinz S., Owen F., Eilek J., Vikhlinin A., Markevitch M., Kraft R., Churazov E., Jones C., 2005, ApJ, 635, 894
- Gammie et al. (2004) Gammie C. F., Shapiro S. L., McKinney J. C., 2004, ApJ, 602, 312
- Garn et al. (2009) Garn T., Green D. A., Riley J. M., Alexander P., 2009, MNRAS, 397, 1101
- Giovannini et al. (2001) Giovannini G., Cotton W. D., Feretti L., Lara L., Venturi T., 2001, ApJ, 552, 508
- Giovannini et al. (1994) Giovannini G., Feretti L., Venturi T., Lara L., Marcaide J., Rioja M., Spangler S. R., Wehrle A. E., 1994, ApJ, 435, 116
- Grevesse & Sauval (1998) Grevesse N., Sauval A. J., 1998, Space Sci. Rev., 85, 161
- Hatch et al. (2007) Hatch N. A., Crawford C. S., Fabian A. C., 2007, MNRAS, 380, 33
- Hawley & Krolik (2006) Hawley J. F., Krolik J. H., 2006, ApJ, 641, 103
- Heckman et al. (1989) Heckman T. M., Baum S. A., van Breugel W. J. M., McCarthy P., 1989, ApJ, 338, 48
- Helmboldt et al. (2008) Helmboldt J. F., Kassim N. E., Cohen A. S., Lane W. M., Lazio T. J., 2008, ApJS, 174, 313
- Hicks et al. (2010) Hicks A. K., Mushotzky R., Donahue M., 2010, ApJ, 719, 1844
- Hines et al. (1999) Hines D. C., Schmidt G. D., Wills B. J., Smith P. S., Sowinski L. G., 1999, ApJ, 512, 145
- Hines & Wills (1993) Hines D. C., Wills B. J., 1993, ApJ, 415, 82
- Hlavacek-Larrondo et al. (2011) Hlavacek-Larrondo J., Fabian A. C., Edge A. C., Ebeling H., Sanders J. S., Hogan M. T., Taylor G. B., 2011, ArXiv e-prints
- Hoekstra (2007) Hoekstra H., 2007, MNRAS, 379, 317
- Hopkins (2012) Hopkins P. F., 2012, MNRAS, 420, L8
- Hopkins et al. (2005) Hopkins P. F., Hernquist L., Cox T. J., Di Matteo T., Martini P., Robertson B., Springel V., 2005, ApJ, 630, 705
- Iwasawa et al. (2001) Iwasawa K., Fabian A. C., Ettori S., 2001, MNRAS, 321, L15
- Jansen et al. (2001) Jansen F., Lumb D., Altieri B., Clavel J., Ehle M., Erd C., Gabriel C., Guainazzi M., Gondoin P., Much R., Munoz R., Santos M., Schartel N., Texier D., Vacanti G., 2001, A&A, 365, L1
- Johnstone et al. (1987) Johnstone R. M., Fabian A. C., Nulsen P. E. J., 1987, MNRAS, 224, 75
- Kalberla et al. (2005) Kalberla P. M. W., Burton W. B., Hartmann D., Arnal E. M., Bajaja E., Morras R., Pöppel W. G. L., 2005, A&A, 440, 775
- Kardashev (1962) Kardashev N. S., 1962, Soviet Astronomy, 6, 317
- Kennicutt (1998) Kennicutt Jr. R. C., 1998, ApJ, 498, 541
- Kirkpatrick et al. (2011) Kirkpatrick C. C., McNamara B. R., Cavagnolo K. W., 2011, ApJ, 731, L23+
- Kleinmann et al. (1988) Kleinmann S. G., Hamilton D., Keel W. C., Wynn-Williams C. G., Eales S. A., Becklin E. E., Kuntz K. D., 1988, ApJ, 328, 161
- Koide (2003) Koide S., 2003, Phys. Rev. D, 67, 104010
- Komissarov (2007) Komissarov S. S., 2007, MNRAS, 382, 995
- Kunert-Bajraszewska et al. (2010) Kunert-Bajraszewska M., Gawroński M. P., Labiano A., Siemiginowska A., 2010, MNRAS, 408, 2261
- Laganá et al. (2010) Laganá T. F., Andrade-Santos F., Lima Neto G. B., 2010, A&A, 511, A15
- Landau & Lifshitz (1959) Landau L., Lifshitz E., 1959, Fluid mechanics. Oxford: Pergamon Press
- Livio et al. (1999) Livio M., Ogilvie G. I., Pringle J. E., 1999, ApJ, 512, 100
- Maccarone et al. (2003) Maccarone T. J., Kundu A., Zepf S. E., 2003, ApJ, 586, 814
- Mahdavi et al. (2007) Mahdavi A., Hoekstra H., Babul A., Sievers J., Myers S. T., Henry J. P., 2007, ApJ, 664, 162
- McCarthy et al. (2011) McCarthy I. G., Schaye J., Bower R. G., Ponman T. J., Booth C. M., Dalla Vecchia C., Springel V., 2011, MNRAS, p. 35
- McCarthy et al. (2010) McCarthy I. G., Schaye J., Ponman T. J., Bower R. G., Booth C. M., Dalla Vecchia C., Crain R. A., Springel V., Theuns T., Wiersma R. P. C., 2010, MNRAS, 406, 822
- McDonald et al. (2011) McDonald M., Veilleux S., Mushotzky R., 2011, ArXiv e-prints
- McDonald et al. (2011) McDonald M., Veilleux S., Rupke D. S. N., Mushotzky R., Reynolds C., 2011, ApJ, 734, 95
- McKinney & Blandford (2009) McKinney J. C., Blandford R. D., 2009, MNRAS, 394, L126
- McNamara & Nulsen (2007) McNamara B. R., Nulsen P. E. J., 2007, ARA&A, 45, 117
- McNamara et al. (2005) McNamara B. R., Nulsen P. E. J., Wise M. W., Rafferty D. A., Carilli C., Sarazin C. L., Blanton E. L., 2005, Nature, 433, 45
- McNamara & O’Connell (1993) McNamara B. R., O’Connell R. W., 1993, AJ, 105, 417
- Meier (1999) Meier D. L., 1999, ApJ, 522, 753
- Meier (2001) Meier D. L., 2001, ApJ, 548, L9
- Morsony et al. (2010) Morsony B. J., Heinz S., Brüggen M., Ruszkowski M., 2010, MNRAS, 407, 1277
- Mushotzky & Szymkowiak (1988) Mushotzky R. F., Szymkowiak A. E., 1988, in A. C. Fabian ed., NATO ASIC Proc. 229: Cooling Flows in Clusters and Galaxies Einstein Observatory solid state detector observations of cooling flows in clusters of galaxies. p. 53
- Myers & Spangler (1985) Myers S. T., Spangler S. R., 1985, ApJ, 291, 52
- Narayan & Yi (1994) Narayan R., Yi I., 1994, ApJ, 428, L13
- Navarro et al. (1995) Navarro J. F., Frenk C. S., White S. D. M., 1995, MNRAS, 275, 720
- Navarro et al. (1997) Navarro J. F., Frenk C. S., White S. D. M., 1997, ApJ, 490, 493
- Nemmen et al. (2007) Nemmen R. S., Bower R. G., Babul A., Storchi-Bergmann T., 2007, MNRAS, 377, 1652
- Nulsen et al. (2005) Nulsen P. E. J., McNamara B. R., Wise M. W., David L. P., 2005, ApJ, 628, 629
- O’Dea et al. (2004) O’Dea C. P., Baum S. A., Mack J., Koekemoer A. M., Laor A., 2004, ApJ, 612, 131
- Oonk et al. (2011) Oonk J. B. R., Hatch N. A., Jaffe W., Bremer M. N., van Weeren R. J., 2011, MNRAS, 414, 2309
- Oonk et al. (2010) Oonk J. B. R., Jaffe W., Bremer M. N., van Weeren R. J., 2010, MNRAS, 405, 898
- Orienti et al. (2010) Orienti M., Murgia M., Dallacasa D., 2010, MNRAS, 402, 1892
- O’Sullivan et al. (2011) O’Sullivan E., Giacintucci S., David L. P., Gitti M., Vrtilek J. M., Raychaudhury S., Ponman T. J., 2011, ArXiv e-prints, 735, 11
- O’Sullivan et al. (2010) O’Sullivan E., Giacintucci S., David L. P., Vrtilek J. M., Raychaudhury S., 2010, MNRAS, 407, 321
- O’Sullivan et al. (2011) O’Sullivan E., Giacintucci S., David L. P., Vrtilek J. M., Raychaudhury S., 2011, MNRAS, 411, 1833
- O’Sullivan et al. (2007) O’Sullivan E., Vrtilek J. M., Harris D. E., Ponman T. J., 2007, ApJ, 658, 299
- O’Sullivan et al. (2011) O’Sullivan E., Worrall D. M., Birkinshaw M., Trinchieri G., Wolter A., Zezas A., Giacintucci S., 2011, MNRAS, p. 1180
- Owen & Laing (1989) Owen F. N., Laing R. A., 1989, MNRAS, 238, 357
- Owen & White (1991) Owen F. N., White R. A., 1991, MNRAS, 249, 164
- Pacholczyk (1970) Pacholczyk A. G., 1970, Radio astrophysics. Nonthermal processes in galactic and extragalactic sources. Series of Books in Astronomy and Astrophysics, San Francisco: Freeman, 1970
- Parma et al. (2007) Parma P., Murgia M., de Ruiter H. R., Fanti R., Mack K.-H., Govoni F., 2007, A&A, 470, 875
- Perley & Taylor (1999) Perley R. T., Taylor G. B., 1999, Technical report, VLA Calibrator Manual. NRAO
- Peterson & Fabian (2006) Peterson J. R., Fabian A. C., 2006, Phys. Rep., 427, 1
- Piconcelli et al. (2007) Piconcelli E., Fiore F., Nicastro F., Mathur S., Brusa M., Comastri A., Puccetti S., 2007, A&A, 473, 85
- Pipino et al. (2009) Pipino A., Kaviraj S., Bildfell C., Babul A., Hoekstra H., Silk J., 2009, MNRAS, 395, 462
- Poole et al. (2006) Poole G. B., Fardal M. A., Babul A., McCarthy I. G., Quinn T., Wadsley J., 2006, MNRAS, 373, 881
- Pratt et al. (2009) Pratt G. W., Croston J. H., Arnaud M., Böhringer H., 2009, A&A, 498, 361
- Punsly (2007) Punsly B., 2007, ApJ, 661, L21
- Punsly & Coroniti (1990) Punsly B., Coroniti F. V., 1990, ApJ, 350, 518
- Rafferty et al. (2006) Rafferty D. A., McNamara B. R., Nulsen P. E. J., Wise M. W., 2006, ApJ, 652, 216
- Randall et al. (2009) Randall S. W., Jones C., Markevitch M., Blanton E. L., Nulsen P. E. J., Forman W. R., 2009, ApJ, 700, 1404
- Rengelink et al. (1997) Rengelink R. B., Tang Y., de Bruyn A. G., Miley G. K., Bremer M. N., Roettgering H. J. A., Bremer M. A. R., 1997, A&A, 124, 259
- Riley et al. (1999) Riley J. M. W., Waldram E. M., Riley J. M., 1999, MNRAS, 306, 31
- Ruiz et al. (2010) Ruiz A., Miniutti G., Panessa F., Carrera F. J., 2010, A&A, 515, A99
- Russell et al. (2010) Russell H. R., Fabian A. C., Sanders J. S., Johnstone R. M., Blundell K. M., Brandt W. N., Crawford C. S., 2010, MNRAS, 402, 1561
- Russell et al. (2012) Russell H. R., Fabian A. C., Taylor G. B., Sanders J. S., Blundell K. M., Crawford C. S., Johnstone R. M., Belsole E., 2012, ArXiv e-prints
- Sanders & Mirabel (1996) Sanders D. B., Mirabel I. F., 1996, ARA&A, 34, 749
- Sanders & Fabian (2007) Sanders J. S., Fabian A. C., 2007, MNRAS, 381, 1381
- Sazonov et al. (2005) Sazonov S. Y., Ostriker J. P., Ciotti L., Sunyaev R. A., 2005, MNRAS, 358, 168
- Schawinski et al. (2009) Schawinski K., Virani S., Simmons B., Urry C. M., Treister E., Kaviraj S., Kushkuley B., 2009, ApJ, 692, L19
- Siemiginowska et al. (2010) Siemiginowska A., Burke D. J., Aldcroft T. L., Worrall D. M., Allen S., Bechtold J., Clarke T., Cheung C. C., 2010, ApJ, 722, 102
- Simionescu et al. (2009) Simionescu A., Werner N., Böhringer H., Kaastra J. S., Finoguenov A., Brüggen M., Nulsen P. E. J., 2009, A&A, 493, 409
- Sjouwerman et al. (2005) Sjouwerman L. O., Mioduszewski A. J., Greisen E. W., 2005, in J. Romney & M. Reid ed., Future Directions in High Resolution Astronomy Vol. 340 of Astronomical Society of the Pacific Conference Series, NRAO’s VLBA Data Calibration Pipeline. p. 613
- Smith et al. (2001) Smith R. K., Brickhouse N. S., Liedahl D. A., Raymond J. C., 2001, ApJ, 556, L91
- Tran et al. (2000) Tran H. D., Cohen M. H., Villar-Martin M., 2000, AJ, 120, 562
- Vignali et al. (2011) Vignali C., Piconcelli E., Lanzuisi G., Feltre A., Feruglio C., Maiolino R., Fiore F., Fritz J., Parola V. L., Mignoli M., Pozzi F., 2011, MNRAS, p. 1088
- Vikhlinin et al. (2006) Vikhlinin A., Kravtsov A., Forman W., Jones C., Markevitch M., Murray S. S., Van Speybroeck L., 2006, ApJ, 640, 691
- Voit & Donahue (1997) Voit G. M., Donahue M., 1997, ApJ, 486, 242
- Weisskopf et al. (2002) Weisskopf M. C., Brinkman B., Canizares C., Garmire G., Murray S., Van Speybroeck L. P., 2002, PASP, 114, 1
- Wise et al. (2007) Wise M. W., McNamara B. R., Nulsen P. E. J., Houck J. C., David L. P., 2007, ApJ, 659, 1153
- ZuHone et al. (2011) ZuHone J. A., Markevitch M., Lee D., 2011, ArXiv e-prints