The large area KX quasar catalogue: I. Analysis of the photometric redshift selection and the complete quasar catalogue††thanks: Based on observations made with ESO telescopes at the La Silla Paranal Observatory under programme IDs 083.A0360 and 085.A0359††thanks: Based on observations collected at the Centro Astronómico Hispano Alemán (CAHA) at Calar Alto, operated jointly by the Max-Planck Institut für Astronomie and the Instituto de Astrofísica de Andalucía (CSIC).
Abstract
The results of a large area, 600 deg2, -band flux-limited spectroscopic survey for luminous quasars are presented. The survey utilises the UKIRT Infrared Deep Sky Survey (UKIDSS) Large Area Survey (LAS) in regions of sky within the Sloan Digital Sky Survey (SDSS) footprint. The -band excess (KX) of all quasars with respect to Galactic stars is exploited in combination with a photometric redshift/classification scheme to identify quasar candidates for spectroscopic follow-up observations. The data contained within this investigation will be able to provide new constraints on the fraction of luminous quasars reddened by dust with 0.5 mag. The spectroscopic sample is defined using the -band, , and SDSS -band limits of 19.5, 19.7 and 22.0 over sky areas of 287, 150 and 196 deg2, respectively. The survey includes 3200 known quasars from the SDSS and more than 250 additional confirmed quasars from the KX-selection. A well-defined sub-sample of quasars in the redshift interval includes 1152 objects from the SDSS and 172 additional KX-selected quasars. The quasar selection is per cent complete with respect to known SDSS quasars and per cent efficient, largely independent of redshift and -band magnitude. The properties of the new KX-selected quasars confirm the known redshift-dependent effectiveness of the SDSS quasar selection and provide a sample of luminous quasars experiencing intermediate levels of extinction by dust. The catalogue represents an important step towards the assembly of a well-defined sample of luminous quasars that may be used to investigate the properties of quasars experiencing intermediate levels of dust extinction within their host galaxies or due intervening absorption line systems.
keywords:
quasars:general–surveys–infrared:general1 Introduction
The Sloan Digital Sky Survey (SDSS, York et al. 2000), with some ten thousand square degrees of simultaneous five-band imaging and extensive spectroscopic follow-up observations has revolutionised studies of optically-selected luminous quasars and active galactic nuclei (AGN).
Optical selection of quasars is highly effective at identifying large samples of quasars. Between the SDSS, the 2dF Quasar Redshift Survey (2QZ, Croom et al. 2004) and the 2dF-SDSS LRG and QSO Survey (2SLAQ, Croom et al. 2009), more than 150 000 spectroscopically confirmed quasars have been catalogued between redshifts . The 2QZ and 2SLAQ exploit the ultraviolet (UV) ‘excess’ shown by many quasars with respect to Galactic stars, and blue quasars with are confirmed with reasonable efficiency ( 50 per cent). However, at higher redshifts, intergalactic absorption shortward of the Ly emission line reduces the UV-excess signal. Quasars suffering from even a small amount of dust extinction, whether intrinsic to the quasar or due to intervening absorption systems, show reduced UV flux at all redshifts.
The SDSS improves on the UV-excess selection by employing multi-colour selection, choosing as quasar candidates objects with colours that are not consistent with the stellar locus (Richards et al. 2002). This has been shown to be effective at including quasars experiencing small to moderate amounts of dust extinction (Richards et al. 2003) and non-standard spectral energy distributions (SEDs, Hall et al. 2002). However, the selection suffers from significant incompleteness at redshifts , coincident with the peak in the space density of luminous quasars, where the SDSS colours of quasars and stars are indistinguishable. More importantly, in the context of the ability to undertake a census of objects experiencing moderate amounts of dust extinction, the SDSS quasar survey is flux-limited in the -band. The use of the redder -band represents a significant improvement on previous surveys with flux limits in the - or -bands. However, the significant reduction in flux, even in the observed-frame -band, due to the presence of dust with 0.2 mag means that the majority of any such population of quasars falls below the survey flux limit, with the fractional loss increasing rapidly with redshift.
Quasar selection at a variety of other wavelengths is also possible, each with strengths and weaknesses. Radio wavelengths are unaffected by dust obscuration, but only a small fraction ( 10 per cent) of all quasars are radio-loud, and thus are not representative of the general quasar population. Deep X-ray surveys are also less sensitive to dust obscuration, but are incapable of detecting quasars surrounded by large column densities of gas. As will be discussed in Section 7.3, the fraction of broad absorption line quasars (BALQSOs), which are faint in X-rays, may be as large as 40 per cent at certain redshifts and luminosities. The ROSAT Bright Survey (Schwope et al., 2000) covers a large fraction of the sky, but is too shallow to allow an effective census of quasar activity. The upcoming eROSITA (Cappelluti et al., 2011) mission, an all-sky imaging survey aiming to catalogue up to three million AGN, is promising but spectroscopic follow-up observations will still be required to confirm the quasar identifications.
Space-based long-wavelength infrared (IR) observations cover large areas to interesting depths, but limited angular resolution and the difficulty of distinguishing objects with significant AGN activity from among the much more numerous and heterogeneous starburst-dominated sources remains a challenge when attempting to compile large catalogues of objects. Space-based near-infrared (NIR) surveys, notably the Wide-field Infrared Survey Explorer (WISE; Wright et al. 2010), offer enormous promise but currently exploitation is at a very early stage.
Ground-basesd observations at NIR wavelengths hold several advantages over those described above. First, the effects of dust obscuration are greatly diminished in the NIR with respect to optical wavelengths. Second, large areas of sky can be covered to magnitude depths rivalling optical surveys. Finally, as will be shown in Section 3.1, all known types of quasars exhibit a straightforward NIR excess, enabling their selection irrespective of the details of the restframe UV through optical SED.
The Two Micron All Sky Survey (2MASS, Skrutskie et al. 2006), with observations in the , and bands, essentially covers the entire sky, but the bright magnitude limits restrict detections to either the local Universe or the very brightest objects. The almost complete UKIRT Infrared Deep Sky Survey (UKIDSS, Lawrence et al. 2007) aims to cover 7500 deg2 to , i.e. nearly three magnitudes deeper than 2MASS, and forms the basis for the investigation of the quasar population described here. Specifically, our goal is to undertake a survey of sufficient sky area, reaching a flux limit adequate to provide new constraints on the intrinsic frequency of quasars experiencing dust extinctions up to 0.5 mag, as well as the presence of quasars with intrinsically red UV through optical SEDs. The sub-types of quasars anticipated to be found in such a large-area, NIR-selected survey are outlined in the following sub-sections.
1.1 Red and reddened quasars
Quasars exhibit red colours either due to an intrinsically red continuum, or, because of the presence of dust along the line of sight. In the case of dust extinction, the observed shape of the quasar SED is altered due to the wavelength-dependent reduction of flux, with shorter wavelengths more affected. The change of SED shape, as well as the loss of flux, can both lead to quasars being excluded from existing catalogues. The dust can either be intrinsic to the quasar and host galaxy, or external to the system along the line of sight; both cases lead to similar observational effects. The present study is sensitive to both red and dust-reddened quasars provided the spectra still show evidence of broad emission lines.
The debate regarding the fraction of dust-reddened quasars currently missing from optical surveys is ongoing. Previous work by Maddox et al. (2008), as described in Section 3.1, estimated the fraction of luminous dust-reddened quasars to be 20 per cent, although the area covered by that survey was relatively small. The fraction is larger than the 15 per cent estimated from the SDSS quasars (Richards et al., 2003), but significantly less than the large fractions claimed from other studies (e.g. White et al. 2003, for example).
Other recent work searching for dust-reddened quasars has focused on selection of candidates at wavelengths other than the strongly affected optical. The FIRST–2MASS Red Quasar Survey (Glikman et al., 2007) selects radio-loud objects matched to 2MASS, and then requires very faint optical magnitudes to be considered a red quasar candidate for follow-up optical and NIR spectroscopy. The study is hampered by the bright NIR magnitude limit of and highly uncertain estimates, making the estimates of the reddened fraction of 25–60 per cent also uncertain. Deeper NIR imaging is required to properly sample the general quasar population instead of only the very brightest subset.
1.2 Broad absorption line quasars
It is well established that BALQSOs show signs of intrinsic dust reddening greater than that of the general quasar population (Reichard et al. 2003, Dai, Shankar, & Sivakoff 2008, Gibson et al. 2009, for example). Thus BALQSOs are underrepresented in the optical quasar surveys within which they are identified. In addition to the dust reddening, BALQSO SEDs are characterised by large sections of almost completely absent flux, altering their photometric properties in a non-uniform way.
Attempts have been made to determine the intrinsic fraction of BALQSOs within the general quasar population, but these efforts are hampered by the selection effects of the underlying catalogues on which the studies are based, which affect the BALQSOs and nonBALs differently. Recently, Allen et al. (2011) have performed extensive analysis on the SDSS DR6 quasar catalogue, investigating the selection algorithm and its effect on the determination of the intrinsic BALQSO fraction. The Allen et al. study found the intrinsic fraction of BALQSOs, using the classical balnicity index, (BI, Weymann et al. 1991), to be as high as 415 per cent. The study also found evidence of evolution of the BALQSO fraction with redshift, which would not be explained by simple orientation effects. However, this result remains somewhat uncertain due to the large completeness corrections dependent on redshift, colour and luminosity that affect the parent SDSS quasar sample.
Constructing the quasar sample at NIR-wavelengths, less affected by both the dust intrinsic to the BALQSOs and the loss of flux at UV and optical wavelengths due to the absorption troughs, will greatly assist the determination of the intrinsic BALQSO fraction.
1.3 Quasars with dusty intervening absorbers
There are many hundreds of high redshift () quasars that have absorption signatures from large neutral gas column density (cm-2) foreground objects imposed on their spectra. The chemical composition of these Damped Lyman alpha (DLA) intervening absorption systems has been extensively studied, but their dust content remains poorly constrained.
The debate regarding the fraction of DLA invervening absorption systems that remain undetected due to intrinsic dust causing the background quasar to fall below the flux limit of optically selected samples is ongoing. Results from a radio-selected sample of quasars indicate that optical selection underestimates the number of DLAs due to dust bias by at most a factor of two (Ellison et al., 2001). However, the radio sample is small and the constraints are not tight.
Employing a sample of probable DLAs selected via detection of CaII (H & K) absorption in SDSS quasar spectra, dust reddening in the underlying quasar spectra with 0.1 has been detected (Wild & Hewett 2005, Wild, Hewett, & Pettini 2006). Based on the distribution of values and the corresponding detection probabilities, the fraction of systems missed due to the dust bias is estimated to be as large as 40 per cent, but still consistent with the estimates from the radio-selected study.
The CaII-based absorption system investigation focussed on relatively low redshifts, whereas, at higher redshifts , it is clear that the observed sample of DLAs shows no evidence for dust reddening (Frank & Péroux, 2010). Making progress towards establishing whether a significant fraction (some tens of per cent) of DLA systems at high redshifts also show evidence for modest amounts of dust extinction requires a flux-limited quasar sample at NIR wavelengths, where the bias against including such systems is greatly reduced.
1.4 Quasars Selected at NIR wavelengths
The current work is an extension of a previous programme described in Maddox et al. (2008). The goal is to exploit the -band excess shown by all quasars, irrespective of redshift and the amount of dust-reddening, to construct a more complete quasar catalogue for redshifts . Exploring areas of sky previously surveyed by the SDSS greatly reduces the amount of new observations required. The project is unique as it represents the first large-area survey of quasar candidates selected by photometric redshift techniques with uniform spectroscopic follow-up observations to confirm the quasar identifications.
The outline of the paper is as follows. Section 2 describes the data used for the study, Section 3 details the selection of quasar candidates, Section 4 describes the spectroscopic observations. The KX Quasar Catalogue is described in Section 5, while an evaluation of the quality of the quasar selection algorithm is given in Section 6. Section 7 describes some of the properties of the KX-selected quasars, and a discussion of the results is given in Section 8. For the interested reader, the completeness of the candidate list with respect to the input data and how it affects the effective area of the survey is discussed in the Appendix. Concordance cosmology with km s-1 Mpc-1, and is assumed throughout. Magnitudes on the Vega system are used throughout the paper, as the UKIDSS magnitudes are based on this system. The SDSS AB-magnitudes are converted to the Vega system using the relations: , , , , and , as described in Hewett et al. (2006). Unless otherwise specified, the PSF magnitudes are used for the SDSS bands, and the aperture corrected aperMag3 magnitudes are used for the WFCAM bands.
2 Input Optical and NIR Data
The optical data, including photometry and spectroscopy, are taken from the SDSS Data Release 7 (DR7, Abazajian et al. 2009). The NIR photometric data are provided by the UKIDSS Data Release 4 (DR4) Large Area Survey (LAS), which contains 900 deg2 of coverage in the filter set described in Hewett et al. (2006). The throughput of the filters can be seen in Fig. 7 of Chiu et al. (2007). The UKIDSS LAS reaches 5-depths of , , , and , i.e. approximately three magnitudes deeper than 2MASS. As the LAS lies within the SDSS footprint, each detected object will potentially possess photometry plus extensive morphological information and, for a subset of targets, SDSS spectroscopic observations.
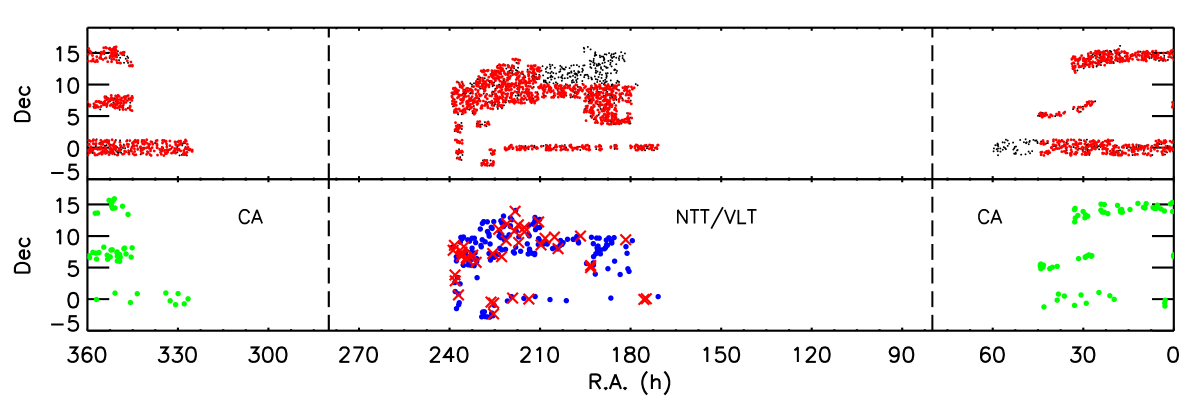
The area of sky covered by the overlap of SDSS DR7 and UKIDSS LAS DR4, along with the regions from which KX-survey candidates were chosen, are shown in the top panel of Fig. 1. The data are located in two distinct regions of the sky, hereinafter referred to as the NTT/VLT region and the CA region, as labelled in the figure.
The reference list of spectroscopically confirmed SDSS quasars used extensively in this work is the published SDSS DR7 quasar catalogue of Schneider et al. (2010), which contains 105 783 unique objects, supplemented by the list compiled by Hewett & Wild (2010)111http://www.sdss.org/dr7/products/value_added/index.html, containing 107 194 entries. Object redshifts are taken from the Hewett & Wild (2010) catalogue and the sample of 107 194 quasars/AGN is herein referred to as the enhanced SDSS DR7 quasar catalogue.
3 Quasar Candidate Selection
This section details the principles and techniques used to construct the list of quasar candidates for further spectroscopic observations. Analysis of the performance of the candidate selection is presented in Section 6, and details regarding the input catalogues that affect the completeness of the resulting candidate list are presented in Appendix A.
3.1 -band Excess of Quasars
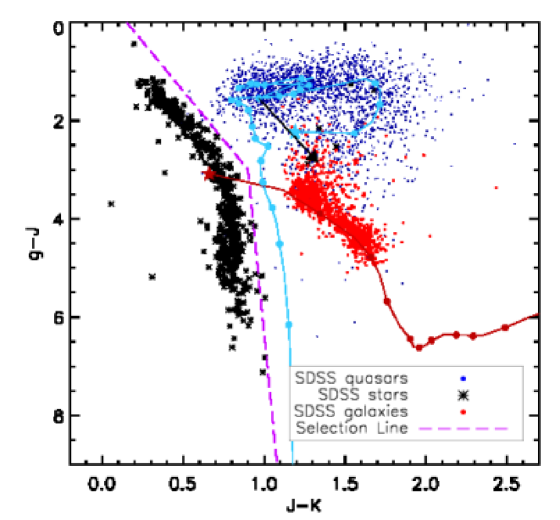
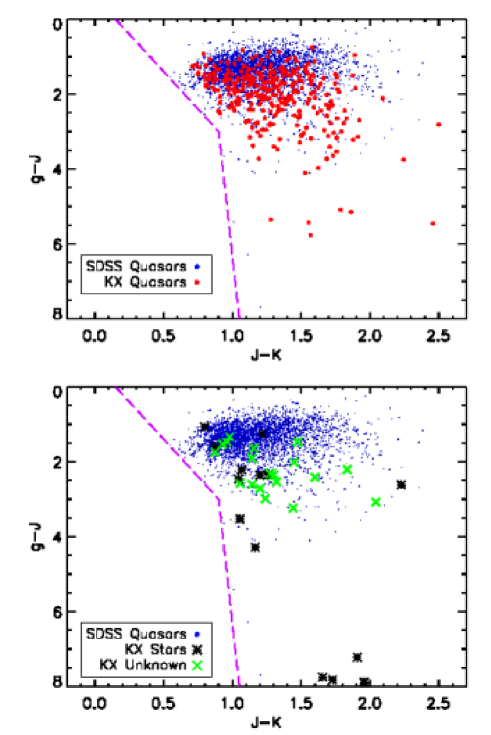
The principle of utilising the -band excess of quasars with respect to Galactic stars for quasar selection was introduced in Warren, Hewett, & Foltz (2000). The key features of the -band excess (KX) quasar selection are illustrated in Fig. 2. For this figure, spectroscopically confirmed quasars, galaxies and stars were extracted from the SDSS database and matched to the UKIDSS LAS. Each population was restricted to , and the galaxies were restricted to , for clarity within the plot. The quasars span the redshift interval .
The quasars show a clear -band excess in their colours with respect to stars at all redshifts and, importantly, the effect of dust reddening increases the separation, as shown by the black arrow in the figure. The overlap within the colour-space between quasars and low redshift galaxies can be resolved using morphological information when targetting quasars with redshifts such that host galaxies are not detected in the images.
There have been a number of studies employing KX selection of quasar candidates over small ( 1 deg2) areas (for example, Sharp et al. 2002, or more recently, Smail et al. 2008) but our primary goal is to utilise the technique to examine the properties of intrinsically luminous quasars where a large survey ares is required due to their low surface density on the sky (tens of objects per square degree).
The first large area study employing KX selection of quasars was undertaken by Maddox et al. (2008, hereinafter ‘the Pilot KX Survey’), which covered 13 square degrees. Aside from a -band magnitude restriction, the only criterion required for selection as a KX candidate was a position on the plane rightward of a selection line similar to that shown in Fig. 2. In addition to recovering known SDSS quasars, a number of quasars not selected by the SDSS algorithm were observed. These objects included low-redshift quasars with substantial contamination from their host galaxies, high-redshift BALQSOs, and quasars at , where the SDSS selection algorithm is highly incomplete. The aim of the current study is to build on the information gained from the Pilot KX Survey to further improve the candidate selection and increase the area covered by more than an order of magnitude.
3.2 Photometric Redshifts
Photometric redshift (Photo-) algorithms aim to determine the identification and redshift of an object based primarily on broad band photometry, without the use of time consuming spectroscopy. Much effort has been focused on Photo- development in recent years due to the large area, deep, multi-wavelength imaging surveys that have become available or are in the final planning stages. The large number of objects and their faint magnitudes make follow-up spectroscopy unrealistic, leaving Photo- as the only viable alternative for object classification and redshift determination.
In their simplest form, Photo- algorithms attempt to determine both the identification and redshift of an input object by comparing the observed photometry to synthetic photometry from a set of either model or template SEDs. The identification and redshift are found by determining the best match between the observed and synthetic photometry. Although Photo- is conceptually straightforward, achieving accurate, precise and reliable results is difficult.
Several different Photo- algorithms are freely available, with varying levels of complexity, such as Hyperz, (Bolzonella, Miralles, & Pelló, 2000), and EAZY, (Brammer, van Dokkum, & Coppi, 2008). Most concentrate on identifying galaxies, exploiting in particular the distinctive 4000Å-break spectral feature characteristic of old stellar populations.
There are studies focusing on Photo- for quasars (Hatziminaoglou, Mathez, & Pelló 2000, Richards et al. 2009 and references therein) but the results are generally not as good as those for galaxies due to the lack of strong spectral features in the power-law quasar spectrum over large ranges of redshift. At , the quasar host galaxy can also complicate Photo- identification by contributing significant galaxy-flux to the quasar SED.
3.3 The NIR Photo- Algorithm
The Photo- algorithm used to select candidates for the present study (hereinafter referred to as the NIR Photo-) was custom-made for this project and is relatively simple when compared to the more complex Photo- algorithms recently released. Within the NIR Photo-, the ‘identification’ and ‘redshift’ are determined using straightforward minimisation between the observed photometry and synthetic photometry derived from model and template SEDs and the passbands. However, the NIR Photo- holds two advantages over previous quasar Photo- efforts. The first is the use of optical–NIR photometry afforded by the overlapping areas of SDSS and UKIDSS. As described in Section 3.1, the combination of optical and NIR colours allows the effective discrimination between stars and quasars at all redshifts due to the excess of -band flux shown by quasars.
The second advantage is the high-quality quasar models employed. Eleven model quasars, with a variety of SED properties were used within the NIR Photo-. The base-model is the unreddened, ‘standard’ model, quasar described in Section 2.4 of Maddox et al. (2008). Seven reddened models were created, taking the base-model, reddened with increasing amounts of SMC-type dust covering the interval . In addition, models with emission line strength twice that of the standard model, combined with both the standard and a redder continuum slope ( and , respectively, for Å), as well as a particularly blue model () with no emission lines were incorporated into the NIR Photo-. Experiments were conducted to ascertain whether a larger range of quasar SED properties improved the performance of the redshift determinations but no significant gain was found from the addition of further models.
To identify morphologically compact galaxies and remove them from further consideration, seven galaxy templates, spanning E through Scd types, were used. The E through Sc templates are from Mannucci et al. (2001), while the Sbc and Scd galaxy values are from Coleman, Wu, & Weedman (1980). The quasar models and galaxy templates were employed to generate synthetic colours for redshift increments of , over the intervals for quasars and for galaxies, although due to the relatively bright magnitude limits, galaxy templates at redshifts of were never found to be chosen as the best solution for any objects.
Star templates, from the Bruzual-Persson-Gunn-Stryker atlas, were also incorporated. The atlas is unpublished, but can be found at http://www.stsci.edu/hst/observatory/cdbs/bpgs.html.
3.4 Final Quasar Candidate Selection
The following steps are involved in creating the final quasar candidate list from the initial optical and NIR photometry data. First, objects with stellar morphological classification as determined by the UKIDSS data reduction pipeline, and have detections in all four passbands covering the area in the sky shown in Fig. 1 are selected from the LAS DR4 database via the WFCAM Science Archive (WSA, Hambly et al. 2008) SQL query interface. The resulting data from this query are crossmatched to the SDSS DR7 database (PhotoObjAll, SpecObjAll and Photoz tables). Only the nearest neighbour within a pairing radius of 1 was retained, as the astrometric consistency between the SDSS and UKIDSS is better than (Chiu et al., 2007). The crossmatched UKIDSS LAS and SDSS data produced a list of objects that possess magnitudes, morphology information, and for subsets of objects, SDSS spectra and SDSS Photo- results. Objects detected in the UKIDSS NIR bands but not in the SDSS optical bands, and thus have very red colours, are not included in the current study.
The sample is initially restricted to , as extending to fainter magnitudes not only increases the photometry errors (and thus reduces the effectiveness of the NIR Photo- routine), but also makes the optical spectroscopic follow-up more difficult. In addition, with a brighter -band limit, objects that are faint in the optical must have very red optical–NIR colours. This puts strong constraints on the range of possible identifications available, even if no identification is made from the spectrum.
Candidates lying leftward of the selection boundary in the -space, illustrated in Fig. 5, are discarded. Less than one per cent of the SDSS DR7 quasars crossmatched to UKIDSS lie to the left of the selection line. The small percentage of quasars removed by application of the criterion will, by definition, be blue in , and are thus extremely unlikely to possess red restframe optical SEDs. The benefit of the KX-selection is evident from the elimination of the vast majority of Galactic stars with more than 90 per cent of all cross-matched UKIDSS-SDSS stellar objects removed in a single step.
Extensive effort has been devoted to the assignment of reliable photometric redshifts to low-redshift galaxies within the SDSS (Csabai et al. 2003; Oyaizu et al. 2008; Cunha et al. 2009). Objects identified as galaxies with an SDSS Photo- in SDSS DR7 were removed next.
At this stage, all cross-matched objects with properties consistent with main-sequence stars or resolved galaxies have been removed, leaving just apparently stellar objects to the right of the selection boundary in -space. The list of such objects with is run through the NIR Photo- routine, producing lists of probable galaxies, stars, and quasar candidates. The probable galaxies and stars are removed from further consideration. The NIR Photo- code was tested on the full Pilot KX Survey catalogue of objects to ensure the robustness of the quasar, star and galaxy classifications. The performance of the routine for identifying all three classes of objects was found to be very good.
The list of quasar-candidates constitutes the primary sample to be used to investigate the properties of objects identified via the use of NIR-photometry that eluded the SDSS quasar selection. To ensure the most efficient use of follow-up spectroscopic observations, two subsets of candidates are flagged as ‘not to be followed-up spectroscopically’. First, objects with SDSS spectra are removed, as their identification is already known. Second, objects with SDSS spectroscopic quasar-target flags set, but no spectroscopic observations, are also removed. This restriction is discussed further in Section 5.4. Both sub-samples form part of the final quasar catalogue.
The large number of relatively low-redshift quasar candidates are removed by restricting the sample to . The decision ensures that potential complications arising from quasar host galaxies do not impact on the completeness of the flux-limited NIR-selected quasar sample. At low redshifts, not only can the colours of the candidates be altered by the combination of quasar+host galaxy flux, but the -band flux from the galaxy can artificially boost the quasar+host system brighter than the flux limit. These issues can be problematic at significant () redshifts for a sample (Maddox & Hewett 2006). Most importantly, given the restriction of the cross-matched UKIDSS-SDSS sample to ‘stellar’ objects, the selection ensures that genuine quasars are not systematically excluded due to the visibility of their host galaxies in the NIR images. From a practical perspective the application of the criterion ensures that the resulting sample of quasars is dominated by relatively high redshift objects which possess longer path-lengths for the occurence of intervening absorption systems.
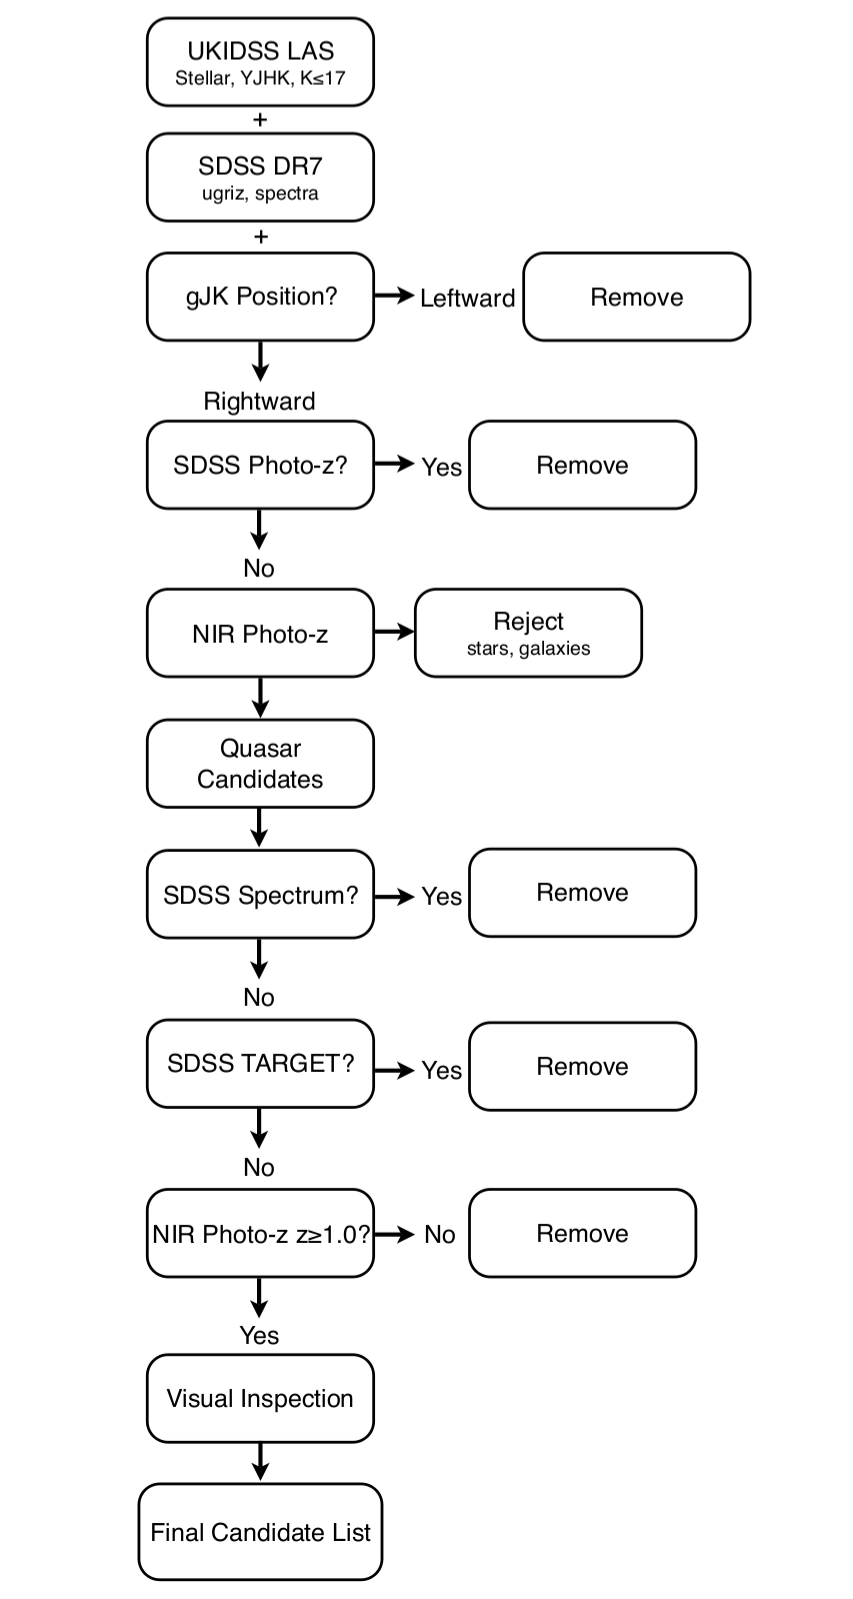
Finally, after all of these restrictions have been implemented, the SDSS images of the quasar candidates are visually inspected to remove objects whose photometry has been compromised, for example, by nearby bright stars. There are a number of these in the survey area, and their removal reduces the effective area by a small percentage, as discussed in the Appendix. A flow-chart describing the quasar candidate selection procedure is shown in Fig. 3.
4 New Spectroscopic Observations
In order to maximise the dynamic range of the survey in absolute magnitude at fixed redshift, while ensuring adequate sampling of the brightest quasars, a ‘wedding cake’ survey geometry is adopted. Thus, the entire survey area is complete to the brightest limits, with a smaller sub-region complete to fainter magnitudes and the smallest sub-region complete to the faintest limits.
| Date | Telescope | Spectrograph | Grism | Slit Width (”) | Wavelength Range (Å) | Resolution (R) |
|---|---|---|---|---|---|---|
| 11–15 May 2009 | NTT | EFOSC2 | Grism #11 | 1.0, 1.2 | 816–1845 | |
| May–June 2009 | VLT | FORS | GRIS_300V+10 | 1.6 | 1220–2930 | |
| 19–27 Aug 2009 | CA 2.2m | CAFOS | blue-200 | 1.5, 2.0 | 710–1830 | |
| 19–27 Aug 2009 | CA 2.2m | CAFOS | green-200 | 1.5, 2.0 | 1040–2180 | |
| 31 Aug – 02 Sept 2009 | CA 3.5m | MOSCA | green-500 | 1.5 | 1450–3450 | |
| April–July 2010 | VLT | FORS | GRIS_300V+10 | 1.3 | 1120–2670 |
Observations of the survey area utilised four telescopes over three observing semesters between 2009 May – 2010 July. As the candidates span six magnitudes in the -band, smaller telescopes were used for the optically bright objects and an 8-metre class telescope was employed for the much less numerous NIR-bright but optically faint objects.
Observations of the optically bright candidates located at RA (NTT/VLT region) were carried out with the EFOSC2 spectrograph (Buzzoni et al., 1984) on the New Technology Telescope (NTT) at La Silla observatory, and those at RA or RA (CA region) were observed with the CAFOS spectrograph on the 2.2m telescope and MOSCA on the 3.5m telescope at Calar Alto observatory.
The optically faint candidates in the NTT/VLT region were observed with the FORS instrument on the European Southern Observatory (ESO) Very Large Telescope (VLT) UT1 in service mode. The fainter candidates were only observed in this region. Fig. 1 shows the location of the observed candidates and Table 1 lists the details of the observations. Moderate resolution spectra () were obtained, generally sufficient for object identification. In total, 324 candidates were observed, and the total area of all the regions surveyed is 633 square degrees. The effective area surveyed, accounting for area missed due to bad photometry, among other effects, is 567.0 square degrees, and is described in the Appendix.
4.1 Magnitude and Redshift Limits
The completeness limits for the entire area are and . For the NTT/VLT region at RA 210, the completeness limits are and , and for RA 210 (hereinafter referred to as the NTT/VLT Deep region), they are and . The increased -band depth at RA 210 is because more faint targets were observed by the VLT within this area. It is worth noting that this faint -band magnitude limit is nearing the detection limit of the SDSS photometry, and the NTT/VLT Deep region is still nearly 200 square degrees in size.
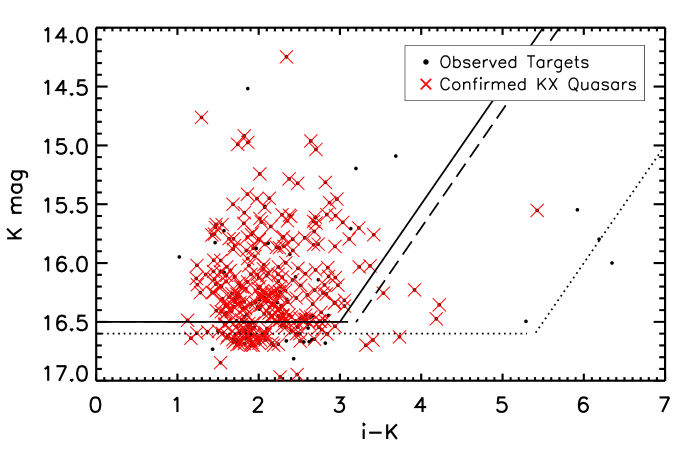
The -band magnitude and colour limits are shown in Fig. 4, and a summary of the three regions with their respective sizes in square degrees and magnitude limits is listed in Table 2. Some, but not all, of the available targets with magnitudes fainter than the limits listed in Table 2 were observed. These objects are included in the full KX-selected quasar catalogue described in Section 5.
The bright magnitude limits are and . Only one candidate is removed by these restrictions, and it is very unlikely that a candidate with is a quasar at , as quasars of this bright luminosity are intrinsically very rare. Inspection of the SDSS DR7 quasar catalogue crossmatched to UKIDSS DR7 shows that of 20148 quasars with , there are only 11 with .
The redshift range over which the catalogue is complete is . The low redshift cutoff was implemented in the candidate selection, and the high redshift limit is determined from the completeness investigation in Section 6.1, where it is found that the completeness of the NIR Photo- selection drops rapidly at .
| Region | Area | -band | -band |
|---|---|---|---|
| (deg2) | Range | Range | |
| CA | 286.6 | ||
| NTT/VLT | 150.1 | ||
| NTT/VLT Deep | 196.4 |
4.2 Data Reduction and Object Classification
Reduction of the spectra was performed using standard IRAF222IRAF is distributed by the National Optical Astronomical Observatories, which are operated by the Association of Universities for Research in Astronomy, Inc., under cooperative agreement with the National Science Foundation tasks. The spectra were flux calibrated from observations of standard stars taken at the beginning or end of each observing night with appropriate grism and slit width combinations. The standard star observations were only sufficient to determine a relative flux calibration (i.e. the shape of the spectra were corrected but the normalisation was only approximate). Comparison between the computed spectrophotometric magnitudes and the known optical magnitudes confirmed that an offset correction was required, but that the overall shape of the flux calibrated spectra was consistent with the optical colours to within a few tenths of a magnitude.
The reduced, flux calibrated and Galactic extinction corrected spectra are individually classified by hand, assigning each object an identification of either quasar, emission line galaxy, absorption line galaxy, star, or unclassified. The numbers of each class of object are listed in Table 3, and the location of the quasars, stars, and unclassified objects is shown in Fig. 5. Redshifts were assigned interactively by displaying the spectrum and identifying emission or absorption features. Table 4 gives the column description for the catalogue of new spectroscopically observed objects, including the classification and a measure of the confidence of the classification. The catalogue is available in the online version of the paper.
The identification-redshifts are accurate to typically and no correction has been made for the systematic emission line shifts known to affect quasar redshift determinations (Hewett & Wild, 2010). Such velocity shifts change the redshift estimates by 10-3, smaller than the uncertainty in the redshift determinations from the visual identification process. If further refinement in the redshift estimate is required, the catalogue records the emission line from which the redshift was computed.
No distinction is made here between lower luminosity AGN and high luminosity quasars, which for consistency with the SDSS quasar catalogue has been set at M333Recall that all magnitudes quoted in this work are on the Vega system.. In practice all the confirmed broad-line objects have absolute magnitudes brighter than M and are thus classified as quasars according to the SDSS convention.
| Class | Number | Percent |
|---|---|---|
| Quasars | 284 | 87.7 |
| Emission line galaxies | 2 | 0.6 |
| Absorption galaxies | 5 | 1.5 |
| Stars | 14 | 4.3 |
| Unclassified | 19 | 5.9 |
| Total | 324 | 100 |
| Column | Format | Description |
|---|---|---|
| 1 | A8 | Unique KX Catalogue ID |
| 2 | F12.6 | Right ascension in decimal degrees (J2000) |
| 3 | F12.6 | Declination in decimal degrees (J2000) |
| 4 | F9.6 | SDSS -band magnitude, converted to Vega, corrected for Galactic extinction |
| 5 | F9.6 | SDSS -band magnitude, converted to Vega, corrected for Galactic extinction |
| 6 | F9.6 | SDSS -band magnitude, converted to Vega, corrected for Galactic extinction |
| 7 | F9.6 | SDSS -band magnitude, converted to Vega, corrected for Galactic extinction |
| 8 | F9.6 | SDSS -band magnitude, converted to Vega, corrected for Galactic extinction |
| 9 | F9.6 | UKIDSS -band magnitude, corrected for Galactic extinction |
| 10 | F9.6 | UKIDSS -band magnitude, corrected for Galactic extinction |
| 11 | F9.6 | UKIDSS -band magnitude, corrected for Galactic extinction |
| 12 | F9.6 | UKIDSS -band magnitude, corrected for Galactic extinction |
| 13 | F9.6 | SDSS -band magnitude error |
| 14 | F9.6 | SDSS -band magnitude error |
| 15 | F9.6 | SDSS -band magnitude error |
| 16 | F9.6 | SDSS -band magnitude error |
| 17 | F9.6 | SDSS -band magnitude error |
| 18 | F9.6 | UKIDSS -band magnitude error |
| 19 | F9.6 | UKIDSS -band magnitude error |
| 20 | F9.6 | UKIDSS -band magnitude error |
| 21 | F9.6 | UKIDSS -band magnitude error |
| 22 | I1 | Region flag |
| 23 | F9.6 | Spectroscopic redshift |
| 24 | F9.6 | NIR Photo-z Photometric redshift |
| 25 | I1 | Classification |
| 26 | I1 | Confidence of classification |
| 27 | A7 | Identified Spectral Feature |
| 28 | A20 | SDSS Object ID |
| 29 | A12 | UKIDSS WSA Object ID |
| 30 | A3 | Comment |
4.3 Spectroscopic Completeness
Of the 324 spectra, only 19 remain without identification. The spectra have no classification primarily due to a lack of identifiable spectral features rather than low signal-to-noise ratio (S/N).
The unclassified objects have similar distributions as the general KX object population in their - and -band magnitudes, as well as their photometric redshifts. The bottom panel of Fig. 5 shows the location of the unclassified objects in the plane with respect to the other objects. The bluest objects are in the same area as several quasars, but also some stars, and the reddest objects are in the area of low redshift star-forming galaxies.
While definitive classifications are not possible for the 19 spectra, it is possible to eliminate a range of potential identifications. The lack of evidence for a 4000 Å break in the spectra rules out compact absorption line galaxies at , and at redshifts greater than this the objects would be implausibly bright, given the flux limits. Additionally, the H, [O iii] 5008 Å and [O ii] 3728 Å emission lines would be visible in star-forming galaxies to 0.1, 0.45 and 0.9, respectively. The absence of narrow emission lines in the spectra, with the possible exception of two objects, KXu_0009 and KXu_0013, disfavours identification as emission line galaxies.
The absence of a Lyman- break in the spectra indicate that all the unidentified objects are at . Many of the spectra show structure in their continua, which could be due to the presence of [Fe ii] and [Fe iii] emission in quasars, particularly in the redshift interval , that possess relatively weak broad emission lines. Such objects are not uncommon and a number of objects with weak emission lines and/or unusual iron emission within the SDSS spectroscopic database have recently been catalogued by Meusinger et al. (2012).
Tentative ‘identifications’ have been included in the comment column in Table 4 for the 19 objects: ‘?’ (unknown); ‘g?’ (galaxy?); ‘q?’ (quasar?); ‘q z?’ (quasar with unknown redshift). More reliable identifications will require spectra with higher S/N.
The fraction of unidentified objects is small, just 6 per cent, and the statistics quoted for the success rate of the KX-selection and the effective area of the survey are given assuming that none of the 19 unidentified spectra are quasars with . In practice we estimate that half the unidentified objects are quasars, in which case the relevant statistics for the success rate of the KX survey will improve slightly.
5 KX-Selected Quasar Catalogue
In addition to the newly acquired spectra, there exist already extensive spectroscopic observations within the survey area. The SDSS, 2SLAQ, as well as the Pilot KX Survey, overlap with the area covered by the new observations. The individual candidate selection criteria that were employed for each of the four spectroscopic surveys differ, but the NIR Photo- selection algorithm is applied to all sources uniformly. The final KX-selected quasar catalogue (or KX catalogue for brevity) is composed of all objects selected as quasar candidates by the NIR Photo- algorithm that are spectroscopically confirmed as quasars by any of the above-mentioned four surveys.
All quasars that satisfy the selection outlined in Section 3.4 are hereinafter referred to as ‘KX-selected quasars’, while objects that are identified as quasar candidates only by the NIR Photo- and are subsequently confirmed as quasars are referred to as ‘KX-only quasars’.
5.1 KX-Only Quasars
As listed in Table 3, 284 new KX-only quasars were identified. However, as seen in Fig. 4, many of the quasars are fainter than the completeness magnitude limits. There were also a number of quasars for which, although they possessed a , their spectroscopic redshift is . These objects will be excluded from the statistically complete sample.
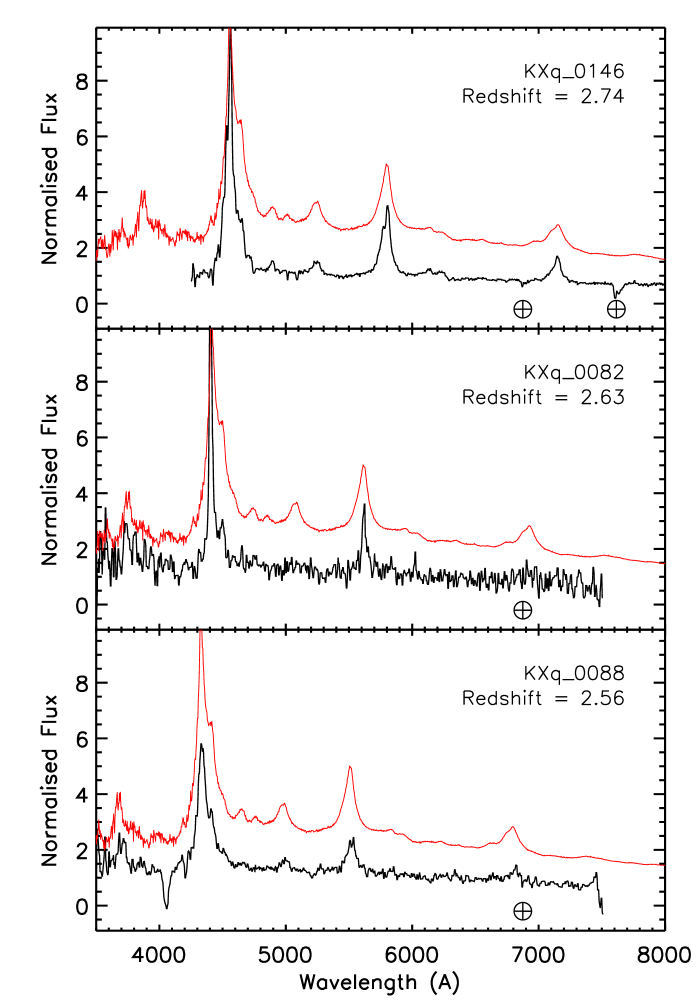
Figs. 6 and 7 show spectra for a selection of the KX-only quasars. All of the subclasses of quasars that were expected in the KX sample were indeed found. Fig. 6 shows three quasars with redshifts 2.7, placing them in the region where the SDSS quasar-selection is known to be significantly incomplete, as described in the Introduction. It was expected that a large number of objects were found in this redshift range. The quasar in the bottom panel is an example of a KX-only quasar with a strong intervening absorption system.
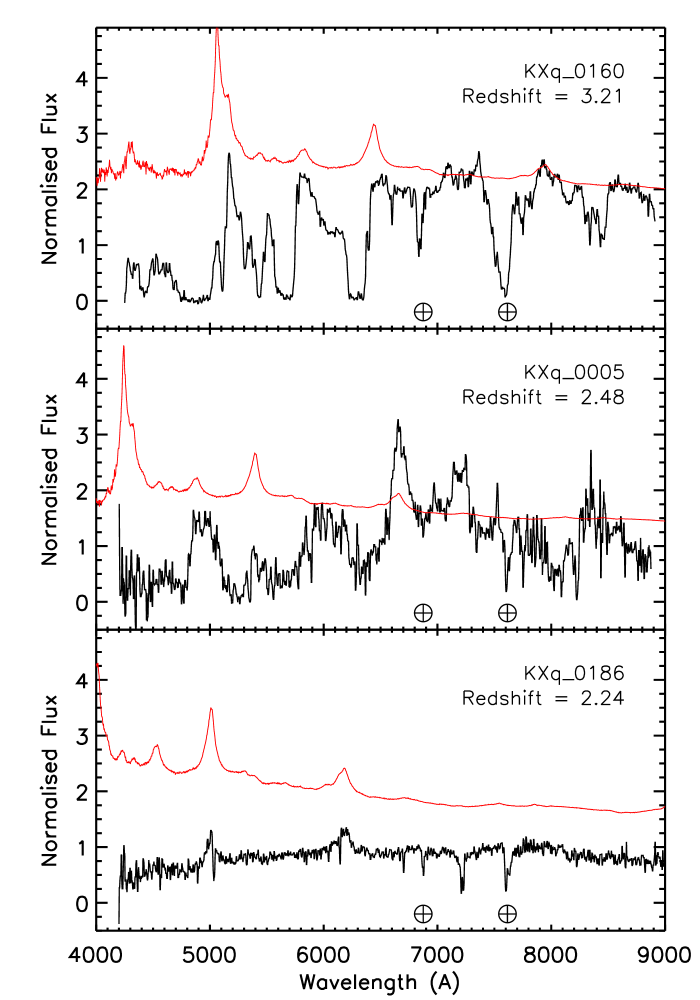
The objects in Fig. 7 show some of the more unusual quasars uncovered by the KX selection. The top panel shows a strong BALQSO, and the middle panel shows an even more extreme object, whose redshift is somewhat uncertain. The bottom panel shows a quasar with broad emission lines but a clearly curved continuum, likely indicating a moderate amount of dust reddening.
5.2 SDSS Quasars
The existing SDSS quasars contribute the most objects to the final combined KX catalogue. There are 3267 spectroscopically confirmed quasars in the survey area, of which 1135 satisfy the appropriate - and -band magnitude limits for the three survey areas and . The method with which the objects were selected by the SDSS is not important, as all of the objects included in the KX catalogue have also been selected by the NIR Photo- algorithm.
5.3 Other Quasars in the Area
The 2SLAQ survey covers a two-degree wide strip of sky around declination zero, with optical magnitude limits fainter than those of the main SDSS quasar survey. 33 2SLAQ quasars were chosen by the NIR Photo- selection within the survey area, but only one satisfies the NIR Photo- selection criteria to the magnitude and redshift limits imposed.
The data from the Pilot KX Survey also covers a strip around declination zero, along with a small area of coverage at declination . An extra 35 quasars are added to the new KX catalogue, with three satisfying the completeness limits. Table 5 summarises the number of quasars from the different surveys contributing to the final KX-selected quasar catalogue.
5.4 SDSS TARGET Flags
Many more objects within the SDSS photometric database were flagged as quasar candidates by the SDSS quasar selection algorithm than could be observed within the SDSS survey. Therefore, there is a population of objects for which an SDSS quasar target flag is set but no SDSS spectrum exists, hereinafter referred to as SDSS TARGETs. As the objects chosen by the tiling algorithm for spectroscopic observations from the list of targets have no special properties with respect to the general pool from which they are drawn, it is expected that, statistically, the objects will have the same properties as the sample with spectra.
The efficiency of each of the SDSS TARGET flags can be investigated by comparing all objects with the flag set to the spectroscopic identification of the subset of objects that were observed. It was found that some of the flags are more reliable than others. The quasar target flags of TARGET_QSO_CAP, TARGET_QSO_FAINT, TARGET_QSO_FIRST_CAP, TARGET_QSO_HIZ, TARGET_SERENDIP_BLUE, TARGET_SERENDIP_FIRST, and TARGET_ROSAT were all found to be reliable indicators of the target being confirmed as a quasar, when the objects were also selected as quasar candidates by the NIR Photo- selection.
Without exception, when the flag TARGET_QSO_REJECT was set for an object, the probability that the object was confirmed as a quasar was very low, i.e. the efficiency of this flag was only a few per cent. This is true even if the object was additionally selected as a quasar candidate by the NIR Photo-. The finding is entirely in accord with expectation Richards et al. (2002) and objects with the TARGET_QSO_REJECT flag set were removed from consideration. Only 6 per cent of the SDSS TARGETs were removed for this reason. Additionally, candidates with either TARGET_REDDEN_STD, TARGET_STAR_BHB, or TARGET_STAR_CARBON set, along with none of the quasar target flags, were removed. These further reduce the number of targets by 3 per cent.
The efficiency of the NIR Photo- selection with respect to known SDSS quasars, computed in Section 6.2, is very high, at 99 per cent. It is then reasonable to expect that the efficiency with which the NIR Photo- correctly selects quasars from the SDSS TARGETs will be equally high. Thus the number of additional ‘quasars’ that can be added into the catalogue is selection efficiency N(TARGETs). Using the efficiency of 99 per cent, and finding that there are 1210 SDSS TARGETs in the survey area, an extra 1198 ‘quasars’ are added to the catalogue. All 1210 TARGETs are retained in the final KX quasar catalogue for completeness.
Although objects that possess SDSS quasar TARGET flags were, in general, excluded from further spectroscopic observation, 28 SDSS TARGETs were deliberately observed. Twenty-seven of the targets are classified as quasars, for an efficiency of 96 per cent, consistent with the 99 per cent computed from the SDSS spectroscopically observed population. These 27 quasars reduce the number of purely KX-selected quasars from 284 to 257, and have been added to the SDSS spectroscopically confirmed quasars to increase their number from 3267 to 3294, as noted in Table 5.
The statistical properties of the sample of objects with identifications by NIR Photo- as quasars and with SDSS quasar TARGET, are expected to be identical, irrespective of whether objects possess an SDSS spectrum.
5.5 The Final KX-Selected Quasar Catalogue
The final KX-selected quasar catalogue composed of quasars selected by the NIR Photo- routine, but spectroscopically observed within the SDSS, 2SLAQ, Pilot KX Survey and the present large area KX survey contains 3619 spectroscopically confirmed quasars, or 4829 quasars with the SDSS TARGETs included. Of these, 1328 quasars have spectra confirming they are at , and if they fall within the CA area, and if they are in the NTT/VLT area, and and within the NTT/VLT Deep area.
Table 6 gives a description of the columns contained within the KX-selected quasar catalogue. As with Table 4, the catalogue is available in the online version of the paper. Additional information for each object can be extracted from the SDSS and UKIDSS databases using the unique object identifiers provided. Note that the UKIDSS DR4 database should be queried when using the UKIDSS WSA Object IDs, as they are specific to each data release.
| Survey | Total | Complete |
|---|---|---|
| Large Area KX | 284 (257) | 172 |
| SDSS | 3267 (3294) | 1152 |
| 2SLAQ | 33 | 1 |
| Pilot KX | 35 | 3 |
| Subtotal | 3619 | 1328 |
| TARGETs | 1210 | 163 |
| Total | 4829 | 1491 |
| Column | Format | Description |
|---|---|---|
| 1 | A8 | Unique KX Catalogue ID |
| 2 | F12.6 | Right ascension in decimal degrees (J2000) |
| 3 | F12.6 | Declination in decimal degrees (J2000) |
| 4 | F9.6 | SDSS -band magnitude, converted to Vega, corrected for Galactic extinction |
| 5 | F9.6 | SDSS -band magnitude, converted to Vega, corrected for Galactic extinction |
| 6 | F9.6 | SDSS -band magnitude, converted to Vega, corrected for Galactic extinction |
| 7 | F9.6 | SDSS -band magnitude, converted to Vega, corrected for Galactic extinction |
| 8 | F9.6 | SDSS -band magnitude, converted to Vega, corrected for Galactic extinction |
| 9 | F9.6 | UKIDSS -band magnitude, corrected for Galactic extinction |
| 10 | F9.6 | UKIDSS -band magnitude, corrected for Galactic extinction |
| 11 | F9.6 | UKIDSS -band magnitude, corrected for Galactic extinction |
| 12 | F9.6 | UKIDSS -band magnitude, corrected for Galactic extinction |
| 13 | F9.6 | SDSS -band magnitude error |
| 14 | F9.6 | SDSS -band magnitude error |
| 15 | F9.6 | SDSS -band magnitude error |
| 16 | F9.6 | SDSS -band magnitude error |
| 17 | F9.6 | SDSS -band magnitude error |
| 18 | F9.6 | UKIDSS -band magnitude error |
| 19 | F9.6 | UKIDSS -band magnitude error |
| 20 | F9.6 | UKIDSS -band magnitude error |
| 21 | F9.6 | UKIDSS -band magnitude error |
| 22 | I1 | Region flag |
| 23 | I1 | Source of classification |
| 24 | F9.6 | Spectroscopic redshift |
| 25 | F9.6 | NIR Photo-z Photometric redshift |
| 26 | I1 | Completeness flag |
| 27 | F9.6 | estimate |
| 28 | I1 | BALQSO flag |
| 29 | A20 | SDSS Object ID |
| 30 | A12 | UKIDSS WSA Object ID |
| 31 | A20 | SDSS SpecObjID |
6 Evaluating the NIR Photo- Algorithm
The two quantities used to determine the overall quality of a selection scheme are the completeness and the efficiency. The completeness describes the number of quasars that are selected compared to the total number that exist but do not meet the selection criteria, whereas the efficiency compares the number of quasars identified with respect to the total number of candidates chosen. Clearly, the aim is for both values to be as close to 100 per cent as possible, but generally a compromise must be made, with higher completeness achieved at the expense of lower efficiency, and vice versa.
6.1 Recovery of SDSS Quasars
Determining the completeness of a selection algorithm is difficult as the true number of objects at the appropriate magnitudes and redshifts is required. Extensive analysis of the completeness of the SDSS quasar selection routine has been carried out by Richards et al. (2006), involving a grid of simulated quasars covering a range of photometric properties. However, the simulations do not include dust extinction, nor do they allow for curvature in the quasar SED or BAL troughs, and are thus only upper limits on the completeness.
A completeness calculation similar to that of Richards et al. (2006) is beyond the scope of the current work. However, it is still important to confirm that the NIR Photo- routine is able to recover known quasars as well as finding additional quasars. The SDSS spectroscopic dataset is useful for this task due to the large number of objects and the broad range of quasar SEDs included. That said, it is important to remember that the goal of the present study is to identify quasars not contained within the SDSS catalogue.
The completeness of the NIR Photo- code with respect to the known SDSS quasars is determined by crossmatching the quasar list to the UKIDSS LAS DR4 database to extract their photometry and morphology. The NIR Photo- algorithm was then applied to the SDSS-UKIDSS photometry for the SDSS spectroscopic sample.
Within the survey area, 96.3 per cent of the SDSS quasars with and a corresponding entry in the UKIDSS LAS are correctly identified as a quasar candidate by the NIR Photo- selection. Restricting the test to , and and requiring that the object is rightward of the selection line on the plot, which more accurately reflects the final selection criteria of the candidates, the completeness with respect to known SDSS quasars is found to be extremely high, at 97.9 per cent.
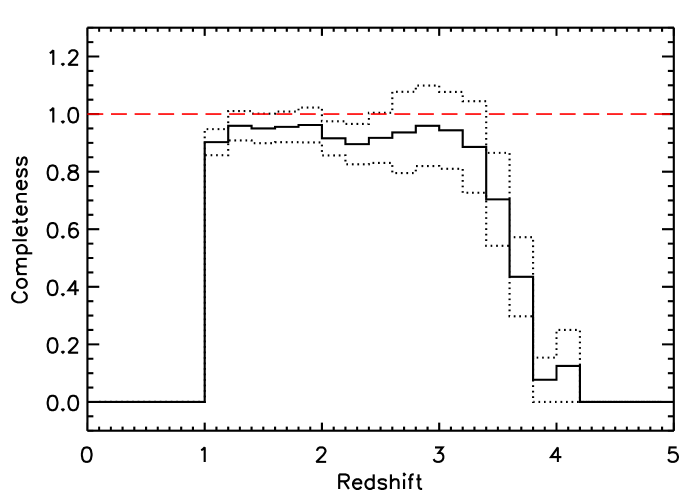
A 98 per cent success rate is encouraging but the figure does not exactly match the full selection criteria, which include the restriction that the the photometric redshift, , must also exceed unity. Requiring that the recovered quasars have reduces the completeness to 92.0 per cent. Fig. 8 shows the roughly constant selection completeness to 3.5, where the completeness drops off drastically due partly to employing the -band in the selection (within the diagram) and a sub-optimal scheme for incorporating non-detections in the - and -bands in the Photo- algorithm.
6.2 Selection Efficiency
In addition to the completeness, the other important quantity to determine for the survey is the efficiency of the selection, which relates the number of candidates chosen to the number of those candidates that are confirmed as quasars. Using the extensive spectroscopic information already available from the SDSS, 2SLAQ and Pilot KX surveys in addition to the new spectroscopic observations, an estimate of the overall efficiency of the selection algorithm can be made.
There exist 3762 objects within the survey area that are selected as quasar candidates by the NIR Photo- algorithm that also possess spectra from one of the four above mentioned surveys, of which 3619 are confirmed as quasars. This results in a selection efficiency of 96.2 per cent. Restricting the sample to the magnitude limits appropriate for each area and requiring the candidate to have , 97.4 per cent of the candidates are confirmed as quasars. The efficiency in the NTT/Deep region does not drop below that of the other shallower regions. If a further restriction of on the confirmed quasar is applied, the efficiency is reduced to 84.3 per cent, due to the NIR Photo- correctly identifying the quasar but incorrectly assigning a high () redshift when the spectroscopic redshift is .
Restricting the efficiency calculation to the new KX-only quasars, 284 of 324 candidates are confirmed quasars, for 87.6 per cent efficiency. For objects with , and , the efficiency drops to 75 per cent, however, the figure is encouraging given all such objects eluded the SDSS quasar selection algorithm. These values are lower limits, as there are a number of probable quasars among the 19 objects that have no secure identification.
The KX-selected quasar candidates with new spectra classified as stars, galaxies or unclassified (40 of 324 objects observed), do not show clustering in any of their relevant properties such as - or -band magnitudes, , or the NIR Photo- best matched quasar model. Further investigation is required to determine why these objects were selected as quasar candidates, and how the number of non-quasars can be reduced, thereby increasing the efficiency.
The selection efficiency does not show any strong dependence on -band magnitude, or colour within the ranges probed by the observations. This is encouraging for future efforts that aim specifically at faint or very red objects.
6.3 NIR Photo- Redshift Accuracy
It has been shown that the NIR Photo- routine is very good at selecting known quasars as quasar candidates, i.e. the identification of the objects is reliable. Now we need to determine the accuracy of the photometric redshifts, , of the quasar candidates. This is particularly important because of the restriction imposed on the quasar candidate list.
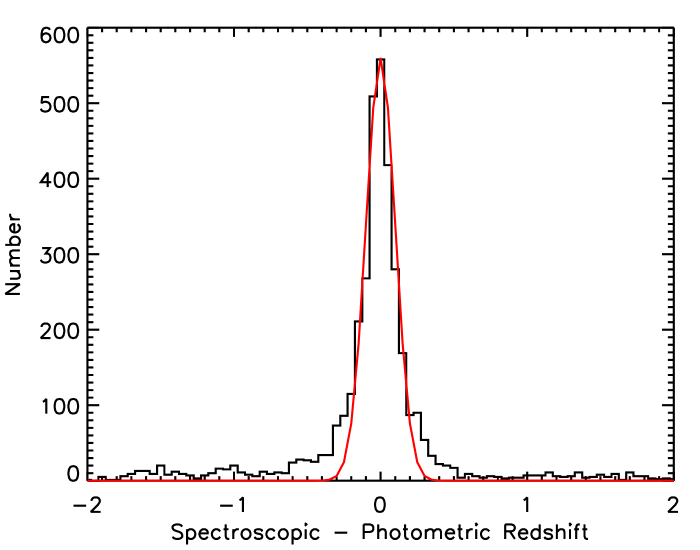
For all of the 3619 quasars in the final KX catalogue, the and can be compared, as shown in Fig. 9. Overall, the NIR Photo- code is fairly accurate at determining the redshifts of known quasars; the quasars follow the the line with no significant systematic offset. The core of the distribution is well fit by a Gaussian centred at zero with , as shown in Fig. 10. The small-scale wiggles as a function of redshift can be attributed to emission lines moving into and out of the various passbands. There are, however, a fraction of outliers, referred to as ‘catastrophic failures’; 20.6, 14.1 and 8.6 per cent of the quasars in Figs. 9 and 10 have spectroscopic redshifts that differ from the photometric redshift by more than 0.3, 0.5 and 1.0, respectively. The small clusters of objects result from confusion caused by the misidentification of emission lines, indicated on the plot by the dashed lines.
The redshift accuracy of the NIR Photo- appears to perform at least as well, if not better, as the Bayesian classification algorithm based only on optical colours from the study of Richards et al. (2009). The widths of the distributions are comparable and both centred around zero, but the fraction of objects with using optical colours alone is 11.6 per cent, larger than the 8.6 per cent for the NIR Photo- routine. The difficulty in selecting quasar candidates at using only optical colours is also evident in the quasar candidate catalogue constructed by Richards et al. (2009), whereas the NIR Photo- does not experience such redshift-dependent efficiency or completeness. These results reinforce the conclusions drawn from the study of Hatziminaoglou et al. (2000), where the combination of NIR and optical bands provides a clear advantage over using optical photometry alone.

6.4 Photometric Variability
As quasars are known to vary in brightess with time, and the optical and NIR photometry used within the current study are not taken simultaneously, the effects of this variability should be investigated. Using magnitude measurements from two epochs for 25 000 SDSS quasars, Vanden Berk et al. (2004) have determined that quasar variability amplitude is smaller at longer wavelengths, and variability amplitude is smaller for brighter objects. Both of these trends are beneficial to the current study. As shown in the previous sections, both the completeness and efficiency of the selection are extremely high, so changes to intrinsic optical-NIR colours due to photometric variability must be sufficiently small such that the selection of quasars is largely unaffected.
The requirement a candidate lies rightward of the selection boundary in the plot could also potentially exclude a small number of objects due to variability. Empirically, the fraction of known SDSS quasars falling leftward of the selection boundary is less than 1 per cent (Section 3.4) strongly suggesting that the effect of variability is minimal. The very small loss of quasars is consistent with the locataion of quasars within the -space. Horizontal movement in the plot is due to a change in colour, which is expected to be very small. Vertical movement due to varying colour is also expected to be small, 0.1 magnitude, for the rest-frame time intervals for these objects. Only at would vertical movement on the plot cause an object to cross the selection line. Objects lying close to the selection line at are blue and have , and are therefore very likely to have been selected by the SDSS already.
7 Properties of KX Quasars
The primary rationale for the current work is to present a description of the selection of the KX quasar sample along with the catalogue of objects resulting from the spectroscopic investigation of the sample. However, below we outline some general properties of the KX-only quasars with respect to optically selected SDSS quasars.
7.1 Redshift Distribution
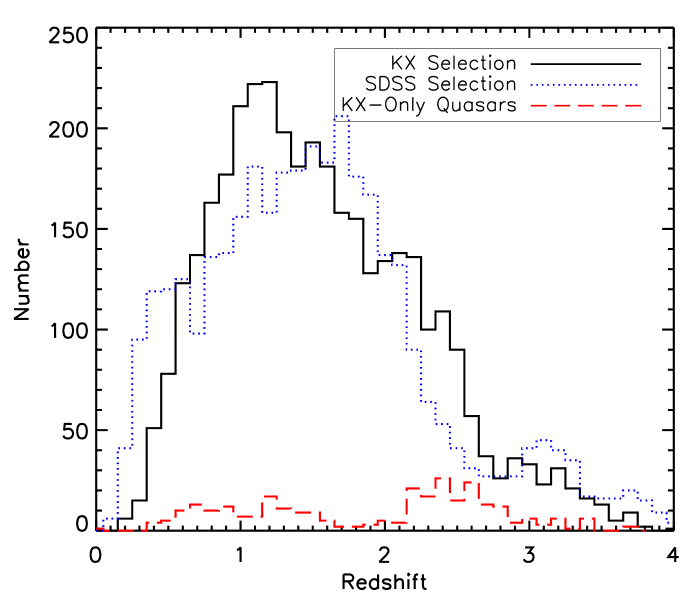
Fig. 11 shows three redshift histograms for different quasar samples. The black solid line shows the redshift distribution of all the quasars in the area including new KX and SDSS objects that have been uniformly selected by the NIR Photo- algorithm. The blue dotted histogram is for the enhanced SDSS DR7 quasar catalogue from Hewett & Wild (2010), scaled down by a factor of 30 for plotting. The well-known deficits of objects at 2.7 and 3.5 are clearly visible in the SDSS histogram. The red dashed histogram shows the new KX-only quasars. The redshift distribution of the KX-only plus SDSS NIR Photo- selected quasars is smoother than that of the SDSS-selected quasars, with the deficit of objects at 2.7 greatly reduced once the new KX-selected quasars are incorporated.
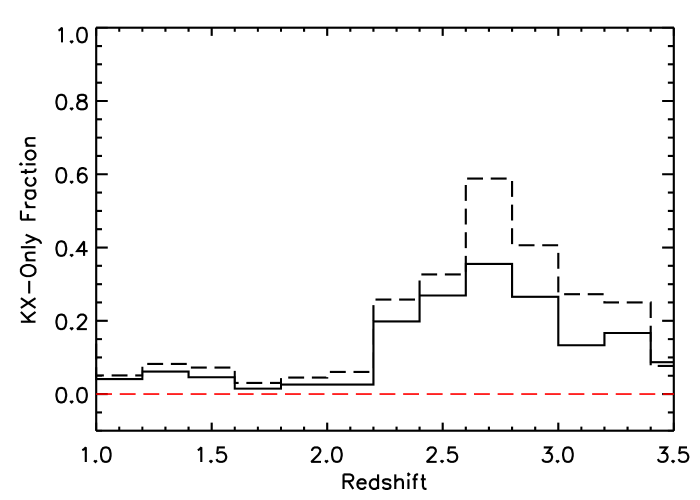
Fig. 12 shows the fraction of KX-only quasars contributing to the KX catalogue at each redshift. As expected, the KX-only quasars contribute the most at where the SDSS has difficulty selecting objects. However, the excess of objects at is also interesting, as the completeness of the SDSS selection algorithm is considered to be very high at these redshifts. This is discussed further in Section 8.1.
7.2 Distribution
The of each quasar can be estimated in a number of ways. For this brief study, we choose to use the available photometry to determine the amount of reddening present instead of, for example, fitting a quasar model + dust extinction curve to the spectra. In addition to being independent of the quality of the spectral flux calibration, the photometry offers a much longer wavelength baseline than the optical spectra, which is useful for constraining the amount of dust present.
We use the colours of the quasars as a measure of the overall colour of the quasars as it provides the longest baseline in wavelength without being affected by absorption in the Ly forest at high redshifts. Fig. 13 shows the distribution of colours of the quasars in the KX catalogue as a function of redshift. Overplotted are the colours derived from a subset of the model quasars originally used in the NIR Photo-. The quasars can be seen to occupy a wide range of values at fixed redshift.
Once the influence of quasar host galaxy light on the NIR-colours has become small, at redshifts , the main quasar SED-related change to the observed colours is due to the presence of the H emission line in the -band for the reshift interval . The colour-change for a quasar with typical H emission-line strength is 0.4 mag. Emission-line strength variations of up to a factor two are not uncommon and some quasars can thus become redder by nearly a magnitude in due to the presence of H in the -band. Fig. 13 illustrates the effect very clearly.
It is important to note that two very different effects are responsible for the excess of KX-only quasars with redshifts visible in Figs. 11 and 12. The first is the established incompleteness in the SDSS optical colour-based selection which becomes particularly severe at redshifts (Richards et al. 2002). The second effect results from the presence of the strong H emission line in the -band, which defines the flux-limit of our sample. For a typical quasar, the presence of the emission line results in an apparent brightening within the redshift interval . The -band sample thus reaches approximately 0.4 mag deeper into the quasar luminosity function, resulting in an apparent excess of KX-only quasars within the interval of a factor 2.
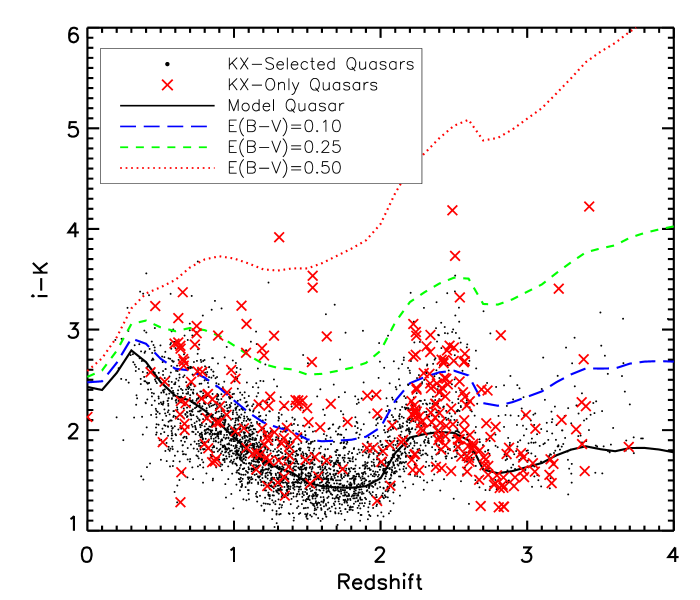
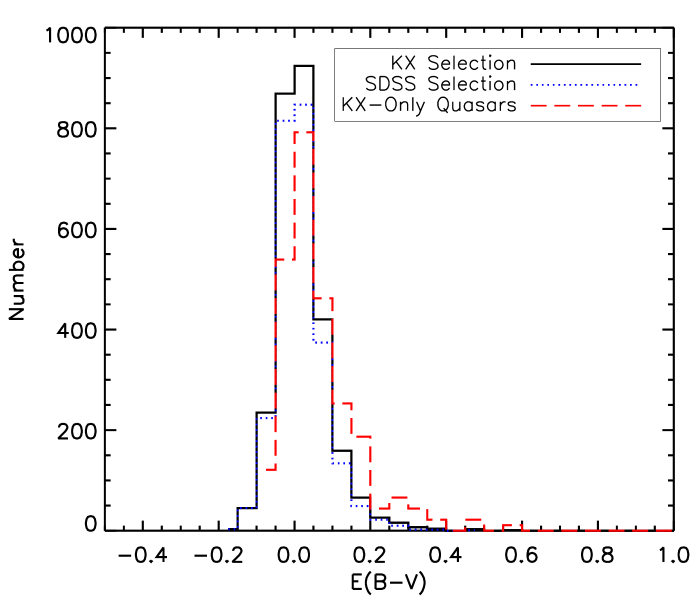
From Fig. 13, an estimate of the amount of reddening each object is experiencing can be made from its vertical location with respect to the reddened quasar model loci. Fig. 14 shows the result of this procedure when applied to the KX quasars, the SDSS quasars within the KX catalogue and the KX-only quasars at . The KX-only quasars are systematically redder than the SDSS quasars, with a more pronounced red tail. The width of the distribution in Fig. 14 centred at provides an estimate of the uncertainty in the values measured. The median values for the SDSS quasars is 0.009, whereas that for the KX-only quasars is 0.038. The histograms significantly underestimate the fraction of reddened KX-only quasars because, as is evident from Fig. 13, the large number of ‘normal’ quasars in the redshift interval missed by the SDSS include many objects with essentially zero estimates.
The estimates of shown in Fig. 14 account for the presence and variation of strength of H in the K-band at . For the majority of the objects within this redshift range, the standard quasar model, or a reddened version of it, was the best fit within the NIR Photo-z routine. The values for these objects are computed with respect to the standard and reddened standard quasar models. For the remaining objects, the best fit was for a model with twice strong emission lines, and their values were derived with respect to this model instead of the quasar model with standard emission line strength. The stronger emission line models result in derived values that are smaller by between 0.02–0.05 compared to the standard model.
Using photometry to determine makes the assumption that any significant deviation of the quasar colours from those expected from the unreddened model arise from dust reddening. This assumption is poor for low redshift () objects, as the quasar host galaxy flux can boost the NIR flux, thus giving the impression of a redder SED that is not representative of the SED shape of the quasar. The assumption also does not account for the intrinsic spread of quasar spectral slopes at optical wavelengths, which can be as large as for (Richards et al., 2006).
Analysis of the values derived from photometry requires all of these effects to be considered. An accurate measure of the reddening distribution of the KX-selected quasars is being undertaken and the results will provide a quantitative determination of the fraction of dust reddened quasars, with mag, missing from optically selected samples.
7.3 BALQSO Fraction
The newest BALQSO catalogue available is that of Allen et al. (2011), based on the SDSS DR6 quasar catalogue. This catalogue computes the traditional balnicity index (BI) for the SiIV, CIV, AlIII and MgII emission lines. In a preliminary assessment of the observed frequency of BALQSOs we focus only on absorption related to the CIV line here as these troughs are easiest to identify and span a redshift range similar to the objects in the new observations. It is assumed that wavelength coverage to 1450 Å is required in order to identify a CIV BAL trough in an SDSS spectrum, which corresponds to quasars at .
The NIR Photo- selected quasars with spectral coverage down to 1450 Å have been visually inspected to identify CIV BALQSOs. No objects from the Pilot KX survey or 2SLAQ are included here as there are only a few objects above .
From the DR6 BALQSO catalogue, the computed mean observed BALQSO fraction () for CIV BALQSOs over is . Adding the visually identified KX BALQSOs to the known SDSS BALQSOs, the observed mean BALQSO fraction within the KX catalogue over the same redshift range increases to .
Fig. 15 shows the observed BALQSO fraction as a function of redshift. The solid histogram is from the catalogue of Allen et al. (2011), whereas the dashed histogram includes known SDSS and newly observed KX BALQSOs, both selected by NIR Photo-. The bin size for the KX+SDSS sample is to increase the number of objects in each bin. The redshift bin from is incomplete, as SDSS CIV BALQSOs can only be reliably identified at .
The peak of BALQSOs in the SDSS histogram at 2.7 is due to the BAL troughs changing the optical colours of the objects enough to remove them from the stellar locus. Thus at this redshift, BALQSOs are preferentially selected while ordinary quasars are missed. Conversely, the dip in the SDSS histogram at 2.3 is due to the BAL troughs altering the optical colours of the quasars such that they are consistent with the stellar locus, so although ordinary quasars are selected at this redshift, BALQSOs are preferentially missed by the optical colour selection (see Fig. 21 in Allen et al. (2011) and the associated discussion for an illustration of this effect). The new KX quasars at 2.3 are heavily dominated by BALQSOs. KX selection of quasars is clearly a valuable tool for working toward an accurate determination of the intrinsic fraction of BALQSOs.

7.4 Dusty Absorbers
There are 34 quasars with identified intervening absorbers, of which 10 have estimated . As the new KX spectra are only of moderate resolution, further observations at higher resolution and higher S/N are required for analysis of the intervening absorbers.
8 Discussion
A number of extra quasars have been found by the NIR Photo- selection algorithm relying on the -band excess of quasars with respect to Galactic stars. However, as the completeness of the SDSS quasar selection algorithm is known to be less than 100 per cent, this is unsurprising. Here we investigate the number of extra KX-only quasars found with respect to the estimated SDSS completeness, and consider why these objects were not optically selected as quasar candidates.
8.1 Extra KX Quasars
The overall completeness of the multicolour and multiwavelength selection employed by the SDSS (Richards et al. 2002) has been computed to be 89 per cent (Vanden Berk et al. 2005). The completeness is a strong function of redshift, with significantly lower values for particularly problematic redshifts. The large correction factors at problematic redshifts where the completeness can be as low as 5 per cent (Richards et al., 2006) make this number uncertain.
It has been shown that KX selection is capable of identifying quasars that were not flagged as quasar candidates by the SDSS targetting routine. It is important to determine whether the number of extra quasars is compatible with the expected completeness of the SDSS selection, or whether a genuine unexpected excess of objects has been found.
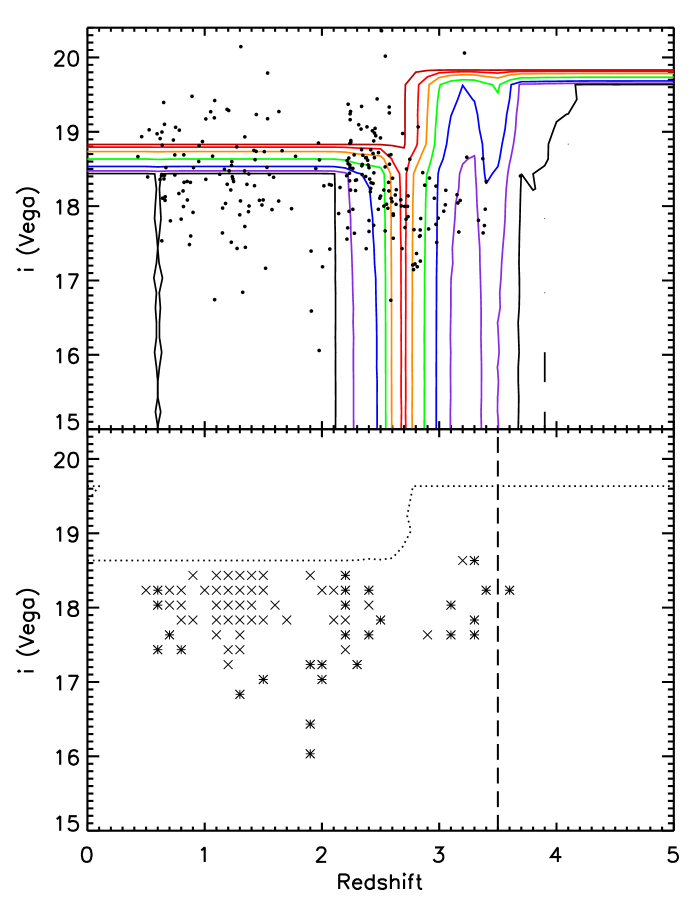
Various estimates of the completeness of the SDSS target selection algorithm have been performed (Richards et al. 2002 and Vanden Berk et al. 2005, for example), but here we use the completeness determination from the calculation of the SDSS quasar luminosity function Richards et al. (2006). From that work, the computed completeness between and are provided in tabular form for point sources, extended sources and radio-selected sources. The point source completeness is used here, as all the KX candidates are unresolved, and is shown in the top panel of Fig. 16. Overplotted is the location of the KX-only quasars, which can be seen to primarily cluster around the problematic redshifts of , but there are still a significant number of quasars at and where the SDSS completeness is expected to be very high.
Within the area surveyed, for each -band magnitude and redshift grid point, the number of objects from the enhanced SDSS DR7 quasar catalogue from Hewett & Wild (2010) is determined, along with the corresponding completeness. The grid cells are and in size. Multiplying the number of SDSS quasars found with the completeness provides the number of objects that are known to be missing from the SDSS catalogue. For the same magnitude and redshift cell, the number of KX quasars are also counted, and compared with the known number of missed objects. The bottom panel of Fig. 16 shows the magnitudes and redshifts for which the number of KX-only quasars exceeds that expected from the completeness. The black dotted line delimits the region of the plot for which the SDSS completeness is zero.
As seen in the lower panel, the large number of KX-only quasars found at 2.7 are not beyond what is expected from the low SDSS completeness. However, there is an excess at , corresponding to the redshift at which the new KX-only quasars are dominated by BALQSOs. Quasars with BALQSO SEDs were not included in the SDSS completeness corrections used here, and thus the completeness at this redshift is underestimated. There is also an excess of KX-only quasars at 1. A number of these quasars have estimated reddening of and their spectra show significant curvature. Objects with curved SEDs were also not included in the completeness simulations, so finding an excess of objects at this redshift is unsurprising. However, it does show that there is a measurable population of quasars at this redshift missing from the SDSS quasar catalogue and the corresponding completeness calculations.
All of the quasars within the survey area from the enhanced SDSS DR7 quasar catalogue are used in the above calculation, including quasars selected by serendipity, radio and X-ray properties, i.e. neither of the two well-defined colour-selection algorithms. The completeness values from Richards et al. (2006) are for the colour-selection only and the the lower panel of Fig. 16 underestimates the true number of excess KX quasars with respect to the SDSS colour selection.
8.2 SDSS Non-Selection
Why were the KX-only quasars not selected as quasar targets by the SDSS target algorithm? Broadly the explanations fit into three categories. The first is that, at certain redshifts, the optical colours of the objects place them in the stellar locus. The second is that the objects are too faint in -band to be selected. The third is the most interesting case, i.e. the objects satisfy the SDSS -band magnitude limit(s) and do not lie within the stellar locus.
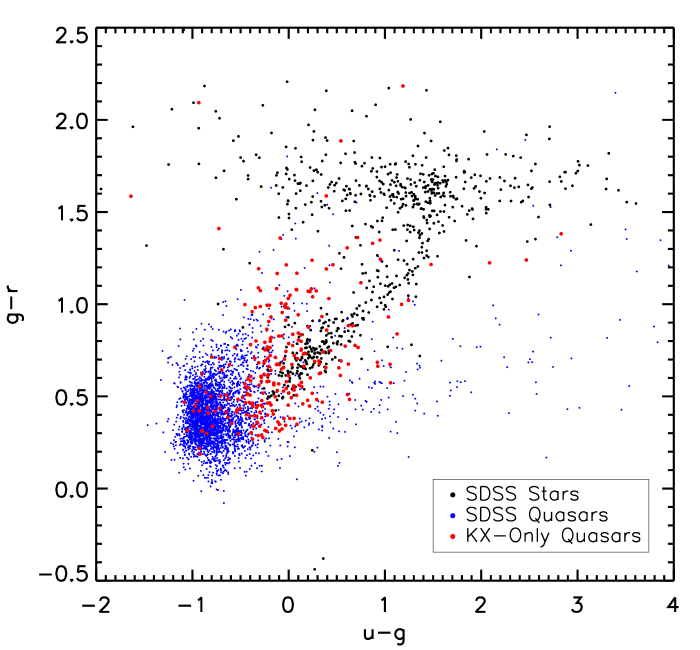
Fig. 17 shows the vs colour–colour plot similar to that shown in Richards et al. (2002) displaying the stellar locus (black dots) and the SDSS selected quasars (blue dots), which generally do not overlap in colour-space. A large number of the KX-only quasars (red dots) lie within the stellar locus, as expected. However, the KX-only quasars located in the same region as the SDSS quasars are potentially of considerable interest.
Extracting the KX-only quasars which lie in the same region of colour-space as the SDSS quasars, the objects do not have particularly large values of or faint -band magnitudes, i.e. most are brighter than and not significantly reddened. Many of the objects are BALQSOs at where the gradient in the SDSS selection probability is relatively steep. It is likely that a small, but systematic, error in the SDSS selection probability calculation is responsible for the excess of quasars with somewhat atypical SEDs found in the redshift interval .
8.3 Further Work
Construction of the KX-selected quasar catalogue is an important first step towards understanding the quasar population at with much reduced complicating factors of redshift-dependent selection effects and objects being missed due to moderate amounts of dust reddening. However, much more information can be derived not only from the catalogue itself, but from further observations of specific objects. Comparison of the spectral shape and emission line properties of the KX-selected quasars with respect to optically selected objects is currently underway. Perhaps information from these further studies will help determine why the KX-only quasars were not selected by the SDSS selection algorithm.
The distribution of dust extinction experienced by the NIR-selected quasars will allow a much better determination of the fraction of quasars missed from current surveys due to reddening than is currently possible with existing data. Further observations of the KX-only quasars which have intervening absorption systems will also help determine whether these absorbers are dustier than those found along the line-of-sight to optically selected quasars. These topics are only a few of the several interesting lines of research that can be undertaken using the KX-selected quasar catalogue as a starting point.
Searching for quasars using combinations of optical and NIR colours is a science goal for the Chinese Large Sky Area Multi-Object Fibre Spectroscopic Telescope (LAMOST, Su et al. 1998). LAMOST is a purely spectroscopic survey which must use existing imaging data to select candidates for follow-up observations. Two primary sources of photometric data for the survey are the SDSS and UKIDSS databases. Analysis based on known SDSS quasars suggests using two different optical–NIR colour-colour diagrams to select low and high redshift quasars, with resulting combined completeness of 99.4 per cent and contamination from stars of 6.3 per cent. However, these results only relate to known SDSS quasars, and do not apply to objects that are not selected as quasar candidates by SDSS. The NIR Photo- technique would be a valuable tool for quasar selection for LAMOST.
9 Conclusions
Using a combination of optical and NIR photometry and a custom-built photometric redshift routine to select quasar candidates at has been shown to be a valuable tool for collecting a quasar sample with fewer biases than optical selection. Section 6 evaluated the NIR Photo- routine and found it to be highly efficient at correctly identifying candidates as quasars, with efficiency reaching 97 per cent for , and 84 per cent for objects with and . The selection algorithm is also complete with respect to known SDSS quasars, correctly recovering 98 per cent of quasars with , and .
Interesting properties of the new KX-only quasars are outlined in Section 7. A large number of extra quasars are found at 2.7 as expected as the SDSS selection is particularly inefficient at this redshift, but excesses of KX-only quasars are also found at redshifts where the SDSS completeness is expected to be very high. Excesses of objects at and are found, due to the unusual spectral properties of KX-only quasars at these redshifts.
The KX-only quasars also show indications of being redder than SDSS quasars when comparing the colours of the two subgroups. Further analysis of the reddening properties of the KX quasars will yield a better estimate of the fraction of dust-reddened quasars currently missing from optically selected surveys. The KX quasar selection is also very effective in identifying BALQSOs, with virtually all of the new quasars at 2.3 showing BAL troughs. A number of quasars with high equivalent width interving absorption systems have also been found, some of which show signs of moderate () reddening. Further observations at higher S/N and spectral resolution are required to determine whether these absorbers contain significant dust columns.
The KX-selected quasar catalogue, and NIR-selection of quasars, has significant potential for constructing quasar catalogues less biased by dust and other redshift-dependent selection effects that affect optical quasar selection.
Acknowledgments
We acknowledge the contributions of the staff of UKIRT to the implementation UKIDSS survey and the Cambridge Astronomical Survey Unit and the Wide Field Astronomy Unit in Edinburgh for processing the UKIDSS data. This work is based in part on data obtained as part of the UKIRT Infrared Deep Sky Survey. The United Kingdom Infrared Telescope is operated by the Joint Astronomy Centre on behalf of the UK Science and Technology Facilities Council.
Funding for the SDSS and SDSS-II has been provided by the Alfred P. Sloan Foundation, the Participating Institutions, the National Science Foundation, the U.S. Department of Energy, the National Aeronautics and Space Administration, the Japanese Monbukagakusho, the Max Planck Society, and the Higher Education Funding Council for England. The SDSS Web Site is http://www.sdss.org/.
The SDSS is managed by the Astrophysical Research Consortium for the Participating Institutions. The Participating Institutions are the American Museum of Natural History, Astrophysical Institute Potsdam, University of Basel, University of Cambridge, Case Western Reserve University, University of Chicago, Drexel University, Fermilab, the Institute for Advanced Study, the Japan Participation Group, Johns Hopkins University, the Joint Institute for Nuclear Astrophysics, the Kavli Institute for Particle Astrophysics and Cosmology, the Korean Scientist Group, the Chinese Academy of Sciences (LAMOST), Los Alamos National Laboratory, the Max-Planck-Institute for Astronomy (MPIA), the Max-Planck-Institute for Astrophysics (MPA), New Mexico State University, Ohio State University, University of Pittsburgh, University of Portsmouth, Princeton University, the United States Naval Observatory, and the University of Washington.
NM wishes to acknowledge Daria Dubinovska, Dorothée Brauer, Laura Hoppmann and the ESO service observers for assisting with the observations, and helpful discussions with Professor Stephen Warren. The South African SKA Project is acknowledged for funding the postdoctoral fellowship position at the University of Cape Town. We thank the anonymous referee for helpful comments which improved this paper.
References
- Abazajian et al. (2009) Abazajian K. N., et al., 2009, ApJS, 182, 543
- Allen et al. (2011) Allen J. T., Hewett P. C., Maddox N., Richards G. T., Belokurov V., 2011, MNRAS, 410, 860
- Bolzonella, Miralles, & Pelló (2000) Bolzonella M., Miralles J.-M., Pelló R., 2000, A&A, 363, 476
- Brammer, van Dokkum, & Coppi (2008) Brammer G. B., van Dokkum P. G., Coppi P., 2008, ApJ, 686, 1503
- Buzzoni et al. (1984) Buzzoni B., et al., 1984, Msngr, 38, 9
- Cappelluti et al. (2011) Cappelluti N., et al., 2011, MSAIS, 17, 159
- Chiu et al. (2007) Chiu K., Richards G. T., Hewett P. C., Maddox N., 2007, MNRAS, 375, 1180
- Coleman, Wu, & Weedman (1980) Coleman G. D., Wu C.-C., Weedman D. W., 1980, ApJS, 43, 393
- Croom et al. (2009) Croom S. M., et al., 2009, MNRAS, 392, 19
- Croom et al. (2004) Croom S. M., Smith R. J., Boyle B. J., Shanks T., Miller L., Outram P. J., Loaring N. S., 2004, MNRAS, 349, 1397
- Csabai et al. (2003) Csabai I., et al., 2003, AJ, 125, 580
- Cunha et al. (2009) Cunha C. E., Lima M., Oyaizu H., Frieman J., Lin H., 2009, MNRAS, 396, 2379
- Dai, Shankar, & Sivakoff (2008) Dai X., Shankar F., Sivakoff G. R., 2008, ApJ, 672, 108
- Ellison et al. (2001) Ellison S. L., Yan L., Hook I. M., Pettini M., Wall J. V., Shaver P., 2001, A&A, 379, 393
- Emerson et al. (2004) Emerson J. P., Sutherland W. J., McPherson A. M., Craig S. C., Dalton G. B., Ward A. K., 2004, Msngr, 117, 27
- Frank & Péroux (2010) Frank S., Péroux C., 2010, MNRAS, 406, 2235
- Gibson et al. (2009) Gibson R. R., et al., 2009, ApJ, 692, 758
- Glikman et al. (2007) Glikman E., Helfand D. J., White R. L., Becker R. H., Gregg M. D., Lacy M., 2007, ApJ, 667, 673
- Gunn et al. (1998) Gunn J. E., et al., 1998, AJ, 116, 3040
- Hall et al. (2002) Hall P. B., et al., 2002, ApJS, 141, 267
- Hambly et al. (2008) Hambly N. C., et al., 2008, MNRAS, 384, 637
- Hatziminaoglou et al. (2000) Hatziminaoglou E., Mathez G., Pelló R., 2000, A&A, 359, 9
- Hewett & Wild (2010) Hewett P. C., Wild V., 2010, MNRAS, 405, 2302
- Hewett et al. (2006) Hewett P. C., Warren S. J., Leggett S. K., Hodgkin S. T., 2006, MNRAS, 367, 454
- Kaiser et al. (2002) Kaiser N., et al., 2002, SPIE, 4836, 154
- Lawrence et al. (2007) Lawrence A., et al., 2007, MNRAS, 379, 1599
- MacLeod et al. (2008) MacLeod C., Ivezić Ž., de Vries W., Sesar B., Becker A., 2008, AIPC, 1082, 282
- Maddox et al. (2008) Maddox N., Hewett P. C., Warren S. J., Croom S. M., 2008, MNRAS, 386, 1605
- Maddox & Hewett (2006) Maddox N., Hewett P. C., 2006, MNRAS, 367, 717
- Mannucci et al. (2001) Mannucci F., Basile F., Poggianti B. M., Cimatti A., Daddi E., Pozzetti L., Vanzi L., 2001, MNRAS, 326, 745
- Meusinger et al. (2012) Meusinger H., Schalldach P., Scholz R.-D., in der Au A., Newholm M., de Hoon A., Kaminsky B., 2012, arXiv, arXiv:1203.0215
- Oyaizu et al. (2008) Oyaizu H., Lima M., Cunha C. E., Lin H., Frieman J., Sheldon E. S., 2008, ApJ, 674, 768
- Reichard et al. (2003) Reichard T. A., et al., 2003, AJ, 126, 2594
- Richards et al. (2009) Richards G. T., et al., 2009, ApJS, 180, 67
- Richards et al. (2006) Richards G. T., et al., 2006, AJ, 131, 2766
- Richards et al. (2006) Richards G. T., et al., 2006, ApJS, 166, 470
- Richards et al. (2003) Richards G. T., et al., 2003, AJ, 126, 1131
- Richards et al. (2002) Richards G. T., et al., 2002, AJ, 123, 2945
- Schneider et al. (2010) Schneider D. P., et al., 2010, AJ, 139, 2360
- Schneider et al. (2007) Schneider D. P., et al., 2007, AJ, 134, 102
- Schwope et al. (2000) Schwope A., et al., 2000, AN, 321, 1
- Scoville et al. (2007) Scoville N., et al., 2007, ApJS, 172, 1
- Sharp et al. (2002) Sharp R. G., Sabbey C. N., Vivas A. K., Oemler A., McMahon R. G., Hodgkin S. T., Coppi P. S., 2002, MNRAS, 337, 1153
- Skrutskie et al. (2006) Skrutskie M. F., et al., 2006, AJ, 131, 1163
- Smail et al. (2008) Smail I., Sharp R., Swinbank A. M., Akiyama M., Ueda Y., Foucaud S., Almaini O., Croom S., 2008, MNRAS, 389, 407
- Su et al. (1998) Su D. Q., Cui X., Wang Y., Yao Z., 1998, SPIE, 3352, 76
- Vanden Berk et al. (2001) Vanden Berk D. E., et al., 2001, AJ, 122, 549
- Vanden Berk et al. (2004) Vanden Berk D. E., et al., 2004, ApJ, 601, 692
- Vanden Berk et al. (2005) Vanden Berk D. E., et al., 2005, AJ, 129, 2047
- Warren, Hewett, & Foltz (2000) Warren S. J., Hewett P. C., Foltz C. B., 2000, MNRAS, 312, 827
- Weymann et al. (1991) Weymann R. J., Morris S. L., Foltz C. B., Hewett P. C., 1991, ApJ, 373, 23
- White et al. (2003) White R. L., Helfand D. J., Becker R. H., Gregg M. D., Postman M., Lauer T. R., Oegerle W., 2003, AJ, 126, 706
- Wild & Hewett (2005) Wild V., Hewett P. C., 2005, MNRAS, 361, L30
- Wild, Hewett, & Pettini (2006) Wild V., Hewett P. C., Pettini M., 2006, MNRAS, 367, 211
- Wright et al. (2010) Wright E. L., et al., 2010, AJ, 140, 1868
- York et al. (2000) York D. G., et al., 2000, AJ, 120, 1579
Appendix A Input Catalogue and Candidate List Completeness
The appendix reviews the factors that reduce the effective sky-area of the survey from the loss of objects due to factors mostly unrelated to the intrinsic properties of the sources.
A.1 UKIDSS Catalogue Completeness
The completeness of the UKIDSS-derived flux-limited stellar catalogue was assessed by taking the SDSS DR7 quasar catalogue and cross-matching to the NIR object sample. Less than 2 per cent of the quasars do not have counterparts with . Visual inspection of the UKIDSS images demonstrates that the vast majority of the missing sources are due to one of two reasons. The objects either fall in small areas where the UKIDSS tiling is not contiguous (i.e. in small areas of sky not covered by UKIDSS, the existence of which is already incorporated in the UKIDSS survey area), or, possess -band images below the flux limit.
Just a handful of SDSS DR7 quasars which are clearly visible in the UKIDSS images remain but there is no photometry entry in the source catalogue. The objects represent a limitation to the completeness of the UKIDSS photometric catalogue but the fraction of such images is less than 0.2 per cent and the effect on the survey area is negligibly small. Thus the UKIDSS LAS catalogue is effectively 100 per cent complete with respect to quasars that appear in the SDSS. It is assumed that the UKIDSS recovery rate of SDSS quasars is applicable to all stellar sources.
A.2 Catalogue Morphological Determination
The KX-selected quasar sample to be investigated is deliberately restricted to include only objects with redshifts . To determine quantitatively whether such quasars may still be excluded from the sample due to the presence of a host galaxy making them appear non-stellar we investigated the fraction of SDSS quasars classified as non-stellar compared to a control sample of spectroscopically confirmed stars.
Five-thousand randomly selected spectroscopically confirmed stars were extracted from the SDSS database. Within the sample, 331 ( 7 per cent) are classified as morphologically extended by the SDSS pipeline. Visual inspection of these objects reveal that all such objects fall into one of three categories: i) close pairs of stellar objects that have not been separated, ii) a superposition of a foreground star and a background galaxy, or iii) the object is located near a saturated star, which has compromised the photometric parameters and hence the morphological parameters. All candidate KX-selected quasars with such properties are removed in the final visual inspection phase of the candidate list (Section 3.4). The experiment thus demonstrates that 71 per cent of stellar objects are ‘lost’ due to morphological-classification issues in the optical data.
The same 5000 stars were also cross-matched to the UKIDSS database to retrieve their NIR morphological classifications. Of the 1929 objects that possess an entry in the database and also have (i.e. the faint -band limit of the current survey), 174 are classified as morphologically extended. These 174 objects would be removed at the first stage of the candidate list construction. It is therefore important to understand whether any of these objects were erroneously removed, as it will affect the completeness of the final ‘stellar’-catalogue. Of these 174 objects, 113 are also classed as extended by SDSS (see above). However, 61 ( 3 per cent) objects are classed as stellar by the SDSS pipeline. The majority are close pairs of objects where the SDSS image reduction has separated the components but a single object is catalogued in the UKIDSS catalogue444The reason is usually due to the presence of a relatively red component causing the two images to blend together in the UKIDSS images.. Just five objects appear visually to not be obviously extended, leading to an estimate of the fraction of stellar images in the -band sample lost due to erroneous morphological classification by the UKIDSS piple line of just 5/1929, or 0.26 per cent. We assume that the same negligible correction factor applies to the sample of morphologically stellar quasars.
To investigate the potential loss of quasars due to the host galaxy causing the object to appear extended, the enhanced SDSS DR7 quasar catalogue was searched for quasars with and extended morphological classification. Just 268 of 78125 objects were found (0.34 per cent) and visual inspection of the SDSS images reveals they are virtually all either close pairs of two point sources, a quasar with a low redshift galaxy along the line of sight, or a quasar near a very bright star which has affected the photometry. Thus, an insignificant fraction of the quasar population at is lost by requiring stellar morphologies at optical wavelengths.
However, the quasar host galaxy contributes more flux at longer wavelengths, so the morphology as measured by UKIDSS is also checked. Cross-matching the enhanced SDSS DR7 quasar catalogue to UKIDSS and restricting to and , of 4324 matched objects that are unresolved by the SDSS, 268 are classed as morphologically extended in the NIR. Approximately half of these objects have , indicating resolved host galaxy flux causing the NIR images to be resolved. Of the 268, 30 are close pairs of objects and would be removed by visual inspection, leaving 238/4324 = 5.5 per cent of the known SDSS quasar population at would be excluded at the first stage of candidate selection.
A.3 Photometry Defects
A number of objects in the SDSS and UKIDSS catalogues are located close to bright stars, or have another object located very close to the line of sight. These objects have poor photometry and are removed from consideration by visually inspecting the SDSS images of the candidates.
Within the 286.6 square degree CA region, 4.5 per cent of the total candidates suffer from such poor photometry. The percentages for the NTT/VLT and NTT/VLT Deep regions are 6.2 and 4.9 per cent, respectively.
| CA | NTT/VLT | NTT/VLT Deep | |
| (deg2) | (deg2) | (deg2) | |
| Initial Area | 286.6 | 150.1 | 196.4 |
| Lost due to Stellar Requirement | -16.3 (5.7%) | -8.6 (5.7%) | -11.2 (5.7%) |
| Remaining | 270.3 | 141.6 | 185.2 |
| Lost due to Bad Photometry | -12.2 (4.5%) | -8.8 (6.2%) | -9.1 (4.9%) |
| Remaining | 258.1 | 132.8 | 176.1 |
| Total | 567.0 |
A.4 Effective Area
The initial area of sky covered by the selection algorithm is 633.2 square degrees, but this is reduced by the loss of surveyed area due to requiring the initial candidates to be unresolved and regions of sky near bright stars that affect the photometry. Table 7 computes the loss of area due to each of these factors, and the resulting effective area of the survey of 567.0 square degrees.