Simulated X-ray Spectra From Ionized Wind-Blown Nebulae around Massive Stars
Abstract
Using an ionization gasdynamics code, we simulate a model of the wind-blown bubble around a 40 star. We use this to compute the X-ray spectra from the bubble, which can be directly compared to observations. We outline our methods and techniques for these computations, and contrast them with previous calculations. Our simulated X-ray spectra compare reasonably well with observed spectra of Wolf-Rayet bubbles. They suggest that X-ray nebulae around massive stars may not be easily detectable, consistent with observations.
keywords:
Stars: massive , Stars: mass-loss , Stars: winds, outflows , ISM: bubbles , circumstellar matter , X-rays: ISM1 Introduction
Massive stars () lose mass throughout their lifetime, via winds and eruptions, before ending their lives in a cataclysmic supernova (SN) explosion. The interaction of this material with the surrounding medium creates vast wind-blown cavities surrounded by a dense shell, referred to as wind-blown bubbles. Simultaneously, radiation from the star can ionize the surrounding medium. As the star evolves through various stages, the mass-loss parameters, and the ionizing flux or number of ionizing photons, will change, affecting the structure of the bubble. When the star finally explodes, the resulting SN shock wave will expand within the bubble, and the dynamics and kinematics of the shock wave will depend on the bubble parameters [7]. Similarly, the relativistic blast waves associated with gamma-ray bursts (GRBs) are expected to expand within wind bubbles surrounding Wolf-Rayet (W-R) stars. Thus, it is important to understand the structure of the bubble, as it influences the evolution and emission from SNe and GRBs.
The structure of wind bubbles was identified by Weaver et al. [23]. Proceeding radially outward from the star, 4 regions are delineated: (1) a freely expanding wind region, (2) a shocked wind region, (3) the shocked ambient region, forming a thin dense shell, and (4) the unshocked ambient medium. An inner, ‘wind termination’ shock separates region (1) and (2), a contact discontinuity, regions (2) and (3) and an outer, generally radiative shock, regions (3) and (4).
In order to understand the structure of wind-bubbles accurately, models must take into account both the gasdynamics and ionization from the star. Early models that explored the evolution of massive star surroundings [15, 16] had some ionization built in, mainly centered around the Stromgren sphere approximation. They did not model the main-sequence (MS) stage in multi-dimensions. Similar limitations were included in the models of [22, 21]. A somewhat better treatment of ionization properties was included in [13, 14]. Dwarkadas [8, 9, 10] considered the entire evolution in multi-dimensions, and studied the turbulence in the interior, but did not include any ionization in his calculations. 3D simulations carried out by [20] also do not include ionization. A more complete treatment of both the ionization plus the gasdynamics has been included in the work of Arthur and her group [2, 3, 19].
In this paper we outline a code, AVATAR, that couples the ionization to the gasdynamics, and use it to study the evolution of wind bubbles around a 40 star. We use a tried and tested method, with the goal of having a reasonably accurate description of the wind-blown bubble that is consistent, and at least equivalent to, if not better than, what other groups have done in the recent past. Our purpose is to have a numerical description of the bubble using which we can compute the X-ray emission. Using our code we compute the structure and evolution of the wind-blown bubble, study the dynamics, hydrodynamics and kinematics, the formation of instabilities, growth of small scale structure, and the onset of turbulence.
Much of the volume of the wind bubble is occupied by the high-pressure, low density shocked wind. Wind velocities of order 1000-2000 km s-1 for O, B and Wolf-Rayet (W-R) stars should conceivably result in post-shock temperatures in the shocked wind of 107 - 108 K. It has been assumed in the literature, perhaps rather naively, that the nebulae should therefore be visible as regions of diffuse X-ray emission. However, despite extensive searches around WR and main-sequence stars with Chandra and XMM, diffuse X-ray emission has been detected in only few cases [5, 4, 25], with observed X-ray luminosities 10-100 times smaller than would be expected given the “expected” temperatures and the size of the region. The inferred temperatures for bubbles around two W-R stars, NGC 6888 and S308, are a few times 106 K, again lower than expected given the wind velocities. Recently, Zhekov & Park [26] have found that about 10% of the flux in 6888 arises from higher temperature plasma ( 2 keV).
It appears that either some of the a-priori assumptions must be incorrect, or perhaps that the thermal energy is converted to some other form of energy. Turbulence has been suggested as one answer. Dwarkadas [10] found, from 2D simulations, that only a small percentage of the energy went into turbulent motions, except in the very last stages of W-R evolution, where the energy in non-radial motions was about 15-20% of that in the radial flow. Thermal conduction is another suggestion, but given the low densities within the bubble, it seems quite unlikely. This has been quantitatively shown by [19]. In order to address questions regarding the X-ray emission, we compute X-ray spectra from our simulations, using the ISIS package [17].
In this first paper, our intention is to outline our work and demonstrate the viability of the techniques involved to compute the X-ray spectra from ionized wind-blown bubbles. We show initial moderate resolution simulations that demonstrate, given the limitations of our method, our hydrodynamic results are consistent, and in some ways better, than others that have been used to compute the hydrodynamics of wind-bubbles around massive stars. We then outline our technique for calculating the X-ray emission, and show how it improves on the work done by other groups. The exciting fact that our simulated spectra seem to be in reasonable agreement with observations suggests that we are on the correct track. We will follow this work with higher resolution simulations and more detailed X-ray calculations in future papers.
This paper proceeds as follows: In §2 we describe the photoionization code, and in §3 the numerical methods. These are then applied to modelling the medium around a 40 star in §4, and X-ray spectra computed from the models in §5. §6 summarizes our work and outlines future development.
2 AVATAR Code
We have made significant improvements to an earlier version of this code [18]. AVATAR contains a self-consistent method for computing the effects of photo-ionization on circumstellar gas dynamics. The effects of geometrical dilution and column absorption of radiation are considered. The gasdynamic algorithm makes use of a multidimensional covariant implementation of well established Eulerian finite difference algorithms. A second-order (van Leer) monotonic transport algorithm is used for the advection of total mass and the neutral component, and a third order PPA (piecewise parabolic algorithm) scheme is available. Tabulated functions are used to compute the collisional ionization rate and cooling function. Shocks are treated using an artificial viscosity. Grid expansion, which may be required in order to study the flow over distance scales spanning several orders of magnitude, is incorporated. The method operator splits the contribution due to photoionization effects from the usual gas dynamics, and utilizes a backward-Euler scheme together with a Newton-Raphson iteration procedure for achieving a solution. The algorithm incorporates a simplified model of the photo-ionization source, computes the fractional ionization of hydrogen due to the photo-ionizing flux and recombination, and determines self-consistently the energy balance due to ionization, photo-heating and radiative cooling. In this, our method is superior to that of other calculations [13, 14, 15, 16, 22, 21] who use the on-the-spot approximation and do not take recombination into account. It is comparable to the method used by [19].
3 Hydrodynamic Models
We apply the AVATAR code to the computation of the wind-blown bubble around a 40 star. The simulations are carried out on an r- grid in spherical co-ordinates. Runs with varying resolution were computed, with the largest being 600 radial by 400 angular zones. The stellar parameters for the 40 star are adapted from [22]. The star evolves from the MS stage into a red-supergiant (RSG), and finally ends its life as a W-R star before it explodes. Although realistically the stellar parameters are continuously changing, this would make it extremely time consuming to calculate the ionization integrals at every timestep. Therefore the stellar parameters in each phase are assumed constant, as suggested by [22]. In this way the integrals need to be computed only once per stage. In future we will modify this so that we can take the changing mass-loss rates into account, since these are important to study the turbulence and instabilities within the bubble.
Figure 1 shows the density, ionization and temperature of the star during the various stages. The star starts life as a main-sequence (MS) O star, and remains on the MS for about 4.3 million years, with a fast, radiatively-driven wind. In this phase almost the entire bubble is fully ionized (Fig. 1, row 2 column 1). An inhomogeneous pressure and density distribution develops in the MS stage, accompanied by vorticity deposition near the inner shock. The inclusion of photo-ionization results in the formation of a dense, lower temperature ( K) region of ionized material (orange) outside the wind bubble during the MS phase. The nebula is fully ionized, and the ionization front is trapped in the dense shell. The ionization front is unstable to ionization-driven instabilities, reminiscent of Rayleigh-Taylor instabilities, which are also seen in galactic ionization fronts [24]. We also see finger-like projections protruding from the ionized region into the interior, which may be the forerunners of the photo-ionized pillars seen for instance in the Eagle Nebula.
As the star moves off the MS into the red supergiant (RSG) stage, the mass-loss rate increases sharply to almost 10, and the wind velocity drops to about 15 km s-1. Although much of the mass from the star is lost in this stage, the RSG wind fills only a small fraction of the bubble. The surface temperature being much lower, the star is no longer able to ionize the entire region. The ionizing radiation drops considerably and recombination reduces the ionization fraction to 30% in the outer regions (Fig 1, row 2 column 2). As shown in [9], the RSG shell is also unstable. After about 200,000 years in the RSG stage, the star loses its outer envelope and becomes a W-R star, with a fast wind and a mass-loss rate only slightly lower than that in the RSG phase. The high temperature of the W-R star re-ionizes the entire region. The higher momentum W-R wind, due to its high velocity, collides with the dense RSG shell and breaks it up, scattering the dense material into a turbulent W-R nebula.
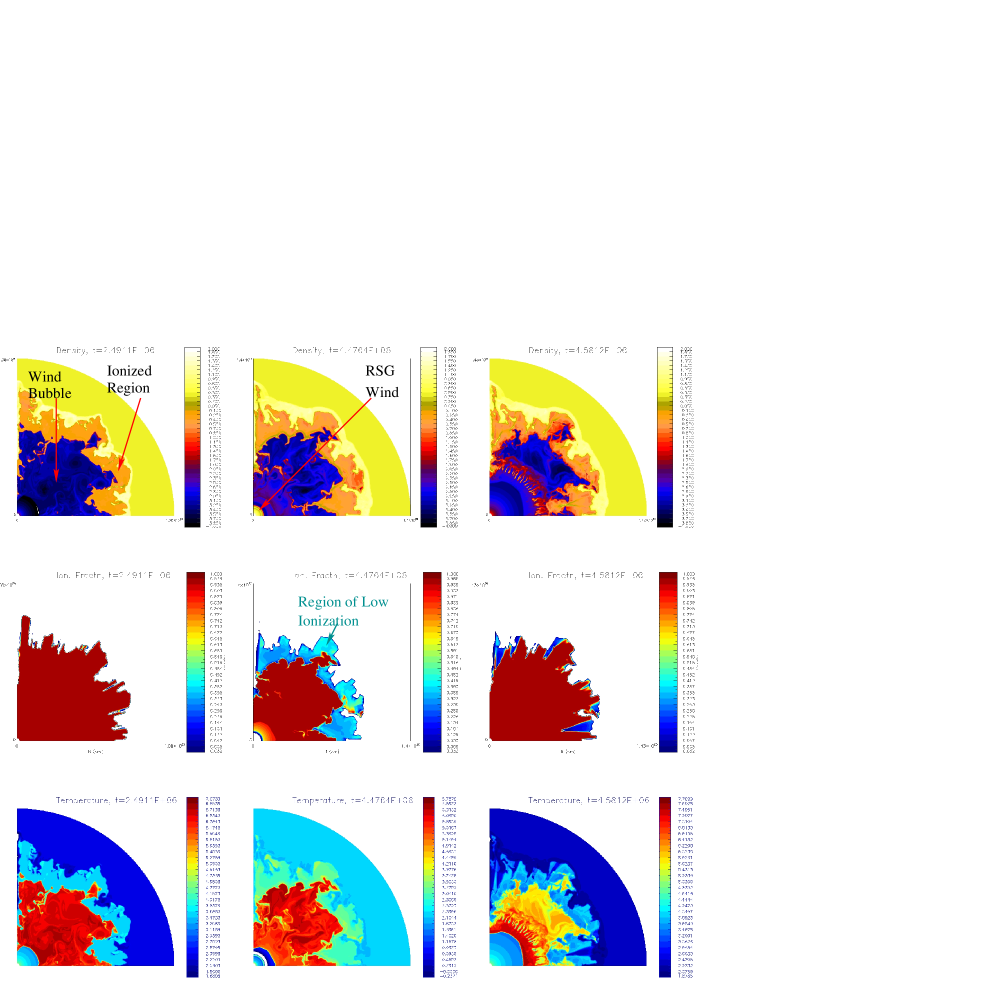
Turbulence within the bubble leads to the formation of vortices in the interior of the bubble in the MS stage, driven by deposition of vorticity at the reverse shock. We are aware that in this 2.5D implementation, fluid that would normally flow across the boundary is funneled along the boundary, leading to spurious jet-like structures along the axes. We have discussed the hydrodynamics due to such structures extensively in a purely hydrodynamical case [10]. We have employed methods such as jiggling the grid in the azimuthal direction by half a grid zone every few timesteps to reduce this noise. It is still present however, we have been unable to eliminate it completely. Notwithstanding, as we have shown and quantified in [10], there are physical reasons for turbulence to be produced in a wind-bubble. Considerably more turbulence is produced due to deposition of vorticity at the inner shock, due to the various instabilities, and the onset of the W-R wind, than due to the numerics. Vorticity deposition at the inner wind termination shock, which is notably aspherical, produces much of the turbulence in the MS stage. In the W-R phase, turbulence is mostly due to the W-R wind interacting with, and breaking up, the RSG shell, the resulting instabilities [9], and mixing of the material. The addition of stellar ionizing photons is the new ingredient in this simulation, which results in ionization front instabilities in the MS stage and therefore adds to the turbulence. Thus while there is some uncertainty near the axes, the turbulence in the bubble is quantifiably real, and not an artifact of the numerics. It is accentuated by the 2D nature of the simulation, since 2D turbulence results in an inverse cascade in energy [10]. The turbulence decreases in the RSG phase. The collision of the W-R and RSG shells leads to a substantial increase in turbulence in the final stages of the bubble, leading to a messy structure into which any subsequent supernova shock wave will expand.
The temperature of the nebula during the evolution is shown in the bottom row of Fig 1. Note how, in the early W-R stage, the temperature is still low in the outer wind-blown bubble. Thermal conduction has been suggested to reduce the temperature (e.g. Zhekov & Park 2011), but our calculations do not show any need for it.
How do our models compare to previous work? The gross features have been outlined in many of the works mentioned in §1, and our models as expected do faithfully reproduce them. Interestingly, our models reproduce multi-dimensional features such as ionization front instabilities, seen in many galactic ionization front models [24] but not mentioned in previous simulations of wind bubbles. The closest work to which our models could be compared are those of [3, 19]. Our 1D models (not shown) agree quite well with their 1D simulations when run with similar parameters, although our resolution of tens of thousands of zones seems much higher. The 2D models shown here are harder to compare without having quantitative data. It is clear that we again reproduce the basic features. Our shock fronts seem sharper and instabilities far more pronounced, although it is not clear whether this is a resolution effect, or merely due to the reproduction of the figures in the papers from Arthur’s group. One thing that our simulations reveal clearly is the recombination of the material in the red-supergiant stage as the surface temperature of the star dramatically decreases, leading to a large decrease in the ionization fraction. This is visible in some of their 1D simulations, but there are no good figures clearly illustrating the evolution of the ionization fraction in their multi-dimensional models. We feel that, while all models reproduce the gross features, our work improves on previous work in terms of capturing the various discontinuities, elucidating the turbulence and instabilities, and understanding the evolution of the ionization fraction.
4 X-ray Emission:
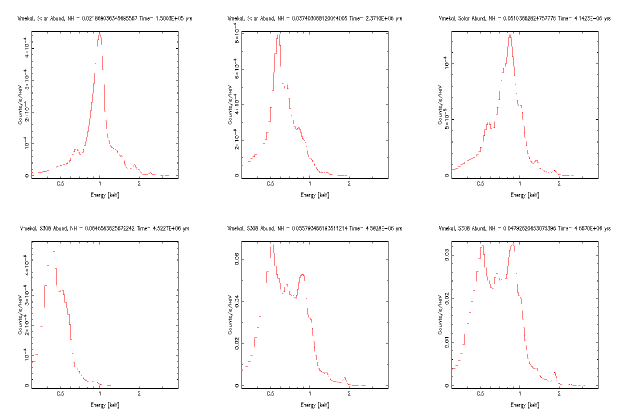
Having computed the structure of the bubble, we proceed to compute the X-ray spectrum from the bubble at each timestep. We use the ISIS package [17] to compute the X-ray emission. The vmekal model in XSPEC, commonly used to fit the observed X-ray spectra [5], is used to model the spectrum, although any other available XSPEC model can be substituted. We have also tried the Raymond-Smith model (vraymond), which gave similar results.
The 2D data are read into ISIS. ISIS calls the appropriate XSPEC routine (default: vmekal) to calculate the spectrum in each cell, using the values of various quantities such as temperature, density, velocity in that cell derived from the hydrodynamic simulations. For the run presented here that means computing the spectrum in each of 240,000 cells. The absorption column beyond that cell is calculated, summed over all cells along the radius, and used to calculate the absorption. The spectra from all cells are then added up, and convolved with the Chandra ACIS instrument response and area functions, for a source distance of 1.5kpc distance, integrated over 50,000 s (Fig 2). Foreground absorption of 2 1020 cm-2 is added to absorption by neutral material surrounding the bubble, which can be as high as 2 1021 cm-2 (total absorption column given on figure title is in units of 1022 cm-2). Line broadening is added based on the underlying fluid velocity, and seems to adequately reproduce the broadening in observed spectra. Solar abundances [1] are used for the MS and RSG stages, while abundances in the W-R phase are from [5] for the W-R bubble S308, one of two W-R bubbles to be detected in diffuse X-rays.
Although no attempt has been made to fit to a specific bubble, the resulting X-ray spectra in the Wolf-Rayet stage do show resemblance to observed X-ray spectra given in [5, 26]. The computed spectra are quite soft, generally peaking at or below 1 keV. In this they resemble those shown by [19], although our spectra show better energy resolution. The spectra in [19] appear to have somewhat similar shape at certain epochs, but much higher counts. Exact comparison is not possible because their spectra are convolved with the instrument response for EPIC/pn on XMM-newton, and the integration time is not given. The emission appears to arise primarily from the denser regions, including the instabilities and resulting dense clumps that are formed. The volume of the emitting region is reduced by the presence of the ionized region surrounding it, and the temperatures are found to be lower due to recombination in the RSG stage. Spectra are calculated in ionization equilibrium. While we have recently developed the capability to carry out non-equilibrium ionization calculations in the case of 1D calculations [11, 6], we are still in the process of expanding this capability to multi-dimensional calculations. Such complexity does not seem to be required to reproduce the observed X-ray spectra, especially given that much of the material in the bubble is over 105 years old. It is possible though that in the early Wolf-rayet stage, when the ionization front due to the Wolf-Rayet star has not crossed the entire bubble, and the W-R wind has not yet filled the bubble, the plasma may not be in ionization equilibrium and more detailed calculations may be needed. We plan to carry these out in future.
5 Summary
Using a code that employs a self-consistent method for computing the effects of photo-ionization on circumstellar gas dynamics, we have modeled the formation of wind-driven nebulae around massive stars. Using various X-ray emission models, we have computed detailed X-ray spectra of simulated wind-blown nebulae from a 40 star, as would be seen with the ACIS instrument on Chandra. Comparing with observed X-ray spectra, we find that at certain epochs of the evolution, our synthetic spectra in the Wolf-Rayet (W-R) stage agree quite well with those obtained from observed W-R nebulae. Unlike other calculations, our detailed spectra indicate that diffuse X-ray emission from most main sequence and W-R nebulae would not be easily observable with currently available X-ray satellites, which is consistent with the observational data [5, 4].
In future we will present calculations for the wind medium around stars of varying initial mass, taking stellar models with rotation and magnetic field into account. We will also compute the X-ray emission using different XSPEC models, study the locations from which the X-ray emission arises, and produce maps showing the cells that are major contributors to the X-ray emission. These can be compared to density and temperature maps to fully understand which regions are the major contributors to the X-ray emission, and why the spectra are so soft.
6 Acknowledgements
VVD’s research was funded by grant TM9-0001X, provided by NASA through the Chandra X-ray Observatory center, operated by SAO under NASA contract NAS8-03060. DLR wishes to acknowledge sponsorship of this work from an NSF cooperative agreement through the University Corporation for Atmospheric Research on behalf of the National Center for Atmospheric Research (NCAR). We are grateful to Dan Dewey for patiently answering our questions and being super helpful in general. We thank the anonymous referee for a critical report that helped to substantially improve the focus of this paper and sharpen the emphasis.
References
- Anders & Grevesse [1989] Anders, E., & Grevesse, N. 1989, GeCoA, 53, 197
- Arthur [2007] Arthur, S. J. 2007, Revista Mexicana de Astronomia y Astrofisica Conference Series, 30, 64
- Arthur [2009] Arthur, S. J. 2009, American Institute of Physics Conference Series, 1156, 285
- Chu et al. [2003] Chu, Y.-H., Gruendl, R. A., & Guerrero, M. A. 2003, Revista Mexicana de Astronomia y Astrofisica Conference Series, 15, 62
- Chu et al. [2003] Chu, Y.-H., Guerrero, M. A., Gruendl, R. A., García-Segura, G., & Wendker, H. J. 2003, ApJ, 599, 1189
- Dewey et al. [2012] Dewey, D., Dwarkadas, V. V., Haberl, F., Sturm, R., & Canizares, C. R. 2012, ApJ, 752, 103
- Dwarkadas [2005] Dwarkadas, V. V. 2005, ApJ, 630, 892
- Dwarkadas [2007] Dwarkadas, V. V. 2007, ApSS, 307, 153
- Dwarkadas [2007] Dwarkadas, V. V. 2007, ApJ, 667, 226
- Dwarkadas [2008] Dwarkadas, V. V. 2008, Physica Scripta Volume T, 132, 014024
- Dwarkadas et al. [2010] Dwarkadas, V. V., Dewey, D., & Bauer, F. 2010, MNRAS, 407, 812
- Frank & Mellema [1994] Frank, A., & Mellema, G. 1994, AA, 289, 937
- Freyer et al. [2003] Freyer, T., Hensler, G., & Yorke, H. W. 2003, ApJ, 594, 888
- Freyer et al. [2006] Freyer, T., Hensler, G., & Yorke, H. W. 2006, ApJ, 638, 262
- Garcia-Segura et al. [1996] Garcia-Segura, G., Langer, N., & Mac Low, M.-M. 1996, AA, 316, 133
- Garcia-Segura et al. [1996] Garcia-Segura, G., Mac Low, M.-M., & Langer, N. 1996, AA, 305, 229
- Houck & Denicola [2000] Houck, J. C., & Denicola, L. A. 2000, Astronomical Data Analysis Software and Systems IX, 216, 591
- Rosenberg [1995] Rosenberg, D. L. 1995, Ph.D. Thesis,
- Toalá & Arthur [2011] Toalá, J. A., & Arthur, S. J. 2011, ApJ, 737, 100
- van Marle et al. [2011] van Marle, A. J., Keppens, R., & Meliani, Z. 2011, Bulletin de la Societe Royale des Sciences de Liege, 80, 310
- van Marle et al. [2006] van Marle, A. J., Langer, N., Achterberg, A., & García-Segura, G. 2006, AA, 460, 105
- van Marle et al. [2005] van Marle, A. J., Langer, N., & García-Segura, G. 2005, AA, 444, 837
- Weaver et al. [1977] Weaver, R., McCray, R., Castor, J., Shapiro, P., & Moore, R. 1977, ApJ, 218, 377
- Whalen & Norman [2008] Whalen, D. J., & Norman, M. L. 2008, ApJ, 672, 287
- Wrigge et al. [2005] Wrigge, M., Chu, Y.-H., Magnier, E. A., & Wendker, H. J. 2005, ApJ, 633, 248
- Zhekov & Park [2011] Zhekov, S. A., & Park, S. 2011, ApJ, 728, 135