Dust in a Type Ia Supernova Progenitor: Spitzer Spectroscopy of Kepler’s Supernova Remnant
Abstract
Characterization of the relatively poorly-understood progenitor systems of Type Ia supernovae is of great importance in astrophysics, particularly given the important cosmological role that these supernovae play. Kepler’s Supernova Remnant, the result of a Type Ia supernova, shows evidence for an interaction with a dense circumstellar medium (CSM), suggesting a single-degenerate progenitor system. We present 7.5-38 m infrared (IR) spectra of the remnant, obtained with the Spitzer Space Telescope, dominated by emission from warm dust. Broad spectral features at 10 and 18 m, consistent with various silicate particles, are seen throughout. These silicates were likely formed in the stellar outflow from the progenitor system during the AGB stage of evolution, and imply an oxygen-rich chemistry. In addition to silicate dust, a second component, possibly carbonaceous dust, is necessary to account for the short-wavelength IRS and IRAC data. This could imply a mixed chemistry in the atmosphere of the progenitor system. However, non-spherical metallic iron inclusions within silicate grains provide an alternative solution. Models of collisionally-heated dust emission from fast shocks ( 1000 km s-1) propagating into the CSM can reproduce the majority of the emission associated with non-radiative filaments, where dust temperatures are K, but fail to account for the highest temperatures detected, in excess of 150 K. We find that slower shocks (a few hundred km s-1) into moderate density material ( cm-3) are the only viable source of heating for this hottest dust. We confirm the finding of an overall density gradient, with densities in the north being an order of magnitude greater than those in the south.
Subject headings:
stars: AGB and post-AGB — ISM: supernova remnants — dust, extinction1. Introduction
Kepler’s supernova remnant (SNR) is the remains of the supernova (SN) of 1604 A.D., the third youngest known Galactic SNR, after G1.9+0.3 and Cas A. There is general consensus that Kepler resulted from a Type Ia SN, albeit one with an unusually dense circumstellar medium (CSM) (Blair et al. 2007, and references therein; hereafter B07), evidenced by the extreme densities observed around Kepler ( cm-3), which, at pc out of the galactic plane, should have surrounding densities of cm-3 (McKee & Ostriker, 1977), as well as the nitrogen overabundance seen in optical spectra (Blair et al., 1991), and high ( km s-1) blueshift. Reynolds et al. (2007) have suggested that Kepler may be a member of an emerging class of “prompt” Type Ia SNe, evolving from the main-sequence to SN in yr. The distance to Kepler was determined by Sankrit et al. (2005) to be 3.9 kpc, although other estimates range from 3.3 kpc (Katsuda et al., 2008) to kpc (Chiotellis et al., 2012).
There is much debate in the general supernova literature about the progenitor systems of Type Ia SNe, particularly as to whether they result from single-degenerate systems (the explosion of a white dwarf that has accreted matter close to the Chandrasekhar limit of from a companion) or double-degenerate (the merger of two sub-Chandrasekhar mass white dwarfs). H emission from non-radiative shocks is seen at the periphery of the remnant, as we show in Figure 1. In the case of Kepler, the high densities and presence of hydrogen in the CSM favor a single-degenerate scenario, since a double white dwarf system, even if it could eject a dense CSM, should not eject one rich in H. Furthermore, the presence of dust in the CSM implies that the companion star was an AGB star, since a main-sequence companion should not produce any significant quantity of dust. Chiotellis et al. (2012) suggested that Kepler resulted from a white dwarf explosion in a symbiotic binary, and is expanding into the dense AGB wind from the progenitor system.
As the only known Type Ia SNR encountering the wind from its pre-SN system, Kepler offers a unique opportunity to study the mass-loss from evolved progenitor stars. AGB stars are typically classified as O-rich or C-rich, with O-rich stars producing silicate dust and C-rich stars producing carbonaceous dust in their outflows (Guha Niyogi et al., 2011). Through the interaction of Kepler’s forward shock with this material, we can constrain the type of star present in the progenitor system. The dust in Kepler is known to be dominated by silicate grains (Douvion et al., 2001), implying formation in an O-rich AGB star.
The formation of dust in O-rich stars is still not entirely understood; here is one promising scenario. Large, transparent silicate grains form close to the stellar photosphere, within two stellar radii. These are magnesium rich silicates, without iron (Norris et al., 2012). As these grains are driven outward by the stellar radiation pressure, temperatures fall and metallic iron condenses onto the grains, forming “dirty silicates” with substantial opacity at optical and near-IR wavelengths (Kemper et al., 2002). This scenario has been confirmed in the laboratory by the identification of circumstellar grains among GEMS (glass with embedded metal and sulfides) grains; 1-6% of GEMS grains are of circumstellar origin (Keller & Messenger, 2011). However, the question then becomes one of how the presence of a white-dwarf companion can modify this process, both before and after the supernova.
Prior to the explosion, accreting white dwarfs produce significant amounts of energetic radiation and shocks, quite possibly enough to dissociate molecules along the dust condensation sequence (Bujarrabal et al., 2010). In an O-rich star, all C is locked up into CO, but this dissociation (either via radiation or shocks) can also affect CO molecules, leading to a mixed C/O chemistry in the outer dust formation zone. This has been observed in planetary nebulae (Guzmán-Ramírez et al., 2011), and carbonaceous grains have also been detected amongst silicate-rich dust in the symbiotic binary system CH Cyg (Schild et al., 1999).
After the SN, the forward shock from the explosion will race through the surrounding medium at several thousand km s-1, heating the gas to temperatures of K. This hot plasma will heat grains present in the CSM, destroying them via sputtering in the process (Dwek & Arendt, 1992).
In B07, we reported Spitzer imaging of Kepler, confirming the presence of dense material ahead of the shock along with the existence of a density gradient in the north-south direction, and placed an upper limit of of dust present. Here, we report followup observations with Spitzer’s Infrared Spectrograph (IRS), to study the processes listed above in the context of an SNR, and show how the data can be interpreted in the context of the wind from a pre-SN AGB star. Since Kepler’s SNR represents the only known opportunity to study dust in the CSM surrounding a Type Ia SN, any characterization of the dust properties could have an impact on the light echoes observed from Type Ia SNe (Patat et al., 2006).
2. Observations
We observed Kepler’s SNR on 2009 March 29 with both orders of the long-wavelength (14-38 m), low-resolution (LL) IRS module and order 1 (7.5-14 m) of the short-wavelength, low-resolution (SL) instrument. Both have a wavelength-dependent spectral resolving power of . The entire remnant was mapped with the LL instrument, while selected regions were mapped with the SL module. The LL map consisted of four 30s cycles per position, with a step size in the perpendicular direction of after each 120s observation. A total of 29 pointings in the perpendicular direction were necessary. We then shifted the slits in the parallel direction by and repeated the process to cover the entire remnant with sufficient background.
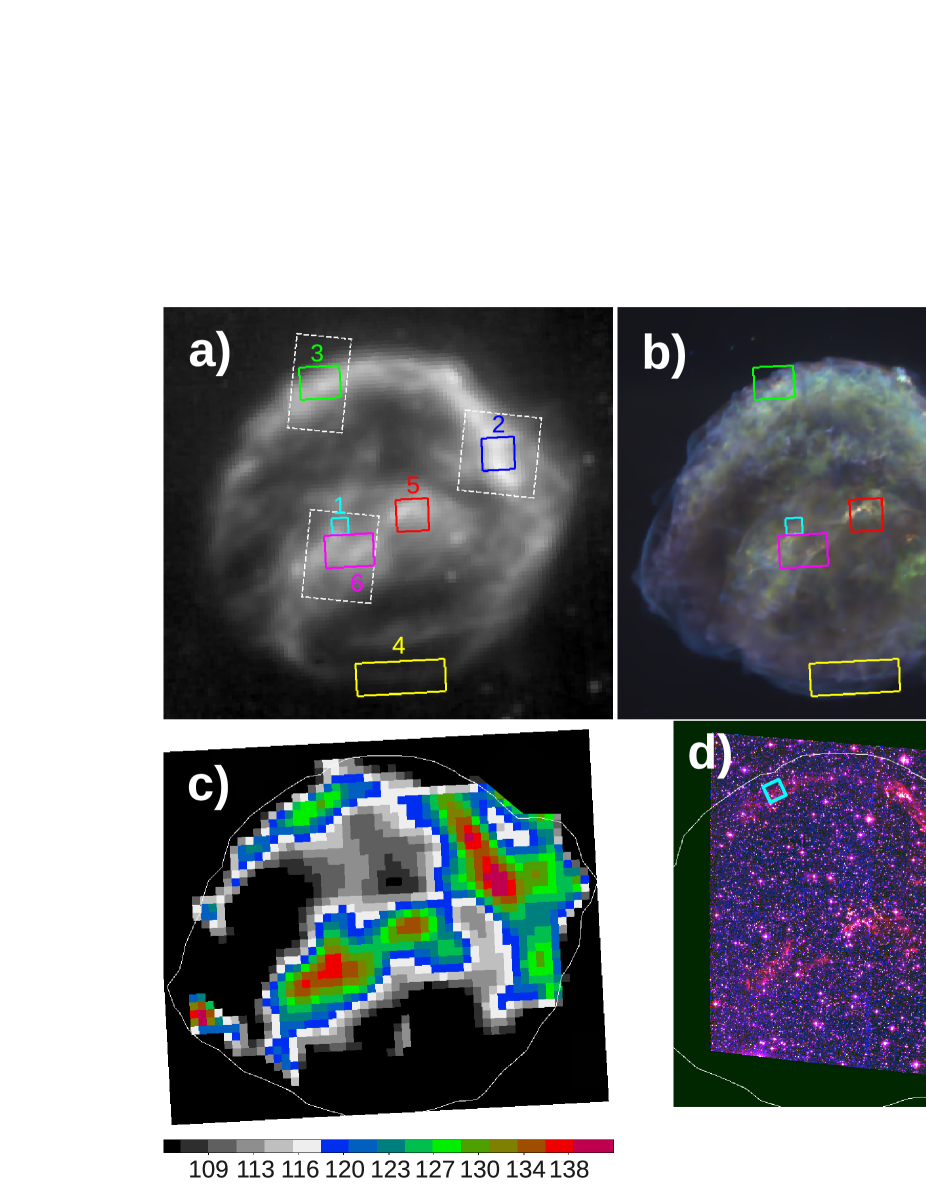
The three SL maps consisted of observations of varying depth to avoid saturation. The center-east knots were observed with 22 pointings, each with five cycles of 60s duration, yielding a total map size of . The north rim position was covered with 17 pointings (seven 60s cycles each), for a total map size of . The northwest position, by far Kepler’s brightest region, was observed in 25 pointings (five 14s cycles each), for a total map size of . A step size in the perpendicular direction of was used. The outline of the SL maps is shown on Figure 1a.
The LL map allows creation of a three-dimensional (two spatial and one wavelength) data cube using the IRS contributed software CUBISM11footnotemark: 1 (Smith et al., 2007), which allows spectral extraction from any rectangular region. The pixel size of the LL IRS instrument is , but Spitzer’s point-spread function is at wavelengths m. Thus, we require a minimum region size of a 2x2 pixel square (10.2′′x10.2′′) when extracting LL spectra, with the additional requirement that any 2x2 pixel square falls within one IRS slit position, i.e. the two pixels do not fall on different slit pointings. For the background, we use an average of four off-source slit pointings (two north of the remnant, two south). The mid-IR background surrounding Kepler is highly uniform.
Extracting a full spectrum from 14 to 38 m requires matching of orders 1 & 2. The flux levels of these orders generally did not match perfectly, despite being extracted from identical regions. However, since we are only interested in the shape of the spectra (see Section 3), we adjust the levels of the two orders to match, using the order overlap of 19.5-21.3 m. The relative offset, a product of the inherent calibration uncertainties for each order of IRS22footnotemark: 2, varied from 5% to 30%, depending on the region.
The short wavelength end of LL order 1 (22-25 m) contains a consistent noise pattern of regularly-spaced spikes, present in every spectrum. We used every Spitzer IRS data reduction program available, but all efforts to remove these fringes were unsuccessful. However, they have no discernible effect on the models fits discussed in Section 3, and we leave them in the data shown.
3. Results and Discussion
The spectral variation from place-to-place in Kepler is significant. In Figure 1, we show both the 24 m Multi-band Imaging Photometer for Spitzer (MIPS) image of Kepler and the Chandra X-ray image, overlaid with six different spectral extraction regions, the spectra from which are shown in Figure 2. The exact locations of these six regions are given in Table 1. Along the north and south rims (regions 3 and 4), spectra show a dust-dominated continuum with no lines, while in the NW (region 2), lines from low-ionization state ions are present, the only place in the remnant where emission lines are prominent. This corresponds to the brightest region of radiative shocks seen in the optical (Blair et al., 1991). Modeling of collisionally-heated dust grains in the postshock environment provides strong constraints on the gas density (Borkowski et al., 2006; Williams et al., 2006), but aside from a brief discussion in Section 3.2, we defer detailed spatial mapping of densities to a future publication.
3.1. Dust Temperature
Determining dust temperatures in SNRs is complex, since different grain sizes will be heated differently, with the smallest grains undergoing extreme temperature fluctuations on short timescales. However, we can make some simplifying assumptions and create a proxy representative of temperature, in the same way that “color temperatures” are defined for stars. We created two narrowband images of Kepler in spectral regions away from lines or strong dust features (m and m), and divided these images to make a ratio map. The value of the ratio at each image pixel was fit to a model of silicate dust at a single temperature, assuming a grain size of 0.05 m. The output is shown in Figure 1c. Grain “temperatures” ranged from K to K, a high temperature for SNR dust.
We made simple estimates of heating by UV photons from the radiative shocks propagating into modest CSM densities. Specifically, we consider the case of a shock of 500 km s-1 encountering a medium of cm-3, and assume that 100% of the kinetic energy of the shock is converted into radiation (this clearly provides an upper limit, as such an approximation is unphysical). The radiation energy density from this shock would be ergs cm-3. Using the formulae provided in Draine (2011), a radiation field of this magnitude will heat typical ISM grains of radius 0.1 m to only K, far too low to account for dust seen in Kepler. Collisional heating from hot gas in shocks is far more efficient in most SNRs (Draine & Salpeter, 1979). There is a range of shock speeds in Kepler, from the km s-1 radiative shocks in the NW to the km s-1 non-radiative shocks in the south rim. The latter, encountering the lowest density material ( 1-5 cm-3, B07) are capable of heating dust to 75-100 K. However, if we assume pressure equilibrium, i.e., is constant, then slower shocks of a several hundred km s-1 should be encountering material with densities of 50 to several cm-3. We use the grain heating models described in Borkowski et al. (2006) and Williams et al. (2011) to examine the effects of collisional heating on grains in these slower shocks. Briefly, grains are heated via collisions with hot ions and electrons in the post-shock gas, with final grain temperatures being a function of both the plasma temperature and density. Shocks such as these can collisionally heat grains to K.
3.2. North-South Density Gradient
Kepler’s north limb is significantly brighter than the south across the EM spectrum. In B07, we attributed this to the northern shock encountering material 4-9 times denser than that in the south. Katsuda et al. (2008) measured the proper motions of X-ray emitting filaments around the periphery, finding that shock velocities in the northern filaments were 1.5-3 times slower than in the south, implying a density ratio of 2-9.
We extracted IR spectra from near the locations where proper motions were measured. Spectra of collisionally-heated dust are most sensitive to the post-shock gas density, and by making reasonable assumptions about the ion and electron temperature, we can fit a spectral model where density is the only free parameter. We assume pure silicate dust and use a minimization algorithm to fit the spectra from 21 to 33 m, which we have found (Williams et al., 2011) to be the most reliable region of the spectrum to fit to obtain a gas density. In the non-radiative sections of the north rim (region 3), we use the values derived in B07 of keV and keV, obtaining a post-shock density of cm-3, with a reduced of 1.3 (values in parentheses are the 90% confidence limits, but represent only the statistical errors on the fit). In this model, of the dust is destroyed via sputtering, roughly consistent with our initial modeling of the MIPS data in B07.
In the southernmost rim (region 4), X-rays are dominated by nonthermal emission, and determining the plasma temperature is difficult. Using the same temperatures as above, we find cm-3. However, it is likely, given the high shock speeds and low densities, that far less temperature equilibration has taken place between the ions and electrons (Ghavamian et al., 2007). If we thus assume an ion temperature of 50 keV, allowing for heating of electrons through Coulomb collisions alone, we derive a density of cm-3 (reduced = 0.99). Only 10% of the dust is destroyed via sputtering in this region, owing to the much lower gas densities. We show the fits from both regions, 3 & 4, in Figure 3. Slightly farther south, in the region that in X-rays is dominated by thin, synchrotron emitting filaments (Reynolds et al., 2007), we find a weak dust continuum that is best fit with a density of 1 cm-3. At Spitzer’s resolution, it is difficult to determine if this continuum is real or simply due to the wings of the point-spread function from the brighter emission just above. Thus, we consider cm-3 to be an upper limit for the southernmost rim. The addition of graphite grains to these models (see Section 4) increases the derived densities by %, but the overall density gradient is unchanged.
3.3. Silicate Dust
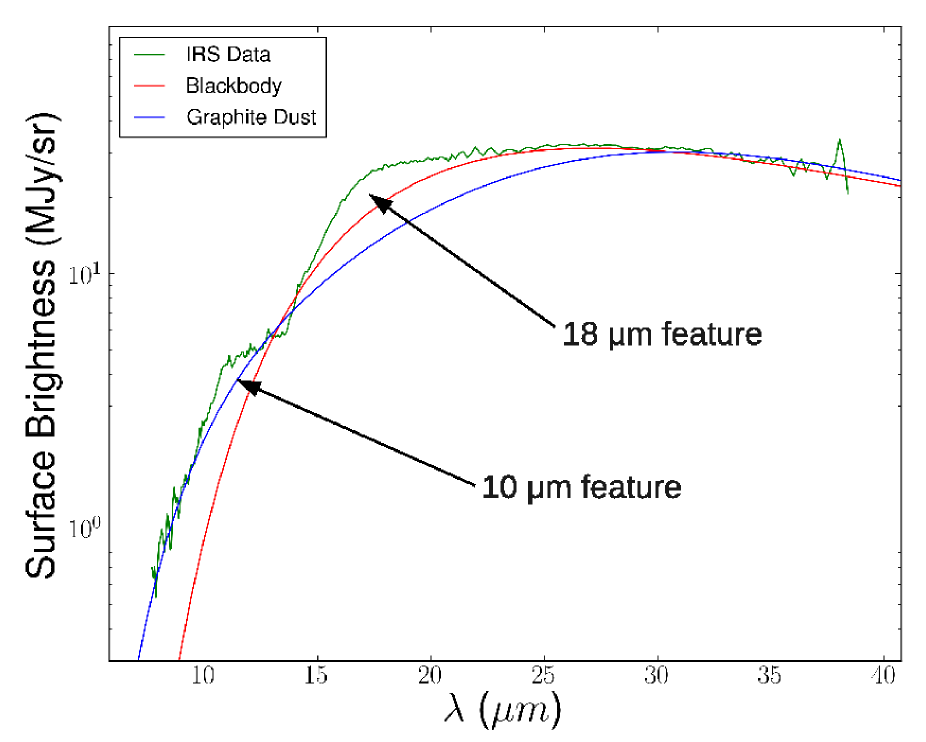
Strong features, most easily attributable to silicate dust, exist in the spectra shown in Figures 2-5 at and 18 m. In Figure 4, we show the total 7.5-40 m spectrum from region 3, overlaid with two different model fits to the data: a simple blackbody model (T K) and an emission model for graphite grains. The broad emission features, visible in the data at m and m are easily seen in excess of either of these two models. While these silicate features are often observed in absorption in cold dust of the ISM, they are routinely observed in emission in places where dust is warm, such as SNRs (Rho et al., 2008; Dwek et al., 2010) or the optically-thin dust shells of O-rich AGB stars with moderate mass-loss rates (Guha Niyogi et al., 2011). Douvion et al. (2001) first identified these features in Kepler in Infrared Space Observatory spectra, reporting that they could be fit with standard silicate dust with optical constants from Draine & Lee (1984). We find no evidence for silicate absorption features anywhere in the remnant.
On the smallest measurable scales (), a peculiar feature is present in the spectra of about two dozen regions within the remnant. In these regions, the 18 m silicate feature appears to be so strong that it peaks above the level of the continuum, dipping back down sharply on the long wavelength side. An example of a spectrum like this is shown in the upper left panel of Figure 2. We have no complete explanation for this feature. When slightly larger spatial extraction regions are used, the feature disappears. We examined the individual spectral observations that went into making the cube using SPICE, the Spitzer Custom Extraction Software, to search for evidence of the feature’s existence, and found that the appearance and disappearance of the feature depended entirely on the spectral extraction method used. The effect is strongest in regions of the remnant where strong gradients in the IR surface brightness exist. Because of this, we believe it is most likely that it is an artifact of the spectral extraction algorithms used by CUBISM on the smallest spatial scales, and not an absorption feature or abnormally strong unknown emission feature.
3.3.1 Possible Ejecta Dust?
Two possibilities exist for the dust seen in Kepler: newly formed ejecta dust or dust created in the AGB wind of the progenitor system. Ejecta dust is typically associated with core-collapse SNe, but recent theoretical work by Nozawa et al. (2011) has shown that it may be possible for up to 0.2 of dust to form in the ejecta of Type Ia SNe. However, to date, there have been no detections of ejecta dust firmly associated with Type Ia SNe. Gomez et al. (2012) report a small amount () of dust detected in Herschel observations (comparable to what we found in B07), and mention the possibility that they cannot rule out, based on their Herschel data alone, a contribution from ejecta dust, but they do not claim detection.
Since the first detection of ejecta dust in a Type Ia SNR would be of extreme interest, we have searched extensively for any signs of it in Kepler. We have gone about this in two ways. First, Burkey et al. (2012) separate the X-ray data from Chandra (Reynolds et al., 2007) into regions dominated by ejecta emission, thermal CSM emission, and nonthermal synchrotron radiation. A detailed morphological comparison between these data and ours shows no obvious evidence for a correlation between IR emission and X-ray ejecta dominated regions. While we cannot rule out an ejecta dust contribution to the IR spectra (complications from projection effects cannot be ignored), it does not appear to be significant.
Secondly, another comparison can be made between the location of dust emission and the emission line maps produced by CUBISM, a technique used for a spectroscopic study of Cas A by Rho et al. (2008), where they use [Fe II] and other emission lines. Kepler is times fainter than Cas A and the maps produced are of much lower signal-to-noise, and the [Fe II] lines, which can come from either ejecta or shocked or photo-ionized gas are the only ones strong enough to make a spectral map. The [Fe II] emission line maps at 17.9 and 26 m show clear emission from several regions in Kepler, but again, no obvious correlation exists between the regions of strong line emission and peculiar dust spectral features, as is the case in Cas A. Again, while we cannot rule out an ejecta dust component to the IR spectra, we unfortunately have no direct evidence for it.
Lastly, as we point out in B07, there is a clear morphological similarity between dust emission seen with all of Spitzer’s instruments (the Infrared Array Camera; IRAC, MIPS, and IRS) and the H emission shown in Figure 1. Since this H emission is associated with the non-radiative shocks at the shock front, we conclude that the dust is associated with the swept-up CSM.
3.3.2 CSM Dust
It thus appears that the shock is primarily encountering dust formed in the outflow from the progenitor system, either the precursor star itself or the donor. AGB stars produce a slow, dense wind that is ideal for the formation of grains. The thermodynamic condensation sequence for dust formation in the atmosphere of an O-rich AGB star is complex and not fully understood (see Section 1), but the end result in high mass-loss rate outflows is a significant amount of amorphous silicate dust that we also see in Kepler (Waters, 2011).
While it is clear that projection effects ensure that the spectra in Kepler sample regions of differing temperature, density, and composition, we can nonetheless arrive at some general conclusions even without detailed modeling. First, the spectra from the central knots, shown in Figure 2, are remarkably similar to the spectrum from the north rim, consistent with the hypothesis that emission from these central knots results from CSM dust. Second, although the overall shape of the continuum at long wavelengths is relatively well-fit, the 18 m silicate feature is not well-fit with the astronomical silicate model of Draine & Lee (1984), which places the centroid of the feature at m. The silicate features seen in the spectra of Kepler in the north, northwest, and central knots are centered at m. This is most easily seen in Figure 3, where a fit to the long-wavelength spectrum of region 3 significantly underpredicts emission from 15-18 m. To further test this conclusion, we follow the technique of Guha Niyogi et al. (2011) of fitting a blackbody model to the underlying continuum (using a least-squares routine) and dividing this out of the spectrum. What remains is the absorption efficiency of the silicate dust grain as a function of wavelength. While the 10 m feature is in the correct place (to the extent that our short-wavelength data will allow us to determine this), the 18 m feature is not, and is much closer to 17 m. We find no dust temperature at which the optical constants of Draine & Lee (1984) can account for the features observed. This may point to a different chemistry within the silicate grains. This is perhaps not entirely surprising, as there are systematic differences between CSM and ISM silicates features (Ossenkopf et al., 1992). Furthermore, a great variation in silicate features is seen in AGB outflows (Henning, 2010), suggesting marked differences in physical and chemical properties among CSM grains. We also note that a similar mismatch of the 18 m feature was observed in the central region of M81 (Smith et al., 2010), where the feature peaks at 17.2 m. The authors there found a better (but far from perfect) match when using the dielectric function of amorphous olivine as measured in a laboratory by Dorschner et al. (1995). But distinguishing among various types of silicates in Kepler is a difficult task that requires separate efforts involving more sophisticated spectral modeling and reliance on more extensive laboratory measurements (see Speck et al. (2011) for recent experimental studies of amorphous silicates).
We find no indication of the strong spectral features produced by crystalline silicate particles, such as those seen in the spectra around cool, evolved O-rich stars (Morris, 2008; Henning, 2010). These features are generally most prominent in high mass-loss rate ( yr-1) AGB outflows, so it is possible that the mass-loss rate of the progenitor system of Kepler was not extreme. But crystalline silicates may be common as well at low mass-loss rates, just harder to detect (e.g., see de Vries et al. 2010 and references therein), and the signal-to-noise ratio in Kepler may make any such detection impossible. Crystalline silicates are rarely detected in SNR (for a counter-example where they are detected, see Koo et al. (2011) and compare the spectra from MSH 15-52 to that from Kepler), and a likely explanation for this is that impacts with thermal ions amorphize crystalline silicates, changing their chemical structure. For the fast non-radiative shock in the north of Kepler, with keV and cm-3, the time required for the complete amorphization is only several years for grains m in radius, based on critical proton and particle doses in Glauser et al. (2009). In the south, densities are an order of magnitude lower than in the north, and the amorphization timescale is inversely proportional to density. Crystalline silicates might survive under these conditions, but again, would be harder to detect because of low IR fluxes. Crystalline material might also survive in cores of large grains, shielded from energetic ions by overlying amorphized surface layers, particularly in slow shocks driven into the dense CSM where ions do not have enough energy to penetrate into grain cores. Glauser et al. (2009) showed that such partially crystalline grains can still produce detectable crystalline emission features, but we see no evidence for them in Kepler.
4. The Near-IR Excess
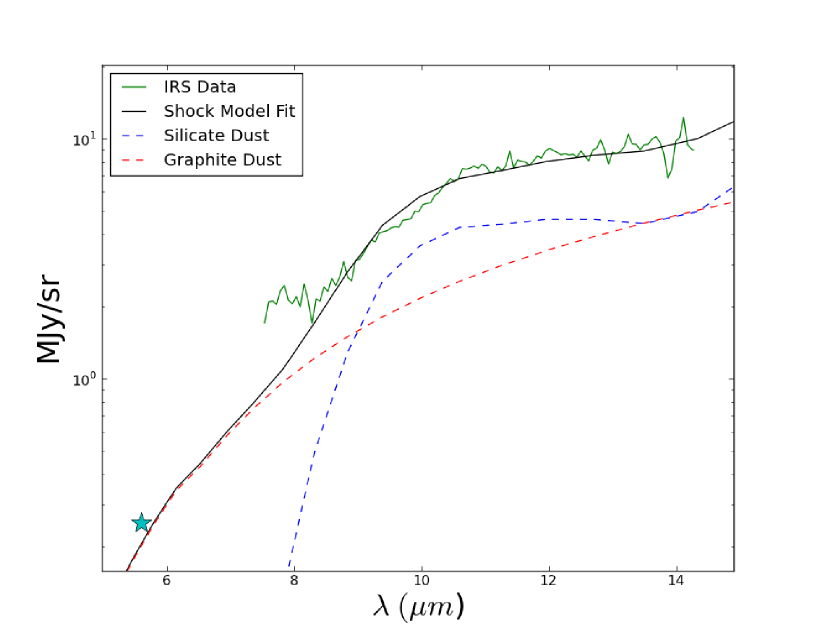
Since dust in Kepler exhibits prominent silicate emission features, it must have condensed in a stellar outflow with dominant O-rich chemistry (C/O ratio ). However, perhaps the most intriguing spectral feature of Kepler is that while the spectra are clearly dominated by silicate grains, these alone cannot account for the short-wavelength data, including the IRAC fluxes. We use IRAC data obtained as part of our earlier survey of Kepler with both IRAC and MIPS (PI W. Blair, program ID 3413, see B07). We show this in Figure 5, the IRS short-low spectrum from the bright NE knot (rectangular region in Figure 1d). This NE knot is not unique; other locations in Kepler show a similar near-IR excess. A local background, subtracted from both sides of the knot, was used to highlight the hottest dust. For the IRAC data, we measured the flux from an identical region (CUBISM allows creation of region files that can be read by ds9) at 5.6 and 8.0 m. The 8 m flux was roughly consistent with the IRS data, and thus does not provide an additional constraint, but the 5.6 m flux provides a strong confirmation of the near-IR excess. At 3.6 and 4.5 m, Kepler is too faint and the knot is undetected.
A model fit to the data with pure silicates underpredicts the IRAC 5.6 m emission by two orders of magnitude. This near-IR excess cannot be explained by synchrotron emission, nor by an additional hot silicate component. This near-IR excess has been a long-standing issue in observations of both the ISM and envelopes around late-type stars (Ossenkopf et al., 1992). An additional component of graphite dust provides a better explanation than pure silicates, as shown in Figure 5 (though the fit is far from perfect at the shortest wavelengths), which results from a shock model ( km s-1, cm-3) of collisionally-heated dust, where silicates and graphites are assumed to have a power-law size distribution () from 1 nm to 0.5 m and a mass ratio of silicates to graphites of two. Such a model, which still underpredicts the observed emission, requires a mixed C/O chemistry in the AGB progenitor system. This is possible in rare S-type AGB stars where (Ferrarotti & Gail, 2002). Mixed C/O chemistry can operate in S stars if shocks are generated within their winds by stellar pulsations, leading to formation of both carbonaceous and silicate grains (Cherchneff, 2006; Smolders et al., 2010). If dust in Kepler was produced by an S-type AGB star, this might explain the presence of silicates together with carbonaceous grains. Unfortunately, we are unable to determine the C/O ratio from UV and X-ray observations because of the high interstellar absorption towards the remnant.
We also consider more common M-type () AGB outflows, where in single stars nearly all C is locked in CO molecules. In a single-degenerate Type Ia progenitor system, an accreting white dwarf produces energetic UV/X-ray radiation, and thermonuclear outbursts drive shocks into the ambient CSM. A fraction of CO molecules can be dissociated by shocks or energetic photons in the dust-forming regions in these systems (Bujarrabal et al., 2010). This creates favorable conditions for formation of carbonaceous dust even if . While quantitative models of carbonaceous dust formation in O-rich symbiotic systems are lacking, Guzmán-Ramírez et al. (2011) demonstrate how energetic photons can lead to mixed carbon-oxygen chemistry in O-rich outflows of Galactic bulge planetary nebulae. Their models show that formation of hydrocarbon molecules, precursors to PAHs and hydrogenated carbonaceous dust, is more efficient at larger ratios.
However, the near-IR excess could also be produced by metallic iron (or various iron oxides). A similar near-IR excess, with respect to models of pure silicate dust, was found by Kemper et al. (2002) in their study of the O-rich AGB star OH 127.8+0.0. They examined the chemical abundances of various materials likely to be present in AGB atmospheres, considering several potential (non-carbonaceous) dust species that could form in addition to silicates, finding that non-spherical metallic Fe inclusions within the silicate particles of (by mass) could best account for the 3-8 m continuum. Such grains have recently been identified in terrestrial laboratory samples by Keller & Messenger (2011), who conclude, based on their isotopic compositions, that some of these grains could originate from AGB stars. By comparing the dust mass absorption coefficients (Kemper et al., 2002) for these “dirty silicates” to the near-IR excess we see in Kepler, we find that a similar amount of non-spherical Fe-inclusions ( by mass) in amorphous silicate particles can account for the IRAC 5.6 m flux. This model does not require a mixed C/O chemistry in the progenitor system. This is also true of other possible models with separate populations of non-silicate Fe-bearing grains (e.g., see models of Dwek et al. (2010) for SN 1987A which shows a similar near-IR excess).
5. Summary
While other remnants of Type Ia SNe at comparable ages to Kepler are interacting with ISM (Williams et al., 2011), Kepler is unique in interacting with CSM, providing a laboratory to study the interaction of the forward shock with the material ejected by the progenitor system during its AGB phase (Chiotellis et al., 2012). While Kepler is roughly spherical in shape, we find more than an order of magnitude density contrast between the northern and southern rims. The strong silicate features observed here are indicative of the wind from an O-rich AGB star. However, there is clear evidence in the short-wavelength emission for an additional dust component, with either carbonaceous dust or metallic-Fe inclusions within amorphous silicates providing a possible explanation. The presence of carbonaceous grains would imply a mixed oxygen-carbon chemistry in the progenitor system. There is no morphological evidence for newly-formed ejecta dust. Small scale studies of the silicate features seen here, the 9.7 m feature in particular, will be an excellent observational goal for future IR telescopes, such as the James Webb Space Telescope, which can search for crystalline silicates and help distinguish between carbonaceous and iron grains.
References
- Blair et al. (1991) Blair, W.P., Long, K.S., & Vancura, O. 1991, ApJ, 366, 484
- Blair et al. (2007) Blair, W.P., Ghavamian, P., Long, K.S., Williams, B.J., Borkowski, K.J., Reynolds, S.P., & Sankrit, R. 2007, ApJ, 662, 998
- Borkowski et al. (2006) Borkowski, K.J., et al. 2006, ApJ, 642, L141
- Bujarrabal et al. (2010) Bujarrabal, V., Mikołajewska, J., Alcolea, J., & Quintana-Lacaci, G. 2010, A&A, 516, A19
- Burkey et al. (2012) Burkey, M.T., et al. 2012, in preparation
- Cherchneff (2006) Cherchneff, I. 2006, A&A, 456, 1001
- Chiotellis et al. (2012) Chiotellis, A., Schure, K.M., & Vink, J. 2011, A&A, 537, 139
- Draine (2011) Draine, B.T. 2011, Physics of the Intstellar and Intergalactic Medium, Princeton Univ. Press
- de Vries et al. (2010) de Vries, B. L., Min, M., Waters, L. B. F. M., Blommaert,J. A. D. L., & Kemper, F. 2010, A&A, 516, A86
- Dorschner et al. (1995) Dorschner, J., Begemann, B., Henning, T., Jager, C., & Mutschke, H. 1995, A & A, 300, 503
- Douvion et al. (2001) Douvion, T., Lagage, P.O., Cesarsky, C.J., & Dwek, E. 2001, A&A, 373, 281
- Draine & Salpeter (1979) Draine, B.T., & Salpeter, E.E. 1979, ApJ, 231, 438
- Draine & Lee (1984) Draine, B.T., & Lee, H.M. 1984, ApJ, 285, 89
- Dwek & Arendt (1992) Dwek, E. & Arendt, R.G. 1992, ARA&A, 30,11
- Dwek et al. (2010) Dwek, E., et al. 2010, ApJ, 722, 425
- Ferrarotti & Gail (2002) Ferrarotti, A. S., & Gail, H.-P. 2002, A&A, 382, 256
- Ghavamian et al. (2007) Ghavamian, P., Laming, J.M., & Rakowski, C.E. 2007, ApJ, 654, 69
- Glauser et al. (2009) Glauser, A. M., et al. 2009, A&A, 508, 247
- Gomez et al. (2012) Gomez, H.L., et al. 2012, MNRAS, 420, 3557
- Guha Niyogi et al. (2011) Guha Niyogi, S., Speck, A.K., & Onaka, T. 2011, ApJ, 733, 93
- Guzmán-Ramírez et al. (2011) Guzmán-Ramírez, L., Zijlstra, A. A., Níchuimín, R., Gesicki, K., Lagadec, E., Millar, T. J., & Woods, P. M. 2011, MNRAS, 414, 1667
- Henning (2010) Henning, T. 2010, ARA&A, 48, 21
- Katsuda et al. (2008) Katsuda, S., Tsunemi, H., Uchida, H., & Kimura, M., ApJ, 689, 225
- Keller & Messenger (2011) Keller, L.P. & Messenger, S. 2011, GeCoA, 75, 5336
- Kemper et al. (2002) Kemper, F., de Koter, A., Waters, L.B.F.M., Bouwman, J., & Tielens, A.G.G.M. 2002, A&A, 384, 585
- Koo et al. (2011) Koo, B.-C., et al. 2011, ApJ, 732, 6
- McKee & Ostriker (1977) McKee, C.F. & Ostriker, J.P. 1977, ApJ, 218, 148
- Morris (2008) Morris, P.W. 2008, in: IAU Symposium, vol. 250, p. 361
- Nozawa et al. (2011) Nozawa, T., Maeda, K., Kozasa, T., Masaomi, T., Nomoto, K., & Umeda, H. 2011, ApJ, 736, 45
- Norris et al. (2012) Norris, B.R.M., Tuthill, P.G., Ireland, M.J., Lacour, S., Zijlstra, A.A., Lykou, F., Evans, T.M., Stewart, P., & Bedding, T.R. 2012, Nature, 484, 220
- Ossenkopf et al. (1992) Ossenkopf, V., Henning, Th., & Mathis, J.S. 1992, A&A, 261, 567
- Patat et al. (2006) Patat, F., Benetti, S., Cappellaro, E., & Turatto, M. 2006, MNRAS, 369, 1949
- Reynolds et al. (2007) Reynolds, S.P., Borkowski, K.J., Hwang, U., Hughes, J.P., Badenes, C., Laming, J.M., & Blondin, J.M. 2007, ApJ, 668, L135
- Rho et al. (2008) Rho, J., Kozasa, T., Reach, W.T., Smith, J.D., Rudnick, L., DeLaney, T., Ennis, J.A., Gomez, H., & Tappe, A. 2008, ApJ 673, 271
- Schild et al. (1999) Schild, H., Dumm, T., Folini, D., Nussbaumer, H., & Schmutz, W. 1999, ed. P. Cox & M.F. Kessler, in The Universe as Seen by ISO, ESASP, 427, 397
- Sankrit et al. (2005) Sankrit, R., Blair, W.P., Delaney, T., Rudnick, L., Harrus, I.M., & Ennis, J.A. 2005, AdSpR, 35 1027
- Smith et al. (2007) Smith, J.D.T., Armus, L., Dale, D.A., Roussel, H., Sheth, K., Buckalew, B.A., Helou, G., & Kennicutt, R.C. 2007, PASP, 119, 1133
- Smith et al. (2010) Smith, H.A., et al. 2010, ApJ, 716, 490
- Smolders et al. (2010) Smolders, K., et al. 2010, A&A, 514, L1
- Speck et al. (2011) Speck, A.K., et al. 2011, ApJ, 740, 93
- Waters (2011) Waters, L.B.F.M., in: Why Galaxies Care About AGB Stars II: Shining Examples and Common Inhabitants, eds. F. Kerschbaum, T. Lebzelter, & R.F. Wing, ASP Conference Series, Vol. 445
- Williams et al. (2006) Williams, B.J., et al. 2006, ApJ, 652, L33
- Williams et al. (2011) Williams, B.J., et al. 2011, ApJ, 729, 65
| Region | R.A. (J2000) | Dec. (J2000) | Size (arcsec) |
|---|---|---|---|
| 1 | 17:30:43.1 | -21:29:30.9 | 10.2 10.2 |
| 2 | 17:30:36.0 | -21:28:45.5 | 20.4 20.4 |
| 3 | 17:30:44.1 | -21:28:00.7 | 25.5 20.4 |
| 4 | 17:30:40.4 | -21:31:06.2 | 56 20.4 |
| 5 | 17:30:39.9 | -21:29:24.1 | 20.4 20.4 |
| 6 | 17:30:42.7 | -21:29:46.6 | 30.6 20.4 |
Note. — Positions listed are the center of the region. Sizes of regions are given as length height.