The Merger-Triggered Active Galactic Nuclei Contribution to the Ultraluminous Infrared Galaxy Population
Abstract
It has long been thought that there is a connection between ultraluminous infrared galaxies (ULIRGs), quasars, and major mergers. Indeed, simulations show that major mergers are capable of triggering massive starbursts and quasars. However, observations by the Herschel Space Observatory suggest that, at least at high redshift, there may not always be a simple causal connection between ULIRGs and mergers. Here, we combine an evolving merger-triggered AGN luminosity function with a merger-triggered starburst model to calculate the maximum contribution of major mergers to the ULIRG population. We find that major mergers can account for the entire local population of ULIRGs hosting AGN and 25 of the total local ULIRG luminosity density. By , major mergers can no longer account for the luminosity density of ULIRGs hosting AGN and contribute 12 of the total ULIRG luminosity density. This drop is likely due to high redshift galaxies being more gas rich and therefore able to achieve high star formation rates through secular evolution. Additionally, we find that major mergers can account for the local population of warm ULIRGs. This suggests that selecting high redshift warm ULIRGs will allow for the identification of high redshift merger-triggered ULIRGs. As major mergers are likely to trigger very highly obscured AGN, a significant fraction of the high redshift warm ULIRG population may host Compton thick AGN.
1 Introduction
In the 1980s astronomers discovered a new class of infrared selected galaxies known as ultraluminous infrared galaxies (ULIRGs) and characterized by L⊙, where is the 8–1000 m luminosity (e.g., Houck et al., 1984; Soifer et al., 1984). Another important topic during this time period was the study of the evolution of quasars (e.g., Schmidt & Green, 1983), a class of active galactic nuclei (AGN) where accretion onto the supermassive black hole at the center of a massive galaxy gives rise to erg s-1, where is the 2–10 keV luminosity. ULIRGs and quasars have similar bolometric luminosities (1045–1046 erg s-1) and optical observations suggest many ULIRGs have nuclear sources of non-thermal ionizing radiation and disturbed morphologies (Sanders et al., 1988a). Thus, Sanders et al. (1988a) suggested that when two gas rich galaxies merge, gas and dust will fall into the nucleus of the resulting galaxy, triggering a massive starburst and a quasar.
Thirty years later, the connection between ULIRGs, AGN, and major mergers is still an area of active research. Recent simulations show that, indeed, gas rich major mergers are capable of triggering large starbursts and bright AGN (e.g., Hopkins et al., 2006a; Younger et al., 2009; Hopkins et al., 2010b; Narayanan et al., 2010). By looking for ULIRGs with strong X-ray emission or a power-law spectra in the Spitzer Space Telescope IRAC bands, studies have shown that AGN are common in ULIRGs (e.g., Hopkins et al., 2006a; Armus et al., 2007; Younger et al., 2009; Donley et al., 2010; Hopkins et al., 2010b; Narayanan et al., 2010). Furthermore, both the fraction of ULIRGs that host AGN and the fraction of ULIRGs whose bolometric luminosities are dominated by AGN emission, appear to increase strongly with luminosity (e.g., Veilleux et al., 2002; Pearson, 2005; Gruppioni et al., 2005; Brand et al., 2006; Donley et al., 2010; Nardini et al., 2010). Morphological studies have shown that a significant fraction of ULIRGs have disturbed morphologies, suggesting the galaxy has recently undergone a merger or interaction (e.g. Donley et al., 2010; Kartaltepe et al., 2010; Nardini et al., 2010). Additionally, Veilleux et al. (2002) showed that the fraction of ULIRGs triggered by major mergers increases with luminosity. Thus, it is expected that a significant fraction of ULIRGs host AGN and were triggered by gas rich major mergers. However, these studies tend to focus on ULIRGs with .
Far-infrared observations by the Herschel Space Telescope have opened a new window on the ULIRG population. Interestingly, Herschel observations show that at high redshift major mergers are not necessary to trigger ULIRGs (Sturm et al., 2010). Analyzing Herschel observations of the Boötes field, Melbourne et al. (2012) point out that 30 of optically-faint ULIRGs show obvious signs of a recent merger. Deep Herschel observations of the Great Observatories Origins Deep Survey (GOODS) and the Cosmological Evolution Survey (COSMOS) fields find that most ULIRGs are not in a starburst mode of star formation (Elbaz et al., 2011; Rodighiero et al., 2011). Instead, the increased gas fraction in high redshift galaxies allows normal secular star formation to power ULIRGs (e.g., Daddi et al., 2008; Elbaz et al., 2011; Rodighiero et al., 2011; Melbourne et al., 2012). Recent cosmological simulations confirm these observational results, finding that more than half of high redshift ULIRGs can be accounted for through mechanisms other than major mergers (Niemi et al., 2012). These results indicate that at high redshift the AGN-ULIRG connection may be quite different than the connection observed locally.
Draper & Ballantyne (2012) computed an AGN population model that constrains the space density and Eddington ratio evolution of AGN triggered by major mergers by considering the hard X-ray luminosity function (HXLF), X-ray AGN number counts, the X-ray background, and the local mass density of supermassive black holes. Thus, a model of the major merger population can be computed by combining this description of the evolving luminosity function of merger-triggered AGN with the Hopkins et al. (2010b) model for the time evolution of merger-triggered starbursts. Similarly, a model merger spectral energy distribution (SED) can be calculated by combining AGN infrared spectra computed with the photoionization code Cloudy (Ferland et al., 1998) with the Rieke et al. (2009) star formation templates. This method is used here to determine the maximum contribution of mergers to the ULIRG population at . A CDM cosmology is assumed with km s-1 Mpc-1 and .
2 Calculations
2.1 AGN Model
The evolving HXLF of major merger-triggered AGN presented by Draper & Ballantyne (2012) is used to determine the space density and luminosity distribution of merger-triggered AGN. Draper & Ballantyne (2012) combined an observationally motivated major merger rate (Hopkins et al., 2010a; Treister et al., 2010) and a theoretical AGN light curve (Hopkins & Hernquist, 2009) to determine the contribution of major merger-triggered AGN to the HXLF. Hopkins & Hernquist (2009) parametrize the AGN light curve as
| (1) |
where is the AGN Eddington ratio at time years after the AGN was triggered, , and , , and are parameters describing the AGN lifetime, peak Eddington ratio, and light curve slope, respectively. Draper & Ballantyne (2012) find that the best fit to the observed HXLF, X-ray AGN number counts, X-ray background, and mass density of supermassive black holes is achieved when yrs, = 2.5, and = 0.7 for AGN triggered by mergers. It is assumed that all mergers trigger AGN and therefore this model provides an upper limit to the contribution of major mergers to the AGN population.
Here, this merger-triggered AGN HXLF is converted to an infrared luminosity function using AGN SEDs computed using Cloudy version C08.00 (Ferland et al., 1998) as described in Section 2 of Draper & Ballantyne (2011). These SEDs cover the sub-mm to very hard X-ray wavelength regimes and incorporate the direct emission from the AGN, the diffuse emission radiated along the line of sight by the obscuring material around the AGN, and the emission reflected off the inner surface of the obscuring cloud. As in Draper & Ballantyne (2011), the neutral hydrogen density of the clouds is assigned such that Compton thin clouds have cm-3 and Compton thick (CT) clouds have cm-3, in accordance with the observed densities of typical molecular clouds. The inner radius of the obscuring material is assumed to be 10 pc. As we compare against observations of an ensemble of sources, instead of fitting individual sources, a simple AGN torus model is appropriate for this study. Moreover, as discussed in Section 3, the infrared emission of ULIRGs is dominated by star formation processes, thus the results presented here are not dependent on the torus model used.
2.2 Starburst Model
The evolving star formation rate, , of the merger-triggered starburst is determined using the model of Hopkins et al. (2010b). Thus,
| (2) |
where = 0.1 Gyr is the timescale of the merger-triggered starburst and is the total mass of stars born during the merger-triggered starburst. Once is determined, due to star formation is calculated using (Hopkins et al., 2010b)111Using the Kennicutt (1998) conversion factor, 5.8 L⊙/(M⊙ yr-1), yields an infrared luminosity density 10 lower.
| (3) |
In order to combine the AGN and starburst models, the time delay between the triggering of the starburst and the triggering of the AGN must be considered. Observational studies and simulations show that tends to peak 100 Myr after peaks (Davies et al., 2007; Schawinski et al., 2007, 2009; Rodríguez Zaurín et al., 2010; Wild et al., 2010; Hopkins, 2012). Therefore, the starburst is triggered such that the time delay between the peak star formation rate, , and the peak AGN Eddington ratio, , = 100 Myr. Scenarios where and 1 Gyr are also considered. Once the merger occurs, the AGN light curve of Equation 1 and the star formation rate evolution of Equation 2 determine the evolution of the system.
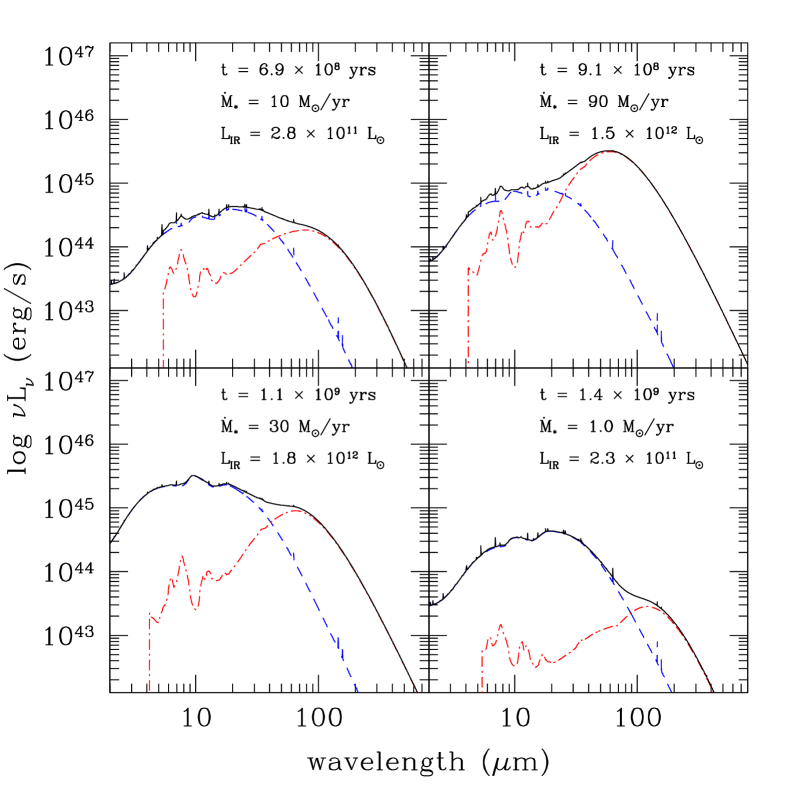
Thus, the space density of major mergers at redshift is set by the merger rate. The starburst model is triggered at , where is the appropriate change in redshift for at . The corresponding AGN is triggered at . The evolution of the starburst is governed by Equation 2 and the AGN luminosity evolves according to Equation 1. The infrared luminosity of the merger remnant galaxy is then determined using the AGN SEDs calculated with Cloudy and the Rieke et al. (2009) starburst SED templates. The Rieke et al. (2009) templates are based on the SEDs of local, pure star forming galaxies and include poly-cyclic aromatic hydrocarbon (PAH) emission features. Figure 1 shows an example SED at four different times, , after the major merger: before reaches (upper left), (upper right), (lower left), and after reaches (lower right). With the merger-triggered AGN HXLF, , and merger SEDs set, the merger infrared luminosity function, , is calculated as
| (4) |
where and are computed using the combined AGN-starburst SEDs. The infrared luminosity density, , is then computed as
| (5) |
where L⊙ and L⊙. To calculate the ULIRG , is increased to 1012 L⊙. The calculated here is then compared with the infrared luminosity density of AGN and their host galaxies, , measured by Goto et al. (2010, 2011) and the total infrared luminosity density, , measured by Le Floc’h et al. (2005).
The major merger rate is set by parametrizing observations and simulations (Hopkins et al., 2010a; Treister et al., 2010) and the AGN light curve parameters are set by fitting observations of the AGN HXLF (Draper & Ballantyne, 2012). The evolution of the merger-triggered starburst model is parametrized by fitting results of simulations (Hopkins et al., 2010b). This leaves only and as free parameters. We explore /M in steps of 0.25, assuming all mergers result in a similar value of . The values = 0, 100 Myr, and 1 Gyr are considered. The maximum ULIRG / and / are then investigated.
3 Results
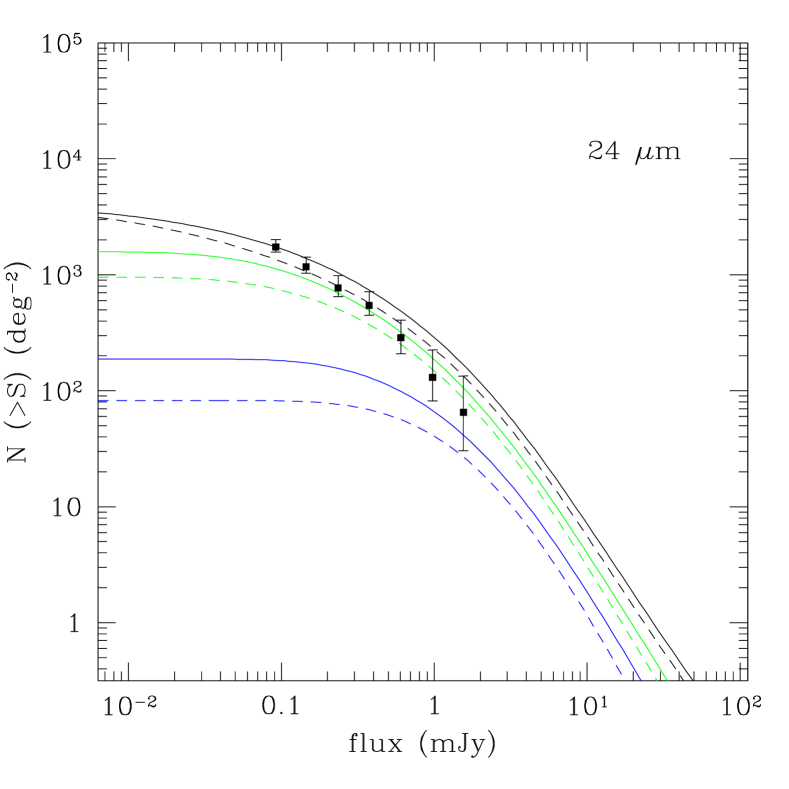
In order to prevent over-predicting the maximum , we consider the 24 m number count of X-ray selected AGN following Equation 1 of Draper & Ballantyne (2011). If M⊙ the bright end of the 24 m number count is over-predicted by a factor 2. These same models also over-predict the local ULIRG . Thus, 1010.25 M⊙ is an upper limit on the average for the population of major mergers. Figure 2 shows the number count for mergers with = 100 Myr and M⊙. As the observed number count is from the GOODS fields (Treister et al., 2006), it is not surprising that the model slightly over-predicts the bright end of the observed count since GOODS is a narrow field survey and likely misses bright, rare sources which are better accounted for by wide field surveys.
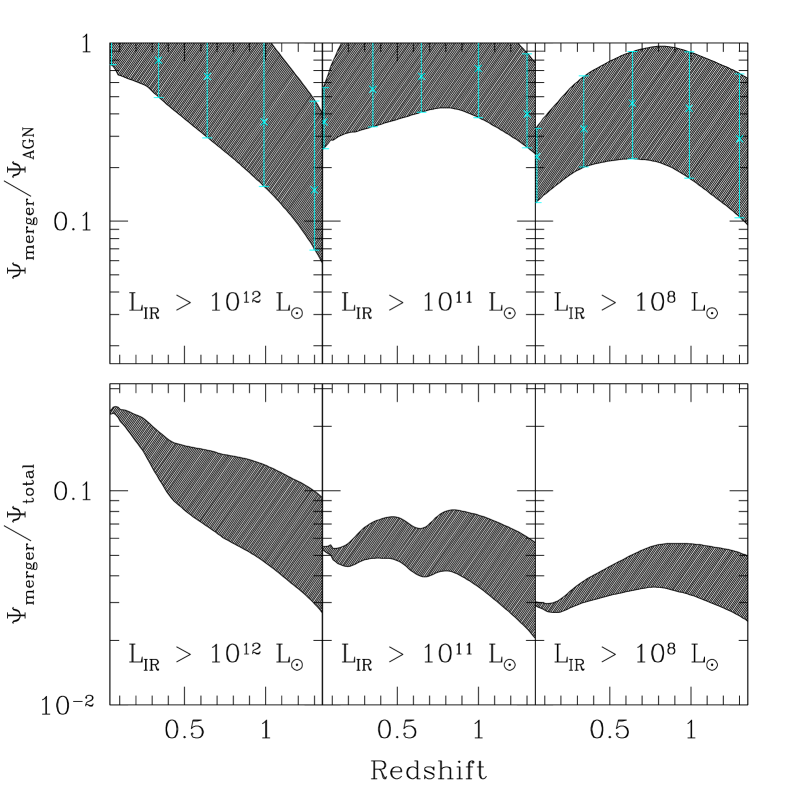
Figure 3 shows the maximum ULIRG / and ULIRG / that does not significantly over-predicting the 24 m number count. For the model shown in Figure 3, = 100 Myr and M⊙. The top left frame of Figure 3 shows that mergers can account for the local ULIRG , however, as shown in the lower left frame, / for local ULIRGs. Interestingly, if we remove the starburst from our SEDS, we find that emission from AGN alone can contribute 20 of the local ULIRG . Thus, we confirm that the of ULIRGs hosting AGN tends to be dominated by star formation.
If M⊙, major mergers can account for the local ULIRG for = 0 and 1 Gyr. Thus, the ability for mergers to account for the local AGN ULIRG population is not strongly dependent on . The local ULIRG / reduces to 0.20 for both = 0 and 1 Gyr. If = 100 Myr and M⊙, mergers cannot account for the local population of ULIRGs hosting AGN. Observations and simulations suggest that is proportional to the galaxy stellar mass, , such that with the fraction on the order of, but 0.1 (Hopkins et al., 2010b; Zavala et al., 2012). If we assume a distribution of defined by , with the distribution of described by the Pérez-González et al. (2008) stellar mass function, the AGN number count and the local ULIRG are over-predicted by at least a factor of 2. However, if , the model predictions are in agreement with the AGN number count and the local ULIRG /, only 0.02 higher than the simple calculation with a single . If , M⊙. Therefore, for = 0–1 Gyr and M⊙, the local ULIRG / and the local ULIRG / 0.20–0.28.
4 Discussion
Major mergers can account for at most a quarter of the local ULIRG . This suggests that a large fraction of local ULIRGs are triggered by mechanisms other than the coalescence of two massive gas rich galaxies, such as minor mergers, interactions, and secular processes. By , the ULIRG / and by , the ULIRG /. At , the ULIRG /. Indeed, simulations by Hopkins et al. (2010b) predict that at , the ULIRG /, in good agreement with the findings of this study. As major mergers are much more common at than , this suggests that secular processes are even more important for triggering ULIRGs at high redshift. Herschel has provided observational evidence that major mergers are not necessary at to trigger ULIRGs (Sturm et al., 2010); a finding that has been confirmed by simulations (Niemi et al., 2012).
At the majority of ULIRGs appear to be scaled up versions of local normal star forming galaxies. These high redshift ULIRGs tend to have cooler far-infrared dust temperatures (Melbourne et al., 2012) and stronger PAH emission (Elbaz et al., 2011) than local ULIRGs. Furthermore, by comparing the 8 m flux to the total infrared flux of high redshift ULIRGs, Elbaz et al. (2011) find that most ULIRGs lie on the infrared main sequence and are in a normal star forming mode of evolution. Similarly, Bournaud et al. (2012) and Kocevski et al. (2012) find that at and , AGN tend to be hosted by galaxies on the main sequence of star formation (see Elbaz et al., 2011). Observations and simulations both point out that high redshift galaxies are more gas rich than local galaxies (e.g., Treister et al., 2010; Di Matteo et al., 2012; Niemi et al., 2012). It is likely that galaxies with large reservoirs of gas and dust are capable of fueling ULIRGs without being triggered by a major merger.
Elbaz et al. (2011) do find that some high redshift ULIRGs are in a starburst mode, possibly triggered by a merger. Moreover, Elbaz et al. (2011) find evidence for a population of very highly obscured AGN embedded in these compact dusty starbursts. Other observational studies also find CT AGN ( cm-2) candidates in high redshift dusty starburst galaxies (e.g., Donley et al., 2010; Melbourne et al., 2012). Fabian (1999) explains that the gas and dust funneled into the central regions of the merger remnant galaxy will fuel a burst of star formation, rapid black hole accretion, and will obscure the resulting AGN. Thus, a significant fraction of CT AGN are expected to be recently triggered, likely by a major merger, and accreting very rapidly (e.g., Draper & Ballantyne, 2010). The results of this study are consistent with the merger-triggered CT AGN scenario, but, as / for ULIRGs at , the contribution of these merger-triggered CT AGN to the ULIRG population must be fairly small. The fraction of AGN that are CT is hard to observationally constrain due to the severe obscuration that defines CT AGN and AGN population models predict a wide range for the CT fraction (see Ballantyne et al., 2011). Increasing the fraction of AGN that are CT in this model by a factor of 1.5 increases the ULIRG / by 0.01.
Local ULIRG SEDs are often divided into two groups, warm and cool, where warm ULIRG SEDs are characterized by (e.g., Alonso-Herrero et al., 2006), where is the 25 m flux and is the 60 m flux. According to Alonso-Herrero et al. (2006), warm ULIRGs are 15–30 of the Bright Galaxy Survey sources (Sanders et al., 1988b). The merger model used here does produce warm ULIRG SEDs with at all redshifts; thus mergers can account for the local population of warm ULIRGs. Elbaz et al. (2011) found that galaxies on the main sequence of normal star formation, including galaxies hosting AGN, tend to have cooler dust temperatures than star-bursting galaxies. Because starbursts triggered by major mergers are expected to be more compact than secular star formation, merger-triggered starbursts will be characterized by higher dust temperatures than normal star formation (e.g., Elbaz et al., 2011; Melbourne et al., 2012). Indeed, observations of local ULIRGs show that compact ULIRGs are more likely to host an AGN than less compact ULIRGs (Nardini et al., 2010). Analyzing simulations of major mergers, Younger et al. (2009) find that warm ULIRGs are likely to be galaxies evolving from the star formation dominated merger phase to the AGN-starburst post-merger phase. Thus, by combining Herschel and Spitzer or Wide-field Infrared Survey Explorer (WISE) observations to select warm ULIRGs, the population of ULIRGs hosting merger-triggered AGN can be identified. As discussed above, the population of ULIRGs hosting AGN triggered by major mergers is likely to include a significant fraction of CT AGN. Thus seeking out high redshift ULIRGs with warm SEDs will also lead to the identification of high redshift CT AGN.
By combining the evolving luminosity function of AGN triggered by major mergers calculated by Draper & Ballantyne (2012) with the merger-triggered starburst model of Hopkins et al. (2010b), we computed an upper limit for the major merger contribution to the ULIRG population. Locally, major mergers can account for the observed population of ULIRGs hosting AGN and ULIRGs with warm SEDs, but the local ULIRG /. By , major merger-triggered ULIRGs hosting AGN can no longer account for the population of ULIRGs observed to have AGN signatures. Indeed, the ULIRG / by . Furthermore, at , the ULIRG /. Combining observations by Herschel and Spitzer or WISE to identify high redshift ULIRGs with warm SEDs is a good tool for identifying the population of ULIRGs hosting merger-triggered AGN, a large fraction of which are expected to be CT.
References
- Alonso-Herrero et al. (2006) Alonso-Herrero, A., Pérez-González, P.G., Alexander, D.M., et al.2006, ApJ, 640, 167
- Armus et al. (2007) Armus, L., Charmandaris, V., Bernard-Salas, J., et al.2007, ApJ, 656, 148
- Ballantyne et al. (2011) Ballantyne, D.R., Draper, A.R., Madsen, K.K., Rigby, J.R., Treister, E. 2011, ApJ, 736, 56
- Bournaud et al. (2012) Bournaud, F., Juneau, S., Le Floc’h, E., et al.2012, ApJ, submitted (arXiv:1111.0987)
- Brand et al. (2006) Brand, K., Dey, A., Weedman, D., et al.2006, ApJ, 644, 143
- Daddi et al. (2008) Daddi, E., Dannerbauer, H., Elbaz, D., et al.2008, ApJ, 673, L21
- Davies et al. (2007) Davies, R.I., Müller Sánchez, F., Genzel, R., et al.2007, 671, 1388
- Di Matteo et al. (2012) Di Matteo, T., Khandai, N., Feng, Y., et al.2012, ApJ, 745, L29
- Donley et al. (2010) Donley, J., Rieke, G.H., Alexander, D.M., Egami, E., & Pérez-González, P.G. 2010, 719, 1393
- Draper & Ballantyne (2012) Draper, A.R. & Ballantyne D.R. 2012, ApJ, 751, 72
- Draper & Ballantyne (2011) Draper, A.R. & Ballantyne D.R. 2011, ApJ, 729, 109
- Draper & Ballantyne (2010) Draper, A.R. & Ballantyne D.R. 2010, ApJ, 715, L99
- Elbaz et al. (2011) Elbaz, D., Dickinson, M., Hwang, H.S., et al.2011, A&A, 533, 119
- Fabian (1999) Fabian, A.C. 1999, MNRAS, 308, L39
- Ferland et al. (1998) Ferland, G.J., Korista, K.T., Verner, D.A., et al.1998, PASP, 110, 761
- Goto et al. (2011) Goto, T., Arnouts, S., Inami, H., et al.2011, MNRAS, 410, 573
- Goto et al. (2010) Goto, T., Takagi, T., Matsuhara, H., et al.2010, A&A, 514, A6
- Gruppioni et al. (2005) Gruppioni, C., Pozzi, F., Lari, C., et al.2005, ApJ, 618, L9
- Hopkins (2012) Hopkins, P.F. 2012, MNRAS, 420, L8
- Hopkins & Hernquist (2009) Hopkins, P.F. & Hernquist, L. 2009, ApJ, 698, 1550
- Hopkins et al. (2006a) Hopkins, P.F., Hernquist, L., Cox, T.J., et al.2006a, ApJS, 163, 1
- Hopkins et al. (2010a) Hopkins, P.F., Bundy, K., Croton, D., et al.2010a, ApJ, 715, 202
- Hopkins et al. (2010b) Hopkins, P.F., Younger, J.D., Hayward, C.C., Narayanan, D., & Hernquist, L. 2010b, MNRAS, 402, 1693
- Houck et al. (1984) Houck, J.R., Soifer, B.T., Neugebauer, G., et al.1984, ApJ, 278, L63
- Kartaltepe et al. (2010) Kartaltepe, J.S., Sanders, D.B., Le Floc’h, E., et al.2010, ApJ, 721, 98
- Kennicutt (1998) Kennicutt, R.C. 1998, ARA&A, 36, 189
- Kocevski et al. (2012) Kocevski, D.D., Faber, S.M., Mozena, M., et al.2012, ApJ, 744, 148
- Le Floc’h et al. (2005) Le Floc’h, E., Papovich, C., Dole, H., et al.2005, ApJ632, 169
- Melbourne et al. (2012) Melbourne, J., Soifer, B.T., Desai, V., et al.2012, AJ, in press (arXiv:1203.3199)
- Nardini et al. (2010) Nardini, E., Risaliti, G., Watabe, Y., Salvati, M., & Sani, E. 2010, MNRAS, 405, 2505
- Narayanan et al. (2010) Narayanan, D., Dey, A., Hayward, C.C., et al.2010, MNRAS, 407, 1701
- Niemi et al. (2012) Niemi, S.-M., Somerville, R.S., Ferguson, H.C., et al.2012, MNRAS, 421, 1593
- Pearson (2005) Pearson, C. 2005, MNRAS, 358, 1417
- Pérez-González et al. (2008) Pérez-González, P.G., Rieke, G.H., Villar, V., et al.2008, ApJ, 675, 234
- Rieke et al. (2009) Rieke, G.H., Alonso-Herrero, A., Weiner, B.J., et al.2009, ApJ, 692, 556
- Rodighiero et al. (2011) Rodighiero, G., Daddi, E., Baronchelli, I., et al.2011, ApJ, 739, L40
- Rodríguez Zaurín et al. (2010) Rodríguez Zaurín, J., Tadhunter, C.N., & González Delgado, R.M. 2010, MNRAS, 403, 1317
- Sanders et al. (1988a) Sanders, D.B., Soifer, B.T., Elias, J.H., et al.1988a, ApJ, 325, 74
- Sanders et al. (1988b) Sanders, D.B., Soifer, B.T., Elias, J.H., Neugebauer, G., & Matthews, K. 1988b, ApJ, 328, L35
- Schawinski et al. (2007) Schawinski, K., Thomas, D., Sarzi, M., et al.2007, MNRAS, 382, 1415
- Schawinski et al. (2009) Schawinski, K., Virani, S., Simmons, B., et al.2009, ApJ, 692, L19
- Schmidt & Green (1983) Schmidt, M. & Green, R.F. 1983, ApJ, 269, 352
- Soifer et al. (1984) Soifer, B.T., Rowan-Robinson, M., Houck, J.R., et al.1984, ApJ, 278, L71
- Sturm et al. (2010) Sturm, E., Verma, A., Graciá-Carpio, J., et al.2010, A&A, 518, L36
- Treister et al. (2006) Treister, E., Urry, C.M., Van Duyne, J., et al.2006, ApJ, 640, 603
- Treister et al. (2010) Treister, E., Natarajan, P., Sanders, D.B., et al.2010, Science, 328, 600
- Veilleux et al. (2002) Veilleux, S., Kim, D.-C., & Sanders, D.B. 2002, ApJS, 143, 315
- Wild et al. (2010) Wild, V., Heckman, T., & Charlot, S. 2010, MNRAS, 405, 933
- Younger et al. (2009) Younger, J.D., Hayward, C.C., Narayanan, D., et al.2009, MNRAS, 396, L66
- Zavala et al. (2012) Zavala, J., Avila-Reese, V., Firmani, C., & Boylan-Kolchin, M. 2012, MNRAS, submitted (arXiv:1204.0516)