The Birth of a Galaxy. II. The Role of Radiation Pressure
Abstract
Massive stars provide feedback that shapes the interstellar medium of galaxies at all redshifts and their resulting stellar populations. Here we present three adaptive mesh refinement radiation hydrodynamics simulations that illustrate the impact of momentum transfer from ionising radiation to the absorbing gas on star formation in high-redshift dwarf galaxies. Momentum transfer is calculated by solving the radiative transfer equation with a ray tracing algorithm that is adaptive in spatial and angular coordinates. We find that momentum input partially affects star formation by increasing the turbulent support to a three-dimensional rms velocity equal to the circular velocity of early haloes. Compared to a calculation that neglects radiation pressure, the star formation rate is decreased by a factor of five to M⊙ yr-1 in a dwarf galaxy with a dark matter and stellar mass of and , respectively, when radiation pressure is included. Its mean metallicity of is consistent with the observed dwarf galaxy luminosity-metallicity relation. However, what one may naively expect from the calculation without radiation pressure, the central region of the galaxy overcools and produces a compact, metal-rich stellar population with an average metallicity of 0.3 , indicative of an incorrect physical recipe. In addition to photo-heating in H ii regions, radiation pressure further drives dense gas from star forming regions, so supernovae feedback occurs in a warmer and more diffuse medium, launching metal-rich outflows. Capturing this aspect and a temporal separation between the start of radiative and supernova feedback are numerically important in the modeling of galaxies to avoid the “overcooling problem”. We estimate that dust in early low-mass galaxies is unlikely to aid in momentum transfer from radiation to the gas.
keywords:
cosmology — methods: numerical — hydrodynamics — radiative transfer — star formation1 Introduction
Stellar radiation from massive stars and their supernova (SN) explosions significantly alter the surrounding interstellar medium (ISM) and, thus, subsequent star formation in the host galaxy (for a review, see McKee & Ostriker, 2007). On a grander scale, their input can drive large-scale outflows that increase the entropy and metallicity of the intergalactic medium (Davies et al., 1998; Aguirre et al., 2001a; Benson, 2010, for a review). To date, the primary feedback mechanism in galaxy formation simulations originate from SNe, which is implemented by locally injecting thermal and kinetic energy and metals (Cen & Ostriker, 1992). There are various relevant physics, such as photoheating (e.g. Gnedin, 2000), momentum input from radiation (e.g. Haehnelt, 1995), cosmic rays (e.g. Jubelgas et al., 2008), and magnetic fields (e.g. Wang & Abel, 2009; Kotarba et al., 2011), that can play an important role in star and galaxy formation. Numerical simulations are a useful tool in exploring the impacts of these physical processes in galaxy formation. But only recently, feedback mechanisms other than SNe have begun to appear in cosmological simulations, sometimes in a phenomenological manner, because of resolution and algorithmic limitations.
Simulating the first low-mass galaxies with the correct physical model is crucial because they are the building blocks for all subsequent galaxies, and it is clear that stellar radiation from them were predominately responsible for reionisation (e.g. Shapiro, 1986; Fan, Carilli & Keating, 2006; Bouwens et al., 2011). The most luminous of these “reionisers” have been detected at in the Hubble Ultra Deep Field (HUDF) and from ground-based campaigns (e.g. Bouwens et al., 2008; McLure et al., 2010; Finkelstein et al., 2010; Ouchi et al., 2010). Even lower mass and higher redshift galaxies will be detected with the Atacama Large Millimeter Array (ALMA) and the James Webb Space Telescope (JWST), providing additional constraints on early galaxy formation, reionisation, and the early metal enrichment of the intergalactic medium. Closer to home, nearby dwarf galaxies provide clues to their formation, where all of them formed stars at or before reionisation (Grebel, Gallagher & Harbeck, 2003), in their [/Fe] versus [Fe/H] evolution (Tolstoy, Hill & Tosi, 2009), metallicity distribution functions (Kirby et al., 2011), metallicity radial gradients (Tolstoy et al., 2004), star formation histories (Monelli et al., 2010), and individual abundance patterns (Frebel et al., 2010; Caffau et al., 2011). These data from the high-redshift and the local universe provide important constraints on numerical models of star formation and feedback.
The first generation of galaxies with (Bromm & Yoshida, 2011) are an excellent cosmological testbed to numerically investigate the impact of each physical process. Compared to simulating larger galaxies, they present a relatively clean scenario with few instances of prior star formation that sets the “initial conditions” for galaxy formation. They are also small enough so it is computationally feasible to achieve high enough resolution to well resolve star forming regions. Their progenitors may have hosted several metal-free and massive (Pop III) stars, enriching the IGM and pre-heating the gas to thousands of degrees, which then re-accretes into the dark matter (DM) halo and forms a dwarf galaxy (Wise & Abel, 2008; Greif et al., 2010). In this paper, we investigate the impact of radiative cooling from metals and a H2-dissociating radiation background, but the main focus of this work is the effect of momentum transfer from ionising radiation, i.e. radiation pressure, on star formation in such galaxies.
Regulating star formation by radiation pressure is not a new idea, especially in the Milky Way and present-day star formation (Shu et al., 1991; Ferrara, 1993; Li & Shu, 1996; Matzner & McKee, 1999). However, Haehnelt (1995) was the first to apply this idea to galaxy formation. He found that radiation pressure could be the dominant feedback process within 110 pc in DM haloes with masses . He suggested that it could be more important than SNe heating in driving outflows from such early dwarf galaxies. In turn, this would lower their gas fractions and alter their predicted mass-to-light ratios. In larger galaxies, it was unclear whether momentum deposition could drive outflows through ionising radiation alone. However, UV radiation can be absorbed by dust and be re-emitted many times, increasing the momentum transfer to the absorber. Without making the assumption that gas dynamics are coupled to dust grains, radiation pressure from massive stars were found to drive dust outflows in cosmological simulations, enriching the IGM to the C and Si abundances found in quasar absorption lines (Aguirre et al., 2001a, b, c). Murray, Quataert & Thompson (2005) and Thompson, Quataert & Murray (2005) investigated the effects of radiation pressure in driving galactic outflows from starburst galaxies and regulating star formation by reducing the gas supply for further star formation and BH growth. They found that it could explain the relation for early-type galaxies, where is the stellar velocity dispersion (Ferrarese & Merritt, 2000; Gebhardt et al., 2000; Tremaine et al., 2002). They also found that momentum-driven winds could be launched if the opacity in a starburst galaxy, assuming that momentum transfer is increased by a factor of , where is the optical depth in the infrared (IR).
These works led to various implementations of momentum transfer in numerical studies of galaxy formation, usually in the form of “kicking” particles with some wind velocity from star-forming regions (e.g. Springel & Hernquist, 2003; Oppenheimer & Davé, 2008; Sales et al., 2010; Hopkins, Quataert & Murray, 2011). The early implementations decoupled these wind particles from the hydrodynamics to create outflows; otherwise, they would be confined to the galaxy. Recently, Krumholz & Thompson (2012) investigated the parsec-scale effects of momentum transfer in radiation hydrodynamics simulations and compared them to the aforementioned subgrid models. They found that most of the radiation is not trapped because the optically-thick shell breaks up from a radiation Rayleigh-Taylor instability, i.e. momentum transfer does not scale as . This may lead to an overestimate of momentum transfer in the subgrid models when the radiation source shines above 10 per cent of its Eddington limit.
Here we present results that demonstrate the effects of momentum transfer from ionising radiation on dwarf galaxy formation, using cosmological radiation hydrodynamics simulations. The amount of momentum deposition is directly calculated from our radiation transport solver enzo+moray (Wise & Abel, 2011). In the next section, we outline some analytics that govern the dynamics of outflows and turbulence created by radiation pressure. Then in Sec. 3, we describe the numerical simulation setup and algorithms. In Sec. 4, we present the effects of radiation pressure on star formation and metal enrichment in dwarf galaxies, preventing the overcooling problem seen often in galaxy formation simulations. We discuss possible constraints on high-redshift dwarf galaxies and then focus on differences in feedback implementations in simulations in Sec. 5. We finish that section with an estimate of momentum transfer onto dust grains in dwarf galaxies. We summarise our findings in Sec. 6.
2 Momentum transfer from ionising radiation
First we review some basic analytical arguments on momentum transfer from ionising radiation. We take a similar approach as Haehnelt (1995) and Murray, Quataert & Thompson (2005) and use an Eddington-like argument on an entire galaxy, equating the radiation pressure from ionising stellar radiation to the gravitational potential of the host dark matter halo. Its application to local star formation and feedback has been extensively studied (McKee & Ostriker, 2007, and references therein). But can we apply the same principles to an entire dwarf galaxy? How will the energetics differ if the momentum transfer originates from ionising radiation instead of protostellar winds or Thomson scattering?
In the traditional Eddington approach (Eddington, 1926), Thomson scattering is the source of radiation pressure. The Eddington luminosity limit is
| (1) |
where is the mass of object, is the proton mass, and is the Thomson cross-section. However, the absorption cross-section for hydrogen at 1 Ryd, which is times larger than the Thomson cross-section. However, it should be noted that a spectrum-weighted cross-section is somewhat lower because . Thus momentum transfer during the absorption of ionising photons might significantly affect the large-scale dynamics in the galaxy.
For illustrative purposes, we focus on a single expanding H ii region with hydrogen only that is embedded in a DM halo. A shock front forms at the edge of the H ii region as when the ionisation front becomes D-type (Osterbrock, 1989), i.e., the expansion speed of the H ii region slows below the sound speed of the ionised medium. If the ionisation front coincides with the shock front, the optical depth from the radiation source will exceed unity within the shock. We can simplify the calculation by assuming that the H ii region is optically thin and all of the ionising radiation momentum is transferred to the optically-thick shock.
Murray, Quataert & Thompson (2005) considered the spherically symmetric and self-gravitating case where the stellar system is contained within a halo with a gas fraction . Their main focus was on nuclear starbursts and the resulting outflows and explaining the relationship (Ferrarese & Merritt, 2000; Gebhardt et al., 2000; Tremaine et al., 2002). They neglected thermal pressure forces from the H ii region because it is negligible for a stellar system that is centered in the gravitational potential of halos that host galaxies. For a central ionising luminosity where each photon is absorbed once, the momentum equation is
| (2) |
In the case where photons are absorbed and re-emitted many times in a dusty medium, the second term can become important. Murray, Quataert & Thompson showed that for a luminosity , the gas moves outward driven by pure radiation pressure, where is the halo velocity dispersion and all radiation is assumed to be absorbed.
For a dwarf galaxy with and the cosmic baryon fraction, this critical luminosity is on the order of erg s-1 (), equivalent to a mass-to-light ratio on the order of unity for a Salpeter IMF. The gravitational potential in dwarf galaxies with cannot prevent the expansion of the dense shell surrounding H ii regions into the IGM. Furthermore, star formation is not necessarily concentrated in the centre of these small irregular galaxies (Tolstoy, Hill & Tosi, 2009). If the H ii region is pressure-supported (e.g., see Ferrara, 1993), then we can neglect the gravitational force term in Eq. 2. Taking to be time-independent and instantaneously non-zero at , the momentum equation for the optically-thick shell is simply . We consider the spherically-symmetric case where the shell sweeps all of the ISM with a density in its path, and it moves at a velocity
| (3) |
Solving for radius and velocity with a homogeneous medium and isothermal density profile , we obtain
| (4) |
| (5) |
where , and is the radius where the optically thick shell first forms. The initial Strömgren sphere radius is calculated by equating the ionising photon luminosity to the number of recombinations, so that
| (6) |
given an initial absorber number density of the star-forming region. Here is the average ionising photon energy, and is the Case B recombination rate at K. Molecular complexes are very clumpy and, in the Galactic plane, they have an average density in the range of (Bergin & Tafalla, 2007). For a representative stellar cluster,
| (7) |
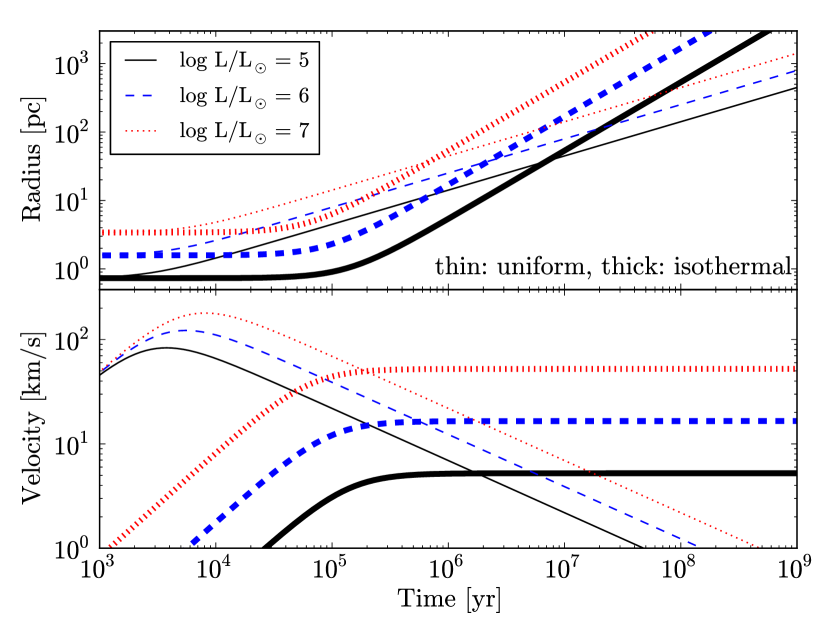
where , , and . We plot and for , , and = 20 eV in Figure 1 for a uniform and a isothermal density profile. We set so that both the uniform and isothermal sphere with radius contains . In a uniform medium, the shell rapidly accelerates to its maximum velocity 100 km s-1 after yr. Its velocity decreases as the shell accumulates material from the ISM. It eventually reaches 1 kpc after 1 Gyr for the case. In the isothermal sphere, the shell accelerates as it runs down the density slope, reaching 1 kpc after 50 Myr. The shell reaches a constant velocity after about a Myr (Bally & Lada, 1983; Shu et al., 1991; Matzner & McKee, 1999) with a fraction of the radiation energy being transferred to the kinetic energy of the shell.
This ideal model will break down as the shell when gravitational forces from the DM halo becomes larger than and the thermal pressure inside the H ii region. However if parts of the shell fragment because of ionisation front or thin-shell instabilities, the diffuse gas in the openings of the shell will experience a greater acceleration, i.e. champagne flows (e.g. Yorke, Tenorio-Tagle & Bodenheimer, 1983). These radiation pressure driven champagne flows are a possible mechanism for enhancing mass outflow velocities in dwarf galaxies in this model.
The terminal velocity for the shell traveling down a density profile is comparable to the circular velocity of the DM halo. Radiative pressure driven winds in dwarf galaxies may contribute more to the driving of turbulence instead of outflows when the shells are contained within the halo. Collisions between surviving swept-up shells can drive turbulence in the star-forming region. This has been shown to be likely in present-day star formation (e.g. Norman & Silk, 1980; Franco, 1983; Krumholz, Matzner & McKee, 2006; Matzner, 2007). This added turbulent support may help in regulating star formation by preventing a catastrophic central collapse in a galaxy.
We can understand the evolution of turbulence by investigating the vorticity equation,
| (8) |
where is the fluid derivative, is pressure, and is the viscosity. In our analysis, we consider non-viscous fluids and set . The first term describes the stretching of vorticity; the second term comes from non-barotropic flows, i.e. , and the last term accounts for the dissipation of turbulence through viscous forces. Non-barotropic flows occur at and near shock fronts and have been found to be the main process that sustains vorticity in several situations. For example, virial shocks and internal weak shocks have been found to drive turbulence during halo virialization (Wise & Abel, 2007a; Greif et al., 2008). Furthermore, non-thermal pressure, such as radiation pressure or cosmic rays, contributes to the generation of vorticity when its gradient (acceleration) is not aligned with the density gradient. To determine the importance of radiation pressure in outflows and sustaining turbulent motions, we use cosmological radiation hydrodynamics simulations that focus on dwarf galaxy formation, which we describe next.
3 Cosmological Simulations
We expand upon the simulation presented in Wise et al. (2012, hereafter Paper I) that focused on the transition from Population III to II star formation and the effects of radiative and supernova feedback on early dwarf galaxy formation. In this work, we compare two new simulations that add radiative cooling from metals, an H2-dissociating radiation background, and momentum transfer from ionising radiation to the original physics set. These simulations were run with the adaptive mesh refinement (AMR) code enzo v2.0111enzo.googlecode.com, changeset 03a72f4f189a (Bryan & Norman, 1997; O’Shea et al., 2004). It uses an -body adaptive particle-mesh solver (Efstathiou et al., 1985; Couchman, 1991; Bryan & Norman, 1997) to follow the DM dynamics. It solves the hydrodynamical equation using the second-order accurate piecewise parabolic method (Woodward & Colella, 1984; Bryan et al., 1995), while a Riemann solver ensures accurate shock capturing with minimal viscosity. We use the recently added HLLC Riemann solver (Toro, Spruce & Speares, 1994) for additional stability in strong shocks and rarefaction waves.
We use a simulation box of 1 Mpc on a side with a base resolution of , resulting in a DM mass resolution of 1840 . This allows us to resolve DM haloes that can cool by H2 in the gas phase (Tegmark et al., 1997) by at least 100 particles. We refine the grid on baryon overdensities of , where is the AMR level, resulting in a super-Lagrangian behaviour (also see O’Shea & Norman, 2008). We also refine on a DM overdensity of three and always resolve the local Jeans length by at least 4 cells, avoiding artificial fragmentation during gaseous collapses (Truelove et al., 1997). If any of these criteria are met in a single cell, it is flagged for further spatial refinement.
We initialise the simulations with grafic (Bertschinger, 2001) at and use the cosmological parameters from the 7-year WMAP CDM+SZ+LENS best fit (Komatsu et al., 2011): , , , , , and with the variables having their usual definitions. We use a maximum refinement level of , resulting in a maximal comoving resolution of 1 pc. We do not smooth the DM mass field at any level, which is done to reduce artificial gas heating from DM particles in simulations that have regions that are baryon dominated (e.g. Abel, Bryan & Norman, 2002). The adaptive particle-mesh solver has a force resolution of two cell widths of a given AMR grid. We compare the simulations at , which is when the metal cooling simulation reaches an ionised volume fraction of 96 percent.
3.1 Star formation
We distinguish Pop II and Pop III SF by the total metallicity of the densest cell in the molecular cloud. Pop II stars are formed if [Z/H] , and Pop III stars are formed otherwise. We do not consider hypothetical Pop III.2 stars or intermediate mass stars from CMB-limited cooling. Here we outline how we treat Pop II and III SF in our simulations; for more details and justifications, we refer the reader to Wise et al. (2012).
3.1.1 Population III star formation
We use the same Pop III SF model as Wise & Abel (2008) where each star particle represents a single star. In this model, a star particle forms when a cell has all of the following criteria:
-
1.
an overdensity of ( at ),
-
2.
a converging gas flow (), and
-
3.
a molecular hydrogen fraction .
These physical conditions are typical of collapsing metal-free molecular clouds Myr before the birth of a Pop III main-sequence star (Abel, Bryan & Norman, 2002; O’Shea & Norman, 2007). This is approximately the end of the initial free-fall phase, the so-called “loitering phase”, where the minimum temperature at this point characterises the fragmentation mass scale (e.g. Omukai & Yoshii, 2003). This prescription is similar to the Cen & Ostriker (1992) method but removes the Jeans unstable () and cooling timescale () requirements. We do not consider the former criterion because it is not applicable to simulations that resolve the Jeans length at all times. The molecular hydrogen fraction requirement effectively constrains star formation to cooling molecular clouds, where the H2 formation rate is significantly larger than the dissociation rate from a Lyman-Werner radiation field.
If multiple cells meet the star particle formation criteria within 1 pc, we form one Pop III star particle with the centre of mass of these flagged cells to ensure that one massive star is created per metal-free molecular cloud. We randomly sample from an IMF with a functional form of
| (9) |
to determine the stellar mass. Above , it behaves as a Salpeter IMF but is exponentially cutoff below that mass (Chabrier, 2003). After the star particle forms and its mass is determined, an equal amount of gas is removed from the computational grid in a sphere that contains twice the stellar mass and is centred on the star particle. At this stage of the collapse, a sphere enclosing has a radius of 1–2 pc and has approximately 200 cells. The star particle acquires the mass-weighted velocity of the gas contained in this sphere.
3.1.2 Pop II star formation
We treat Pop II star formation with the same prescription as Wise & Cen (2009), which is similar to the Pop III prescription but without the minimum H2 fraction requirement. This is removed because the metal-enriched gas can efficiently cool even in the presence of a strong UV radiation field (e.g. Safranek-Shrader, Bromm & Milosavljević, 2010). To ensure the volume is cooling, we restrict star formation to gas with temperatures K. Unlike Pop III star particles that represent individual stars, Pop II star particles represent a star cluster of some total mass and an assumed Salpeter IMF.
Once a cell meets these criteria, the prescription searches outward with increasing radius for the boundary of the molecular cloud, centred on the most dense cell. Here, we define a molecular cloud as a sphere with a dynamical time Myr (corresponding to an average density ) and a radius , where is the mean molecular weight. This sphere typically has a radius of 6 pc (increasing as ) for the smallest molecular clouds and 2,500 cells. Once the sphere radius is found, a fraction of the cold gas ( K) inside the sphere is converted into a star particle with mass . This treatment of cold gas accretion is similar to a star formation model with a multi-phase subgrid model (Springel & Hernquist, 2003) but is employed in a simulation that can resolve the multi-phase interstellar stellar medium (ISM). After the star particle is created, we replace the sphere with a uniform density and temperature K, which approximates the initial stages of an H ii region.
3.2 Stellar feedback
The radiation field is evolved with adaptive ray tracing (Abel & Wandelt, 2002; Wise & Abel, 2011) that is based on the HEALPix framework (Górski et al., 2005) and is coupled self-consistently to the hydrodynamics. Each star particle is a point source of hydrogen ionising radiation with the ionising luminosity equally split between 48 initial rays (HEALPix level 2). We use a mono-chromatic spectrum for the radiation with the energy , the spectral shape weighted photon energy. For a cosmological simulation that focuses on galaxies, this simplification does not significantly affect the overall galactic dynamics (see Sec. 6.3 in Wise & Abel, 2011). We do not consider He i and He ii ionising radiation. As the rays propagate from the source or into a high resolution AMR grid, they are adaptively split into 4 child rays, increasing the angular resolution of the solution, when the solid angle of the ray is larger than 1/3 of the cell area, where is the HEALPix level. We limit the ray splitting to a maximum HEALPix level of 13, or equivalently rays per source. We model the H2 dissociating radiation with an optically-thin, inverse square profile, centred on all Pop II and III star particles.
3.2.1 Population III stellar feedback
We use mass-dependent hydrogen ionising and LW photon luminosities and lifetimes of the Pop III stars from Schaerer (2002). We use a mass-independent photon energy eV, appropriate for the near-constant K surface temperatures of Pop III stars. They die as Type II SNe if (Woosley & Weaver, 1995; Nomoto et al., 2006) and as PISNe if they are in the mass range 140–260 (Heger et al., 2003), where is the stellar mass. For normal Type II SNe between 11–20 , we use an explosion energy of erg and a linear fit to the metal ejecta mass calculated in Nomoto et al. (2006),
| (10) |
or equivalently, the metal yield fraction
| (11) |
We model the SNe of stars with as hypernova with the energies and ejecta masses () also taken from Nomoto et al., linearly interpolating their results to . For PISNe, we use the explosion energy from Heger & Woosley (2002), where we fit the following function to their models,
| (12) |
where is the helium core (and equivalently the metal ejecta) mass and is the stellar mass. If the stellar mass is outside of these ranges, then an inert, collisionless black hole (BH) particle is created.
The blastwave is modelled by injecting the explosion energy and ejecta mass into a sphere of 10 pc, smoothed at its surface to improve numerical stability (Wise & Abel, 2008). Because we resolve the blastwave relatively well with several cells across at its initialization, the thermal energy is converted into kinetic energy and agrees with the Sedov-Taylor solution (e.g. Greif et al., 2007).
3.2.2 Population II stellar feedback
Pop II star particles emit 6000 hydrogen ionising photons per stellar baryon averaged over their lifetime and eV, appropriate for a [Z/H] = population (Schaerer, 2003). The star particles live for 20 Myr, the maximum lifetime of an OB star. These stars generate the majority of the ionising radiation and SNe feedback in stellar clusters, thus we ignore any feedback from lower mass stars. By considering a constant luminosity, we may be underestimating the impact of radiative feedback because, given an IMF, the total luminosity of a cluster is maximal at early times when thermal and radiation pressure forces are the greatest, i.e. the edge of H ii region is still near the massive stars.
For SN feedback, these stars generate erg s-1 after living for 4 Myr, which is injected into spheres with a radius of 10 pc. However, if the resolution of the grid is less than 10/3 pc, we distribute the energy into a cubic region surrounding the star particle. Here, star particles also return ejected material with mass
| (13) |
back to the grid at every timestep on the finest AMR level. = 20 Myr denotes the lifetime of the star particle. This ejected gas has solar metallicity , resulting in a total metal yield . However, we note that calculations which are calibrated to Milky Way observations (Madau et al., 1996) suggest , and thus we may be underestimating the Pop II chemical feedback.
3.3 Simulation variations
All three simulations start from identical 1 Mpc initial conditions, have the same refinement criteria, and use the same star formation and feedback models. Starting with our reference model in Paper I, each following simulation builds upon the physics of the previously described one.
3.3.1 Reference model
We use the nine-species (H i, H ii, He i, He ii, He iii, e-, H2, H2+, H-) non-equilibrium chemistry model in enzo (Abel et al., 1997; Anninos et al., 1997) and the H2 cooling rates from Glover & Abel (2008). We spatially distinguish metal enrichment from Pop II and Pop III stars, however they do not contribute to the radiative cooling rates and act as passive tracer fields for the SNe ejecta. We will refer to this simulation as the “Base” simulation. It required 150,000 CPU hours on 512 compute cores to run to .
3.3.2 Metal cooling
In this simulation, we only add the effects of radiative cooling from fine-structure transitions in metals. We will refer to this simulation as the “MC” simulation. We use the method of Smith, Sigurdsson & Abel (2008) that is incorporated into enzo v2.0. We calculate the cooling rates with Cloudy 07.02.01, which has a sophisticated chemical network that includes all atomic species and many molecular species222Because the cooling rates from rotational and vibrational H2 transitions are already included in enzo, thus we do not include H2 cooling in the Cloudy rate table., on a logarithmically spaced 4-dimensional grid of (i) density – 10-6 to 106 cm-3, = 0.25 dex, (ii) temperature – 10 to 108 K, dex, (iii) electron fraction – 10-6 to 1, dex, and (iv) metallicity – 10-6 to 1 , dex, where is the spacing between grid points. We use the CMB radiation spectrum as the input spectrum. Dust cooling becomes important at , which our simulations are not designed to probe, and thus we do not consider cooling from dust grains. It required 200,000 CPU hours on 512 compute cores to complete. Compared to the Base simulation, the additional compute time comes from ray tracing through a larger ionised volume, i.e. the rays are not terminated when fully absorbed.
3.3.3 Radiation pressure and soft UV background
This simulation adds momentum transfer from ionising radiation to gas and an H2-dissociating radiation background. We will refer to this simulation as the “RP” simulation, and the runtime is similar to the Base simulation at 150,000 CPU hours. As the radiation field is calculated with enzo+moray, the momentum of absorbed ionising radiation
| (14) |
is transferred to the absorbing medium, where d is the number of photons absorbed, is the photon energy, and is the normal direction of the radiation. This additional momentum further accelerates the gas by
| (15) |
per unit mass, where is the gas density, d is the radiative transfer timestep, and is the cell volume. Currently we do not consider momentum transfer by radiation trapping when UV light is absorbed by dust grains and re-emitted in the IR and absorbed many times. In principle, this would increase the d by a factor of , which we discuss in Section 5.2. The acceleration d is then added to the acceleration field in the calculation, for example, from gravity, in an operator split fashion.
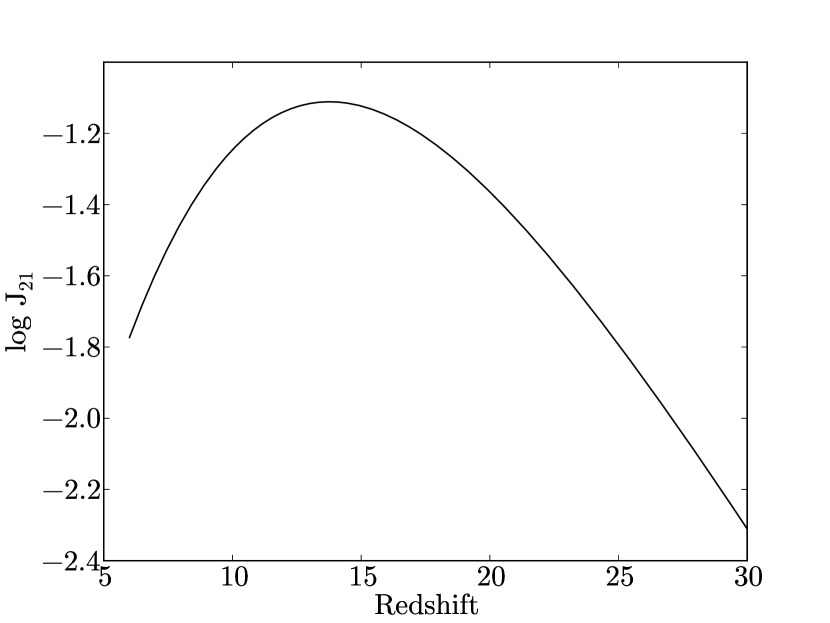
A time-dependent Lyman-Werner (LW) optically thin radiation background is utilised in this simulation on which the LW radiation from point sources are added. LW flux from point sources dominates over the background within 3 kpc, dissociating H2 and thus delaying Pop III star formation in nearby haloes (Machacek, Bryan & Abel, 2001; Wise & Abel, 2007b; O’Shea & Norman, 2008). To calculate its intensity as a function of time, we use the semi-analytical model of Wise & Abel (2005), updated with the 7-year WMAP parameters and optical depth to Thomson scattering. The LW radiation intensity is plotted in Fig. 2. In this semi-analytical model, we use a Pop III stellar mass of 100 , star formation efficiency of 0.005, and escape fraction of 0.2 (Wise & Cen, 2009). The intensity decreases after because Pop II star formation becomes dominant, which produce less LW specific luminosity than Pop III stars that have surface temperatures of K. For computational convenience, we fit the background evolution with the function
| (16) |
where and is the specific intensity in units of erg s-1 cm-2 Hz-1 sr-1. This fits the model data within 1 per cent in and is consistent with values in Trenti & Stiavelli (2009).
4 Results
We concentrate on the most massive halo in the simulation to demonstrate the effects of momentum transfer from ionising radiation. For reasons discussed later, the halo in the MC simulation overcools and forms stars at high specific SFR, which ionises the entire simulation volume at . Solving the radiative transfer equation with enzo+moray in this simulation becomes computationally unfeasible in the optically thin limit, so we stop the MC simulation here and compare the halo in the three simulations that this point.
At redshift 8.1, the halo has a DM mass of , corresponding to a virial temperature K and circular velocity of 21 km s-1. This halo experienced a major merger at . It is undergoing a major merger at that increases the virial temperature to K at which point it can efficiently form stars. The gas fraction of the halo has recovered to 0.13, previously being depleted to under 5 per cent in the Pop III hosting progenitors that had its gas expelled by stellar and supernova feedback. Here is the total mass (including DM) of the halo. At this time, the Base, MC, and RP simulations have a stellar mass of , , and , respectively. By redshift 7, its total mass is , containing of stars in the Base simulation. We refer the reader to Paper I for more details at .
4.1 Comparison of star formation histories
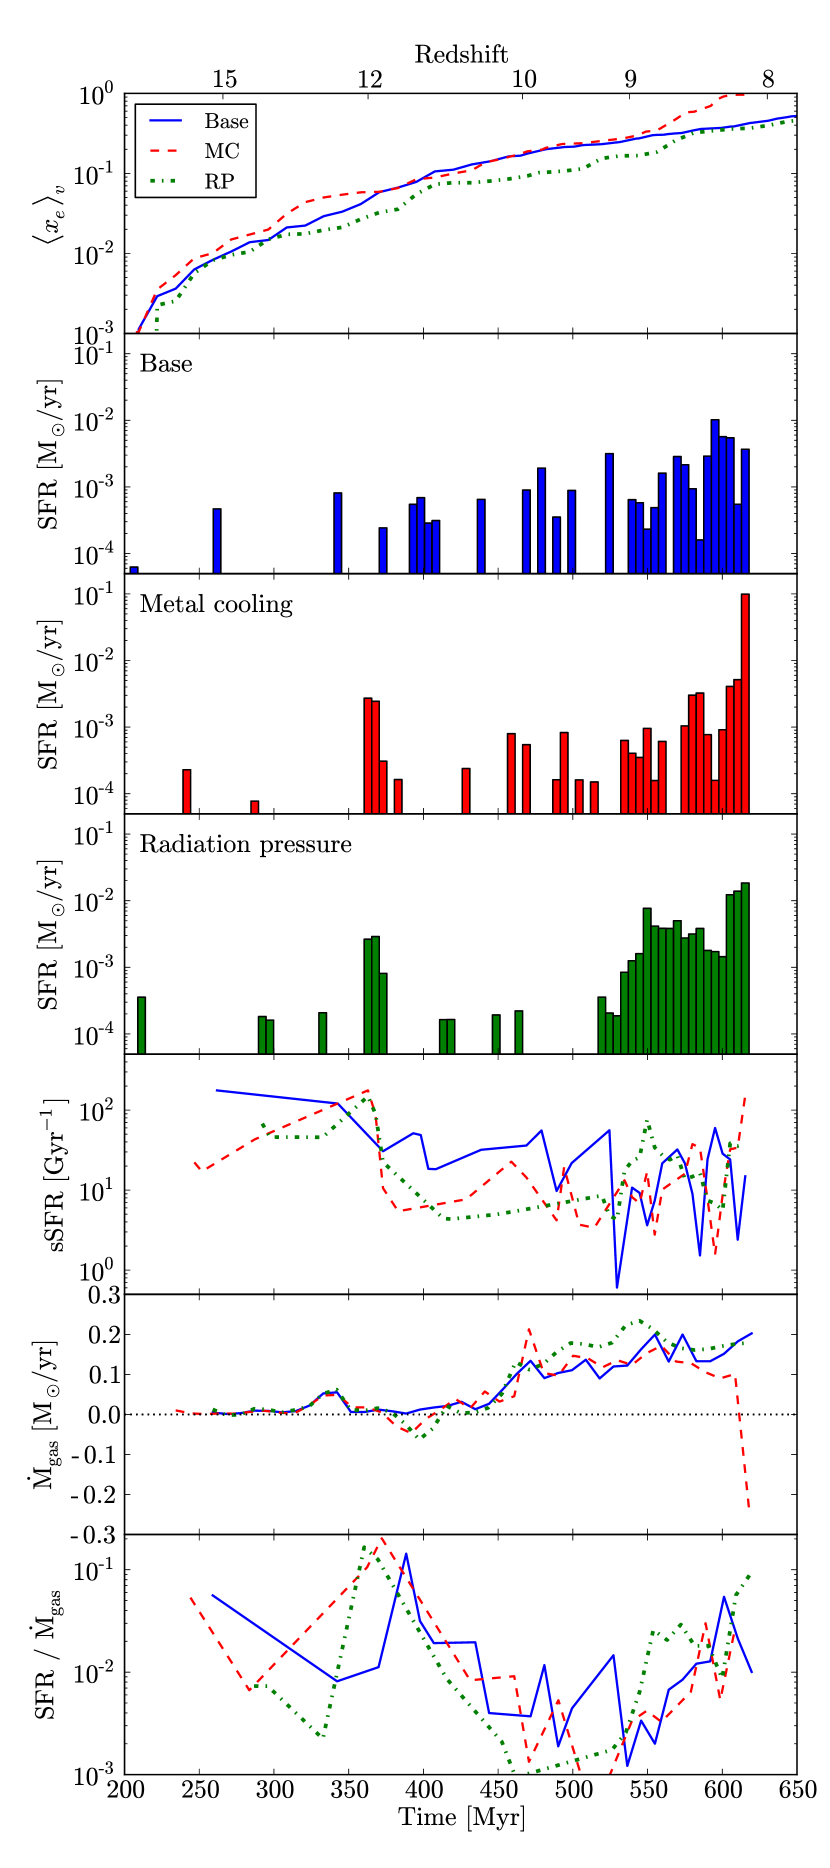
The top panel in Figure 3 shows the evolution of the ionised volume fraction of all three simulations. The second, third, and fourth panels show the star formation rate (SFR). The specific SFR (sSFR), the gas accretion rate , and the ratio of SFR to are shown in the bottom three panels. At redshift 12, both MC and RP simulations produce metal-enriched stars after the halo reaches the filtering mass (Gnedin & Hui, 1998; Gnedin, 2000; Wise & Abel, 2008) of . The burst in the Base simulation is slightly delayed and weaker by an order of magnitude because of the lack of metal cooling. In all three simulations, about 15 per cent of the accreted gas is converted into stars. Radiative and supernova feedback in the stronger bursts of the MC and RP runs drive a net outflow from the halo, seen in negative values of .
The halo continues to accrete from numerous minor mergers of haloes until . One notable difference in the RP simulation is the enhanced gas accretion between redshift 9 and 10. Here, the UV background suppresses Pop III star formation in minihaloes by increasing the minimum mass to cool and condense by H2 alone (Machacek, Bryan & Abel, 2001; Wise & Abel, 2007b; O’Shea & Norman, 2008). This results in more gas-rich mergers, thus increasing the gas accretion rate. The halo continues this constant but slow mass buildup until a major merger at . Before the major merger, the SFRs are similar between and M⊙ yr-1 in the simulations with the RP simulation sustaining a more consistent SFR mainly because of the additional gas accretion whereas the other simulations have more a bursty behavior. The galaxies convert between 0.1 and 1 per cent of the accreted gas into stars during this quiescent period before it reaches a virial temperature of 104 K.
The most significant difference between the simulations is the star formation when the halo reaches a virial temperature of K through a major merger. The Base simulation has a SFR = M⊙ yr-1 and a sSFR = 15 Gyr-1. In the MC simulation, the additional radiative cooling provided by the metal lines prompts a SFR = M⊙ yr-1 and a sSFR = 150 Gyr-1, an order of magnitude higher than the Base simulation. The radiative and supernovae feedback from these stars drives a net gas outflow of –0.2 M⊙ yr-1 from the halo, as seen in the fourth panel of Figure 3, but cannot abate the star formation alone. Momentum input from massive stars in the RP simulation reduces the SFR by a factor of five to M⊙ yr-1 and the sSFR to 37 Gyr-1. On average, approximately 3 per cent of the accreted gas forms stars in the latest star formation period, and the variations are caused by stellar feedback. At , the enhanced star formation in the MC simulation ionises 96 percent of the simulation volume, which is in stark comparison with the Base and RP simulations with ionised fractions of 42 and 36 percent, respectively. The RP ionised fraction is slightly lower because of the suppression of Pop III SF from the LW background.
Observations of star-forming galaxies show a tight relation between sSFR and stellar mass, and we can compare our results to determine our most physical model. Massive () galaxies at have , flattening to an upper threshold of 2.5 Gyr-1 in low-mass galaxies (Karim et al., 2011). At , Stark et al. (2009) found a strong sSFR- correlation with a similarly large scatter (see Figure 1 in Khochfar & Silk, 2011). In that work, the average SFR is M⊙ yr-1 in systems between and , or equivalently, an average of 30 Gyr-1 in stellar systems of . Galaxies at also show a large scatter in sSFR, ranging from 1 to 100 Gyr-1 for galaxies with stellar masses between and , trending toward higher sSFRs in smaller systems (Schaerer & de Barros, 2010; McLure et al., 2011; Khochfar & Silk, 2011). Do high-redshift galaxies have more gas available for star formation to sustain sSFR 2.5 Gyr-1, as suggested by the data? Does this relation continue to the very smallest galaxies at high-redshift? If we assume so, the MC simulation produces the best match with the other models falling below the relation. This goes against intuition in that a more realistic model, in our case, adding radiation pressure and a LW background, produces more realistic galaxies. To further understand this behavior, we must investigate the gaseous properties and stellar population of the galaxy.
4.2 Overcooling and artificially enhanced star formation
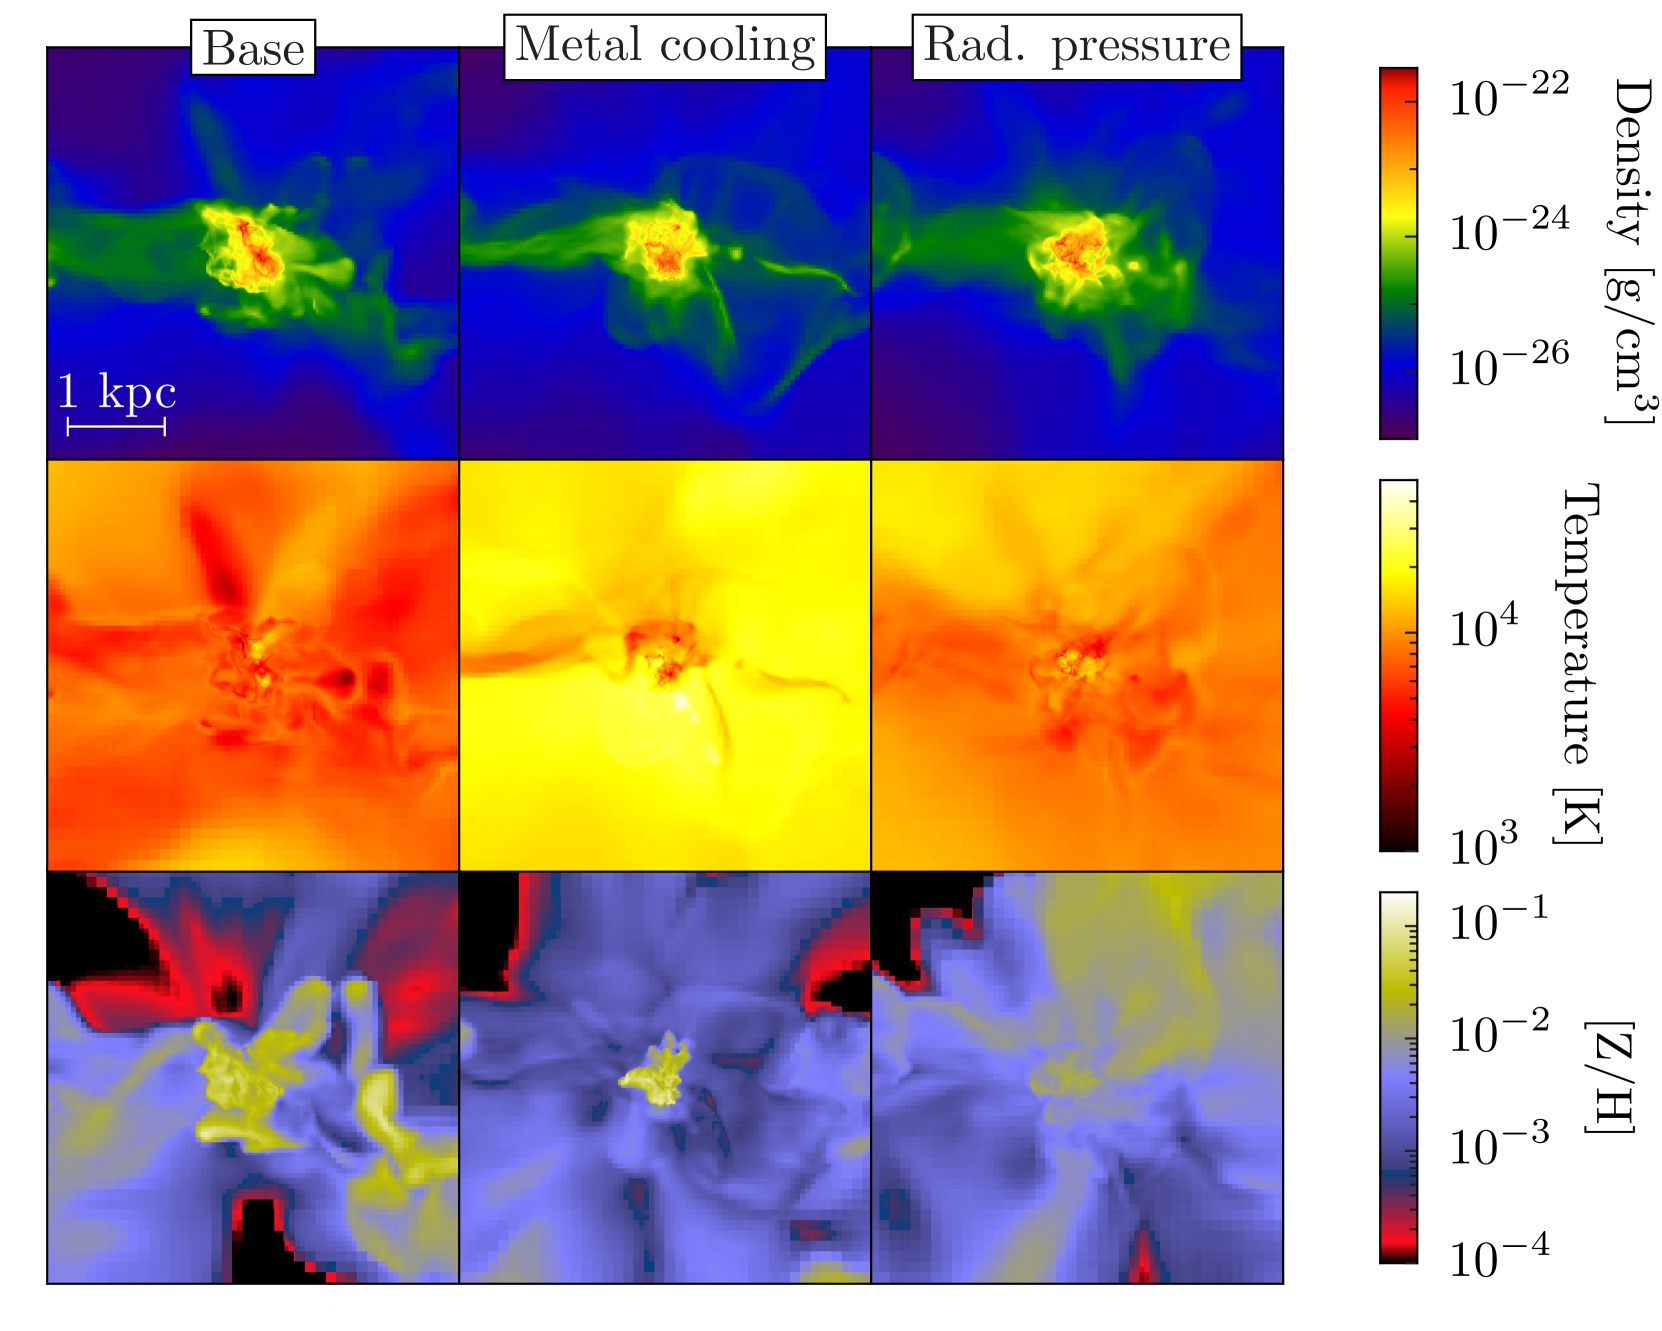
Here we concentrate on the causes behind the enhanced star formation in the metal cooling simulation when compared to the Base simulation. Figure 4 shows density-weighted projections of gas density, temperature, and total metallicity for the three simulations. The gas distributions are irregular and have no organised disc rotation in any of the runs. There are three DM filaments that accrete onto the halo, which is typical of rare peaks (e.g., Dekel et al., 2009; Danovich et al., 2011). Only one filament has retained its gas, which is located to the left of the halo in Figure 4. The other filaments have been photo-evaporated and Jeans-smoothed by stellar radiation. As previously mentioned, the MC simulation is nearly fully ionised with an average intergalactic medium (IGM) temperature of K, clearly seen in the temperature projections. The additional pressure provided by the heated IGM compresses the filament in comparison with the Base and RP simulations.
The spatial metallicity distributions are the most relevant in understanding the SFR deviations between the simulations. In the Base simulation, the metal-rich outflows with [Z/H] between –1 and –2 can be seen expanding out to a radius of kpc. The MC simulation produces a factor of three more stars, but the metal-rich ejecta are restricted in a small volume with a radius of kpc with a mean metallicity of [Z/H] = –0.5. These metal-rich regions are surrounded by a metal-poor interstellar medium (ISM) with .
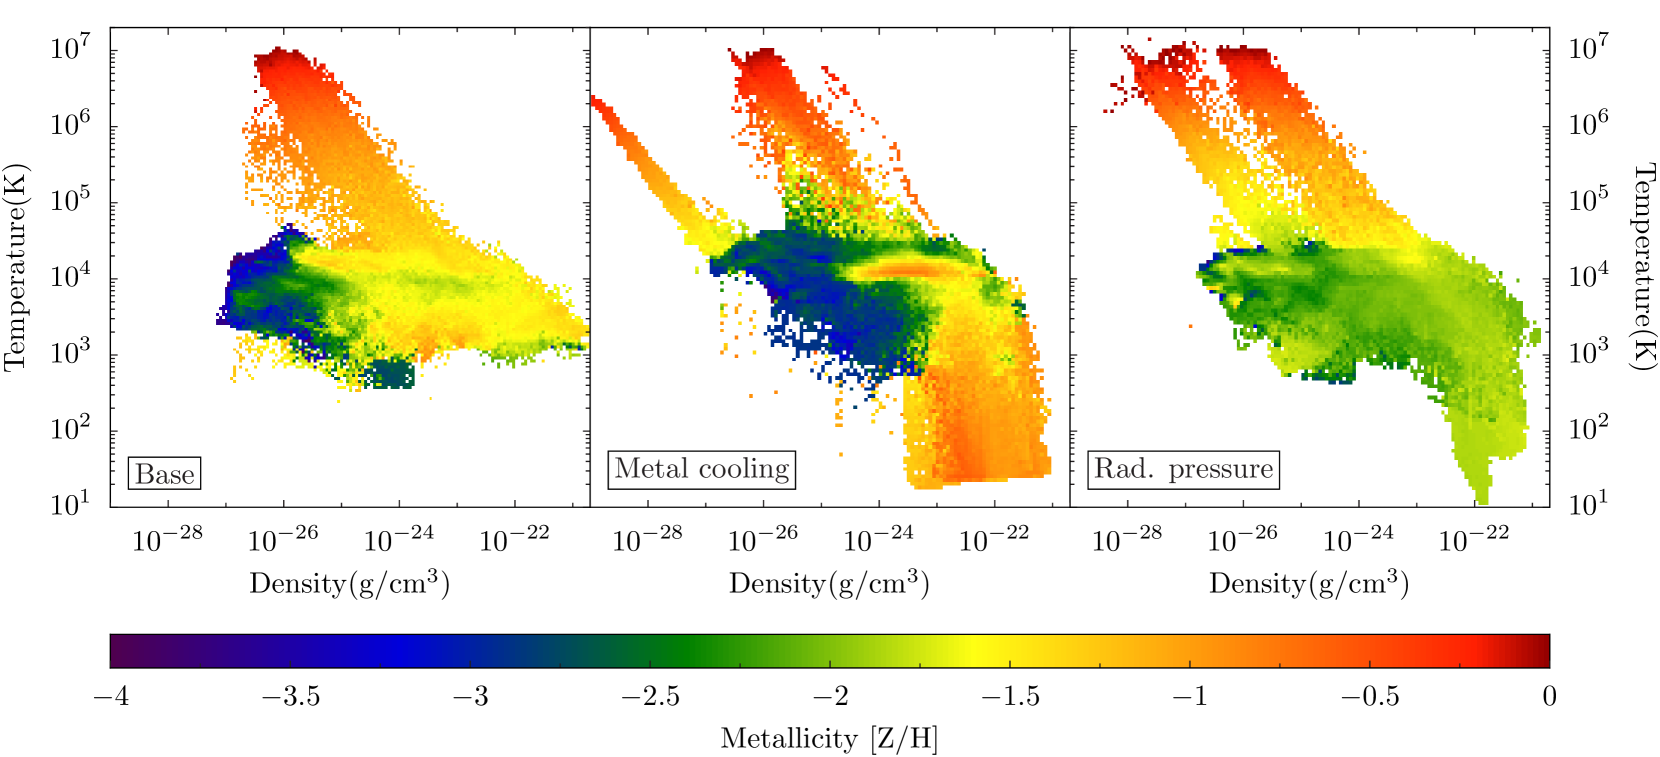
Figure 5 shows the metallicity as a function of density and temperature, and it further illustrates the differences that metal cooling induces. Without metal cooling in the Base simulation, the gas can only cool to K through H2 cooling in the gas phase. The metals are mixed to an average of in gas with . The nearly solar metallicity isobars reaching K are Type II SNe remnants. When metal cooling is considered, the relatively metal-rich () material is mainly confined to the cold phase of the ISM above 1 cm-3 and below 1000 K down to the CMB temperature. This cold, metal-rich gas mixes little with the surrounding diffuse ISM that has a mean metallicity of .
Because stars form in cold and dense gas, the stellar metallicities reflect the gas metallicities in the cold phase. They can be a plausibility check as they can be indirectly compared to observed metallicities in local dwarf galaxies, which have a clear luminosity-metallicity relationship that increases from [Fe/H] = –2.5 to –1.5 over a luminosity range log = 3–7 (Kirby et al., 2011).
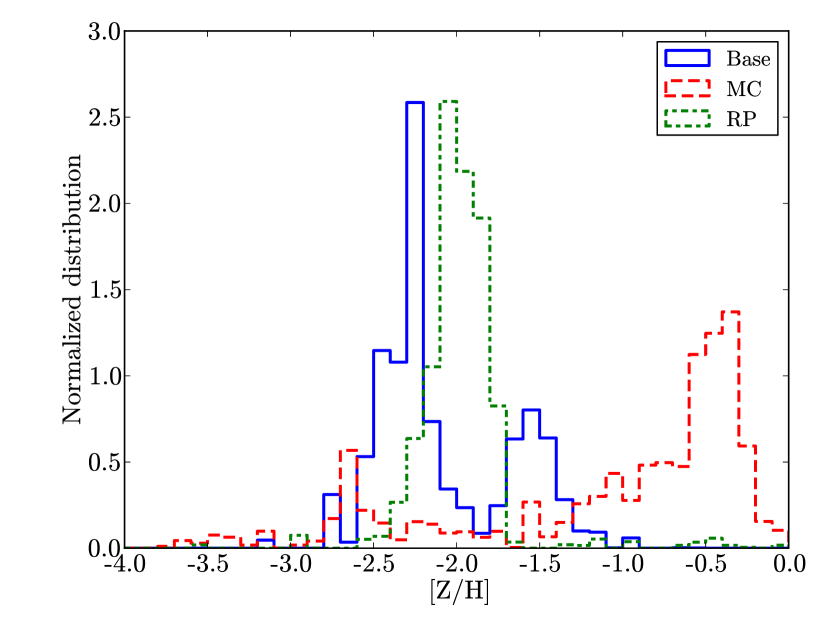
Figure 6 compares the metallicity distribution functions (MDFs) in the most massive galaxy at in each simulation. The Base simulation has a bimodal distribution within the range [Z/H] . The lower metallicity stars were formed before the halo reaches K. Afterward, the stars quickly enrich the halo to [Z/H] –1.5, which forms stars at similar metallicities, creating a bimodal MDF. This process is described in more detail in Paper I. A similar enhancement in star formation occurs in the MC simulation at K but to a greater extent because of higher cooling rates and thus star formation rates. Stars primarily form in the inner 500 pc, where the gas is enriched to [Z/H] –0.5 because the metal-rich ejecta is confined within these inner regions.
These metallicities are a factor of 30 above the luminosity-metallicity relationship and suggest that our MC model produces galaxies that are too luminous and metal-rich. The extra radiative cooling from metal species allows for the super-solar SNe ejecta to lose most of its thermal energy before it launches a high-velocity outflow, and most of the ejecta are trapped within the galaxy. Then this metal-rich material cools again and condenses into star forming clouds. This process repeats several times, creating a runaway effect in overproducing stars, known as the well-known and studied numerical “overcooling problem” that produces galaxies that are too centrally concentrated (first reported by Katz, Weinberg & Hernquist, 1996). This was solved by introducing SNe feedback and conducting the simulations at higher resolutions; however, our calculations show the same problem at parsec-scale spatial resolution and despite resolved SNe feedback.
4.3 Effects of radiation pressure
We find that momentum transfer from ionising radiation to the absorbing gas alleviates the overcooling problem seen in the MC simulation. Recall that at , the SFR is reduced by a factor of five compared to the MC simulation. To understand this difference, we focus on its effect on internal gas dynamics and the chemo-thermal state of the gas, the increased ejecta dispersion from their origin, and the ensuing star formation.
4.3.1 Gas dynamics
Unlike the thermal energy produced by SN feedback, momentum must be conserved and is not lost to radiative processes. The momentum transferred to the absorbing gas generates a medium in the central 100 pc that is both turbulent and expanding radially, where the young stars and their H ii regions are clustered. As the D-type shocks expand with the ionisation fronts, momenta from the absorbed photons are transferred to the optically thick shock. Their cumulative action produces an average outflow in the inner 100 pc, which is visible in the radial profile of the mass-averaged radial velocity, shown in the top panel of Figure 7. The radial velocity is calculated after subtracting the mass-averaged bulk velocity of the halo. In the central 15 pc, the mass-averaged radial velocity is 20 km s-1, and it gradually decreases to 2 km s-1 at 40 pc. This weak expansion of the inner dense gas extends out to 100 pc. In contrast, the Base and MC simulations both exhibit weak inflows up to 5 km s-1, where SN feedback is not enough to support the dense central gas.
Within the inner 100 pc, there are 49 young ( Myr) star particles with a total mass of . The interaction between the expanding shocks associated with their H ii regions and SN blastwaves creates and sustains this turbulent medium. To measure the turbulent motions, we calculate the three-dimensional rms velocity as a function of radius. It is computed with respect to the mass-averaged velocity of each thick shell. On average, it is and varies little with radius, indicating that turbulence is widespread throughout the halo. The turbulence is mildly supersonic at pc with turbulent Mach numbers decreasing with radius from two at the virial radius, where is the sound speed and the angled brackets denote a mass-weighted average in the shell. This is nearly the circular velocity of the halo, . In the inner 50 pc, , and it slowly decreases to 15 km s-1 at 130 pc and increases to 20 km s-1 at the virial radius. Outside 300 pc, radiation pressure has little effect on turbulent motions, where it is primarily driven by virialization (Wise & Abel, 2007a; Greif et al., 2008). The Base simulation drops to 10 km s-1 within pc as the gas cools and condenses. The loss of gaseous kinetic energy is even more apparent with metal cooling, lowering to 5 km s-1 in the inner 50 pc. This is consistent with an overcooling core that is not pressure supported by either thermal or turbulent energy.
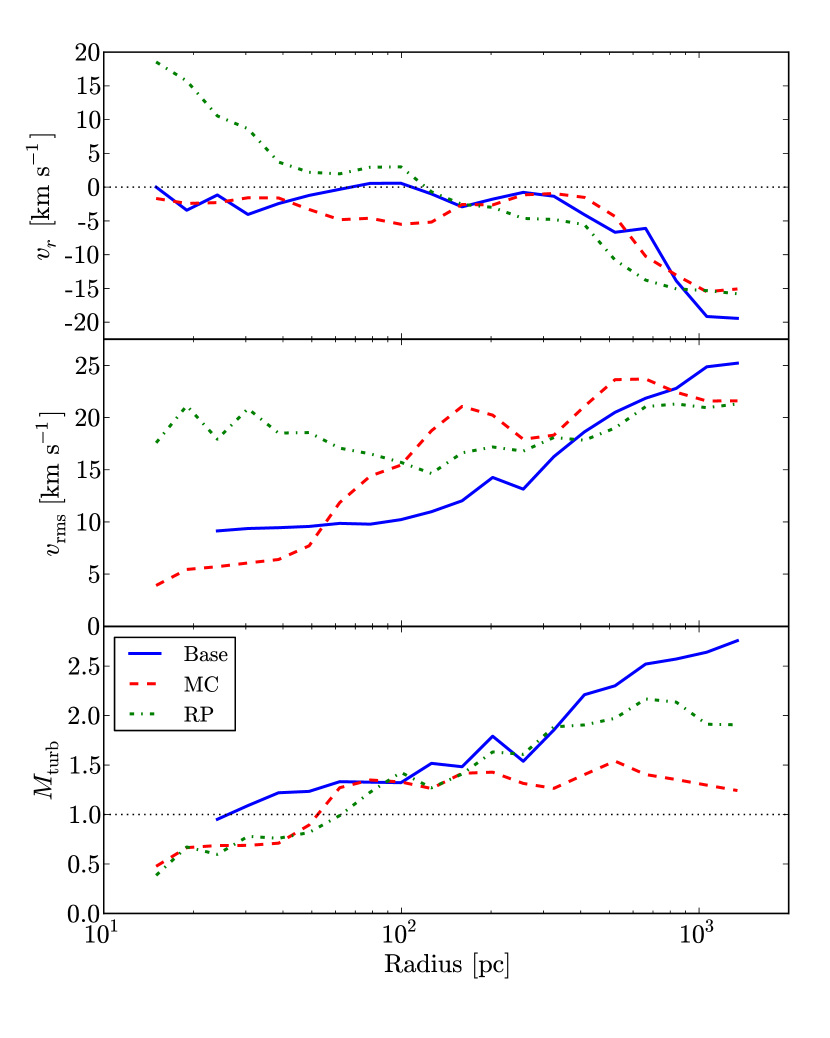
Interestingly, the turbulent Mach numbers, shown in the bottom panel of Figure 7, are almost identical in the MC and RP models in the inner 100 pc. This occurs even though the addition of momentum feedback creates a four times larger than the MC simulation. This behavior is caused two complimentary processes. First, radiation pressure creates a more diffuse medium in which the SN explosions occur, which results in a lower cooling rate and keeps the temperatures and, equivalently, sound speeds high. Second, the additional driving from radiation pressure and blastwaves that have not stalled in the ISM keep the turbulent velocities nearly equal to the halo circular velocity. These physical processes lead to an unchanged turbulent Mach in both star forming environments.
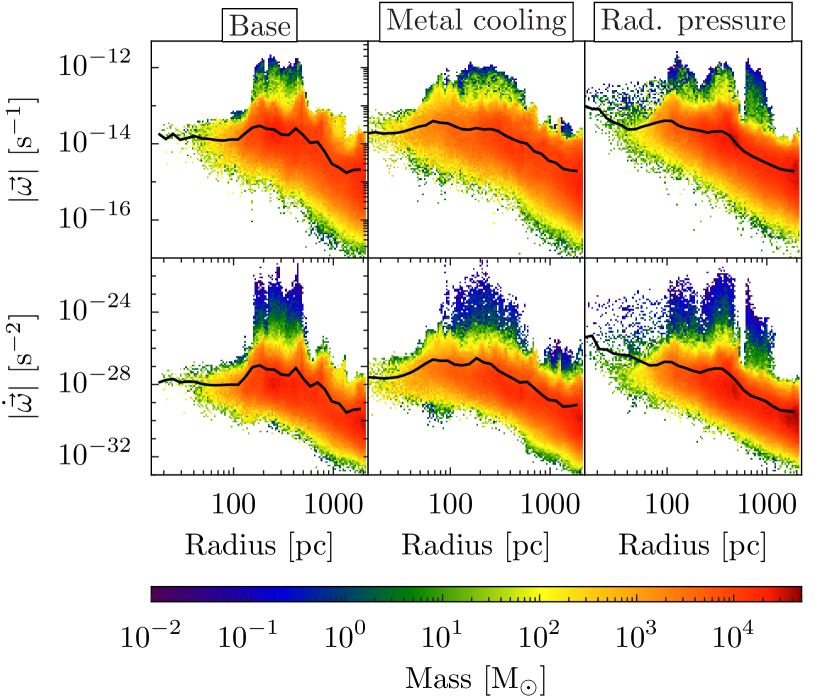
The velocity dispersion is a good measure of the general strength of turbulent motions, but the vorticity better characterises the local strength of turbulence. In Figure 8, we plot two-dimensional histograms of vorticity (top panels) as a function of radius and its growth (bottom panels), which is the right hand side of Equation (8). For the RP simulation, we include the baroclinic term from radiation pressure in our analysis, . To visualise the fluid flow, it is helpful to consider the local rotational period is . Gas with the highest vorticities exist at . This is primarily driven by virial shocks as matter is accreted from the IGM and filaments. This region is approximately where the density increases by an order of magnitude in the density projections of Figure 4. The MC and RP simulations have similar average vorticities until pc, where the RP simulation exhibits an increase of 10, whereas the MC simulation stabilises at . Vorticity generation is significantly higher by a factor of 100 within this inner region with radiation pressure. We find that non-barotropic flows from thermal pressure are primarily responsible for sustaining these turbulent motions. The contribution from vorticity stretching and radiation pressure provides and of , respectively. The very weak driving from radiation pressure does not necessarily indicate that it can be neglected. Because it adds momentum to the shells, the shocks during shell collisions are stronger and produce more vorticity through the thermal baroclinic term. The weak contribution from radiation pressure is straightforward to understand. It is strongest when the ionisation front radius is small, and the H ii is close to spherical. In the spherically symmetric case, radiation will always be absorbed parallel to the density gradient as the optical depth increases, and thus is small. In a clumpy medium, this term will be larger when radiation grazes the surface of dense clumps. It should be noted that by neglecting scattering we could be underestimating its magnitude, and our calculations are conservative in quantifying the impact of radiation pressure in the ISM of dwarf galaxies.
4.3.2 Metal mixing
The gas metallicity shown in Figure 4 show that the SN ejecta has expanded beyond the virial radius with outflows with velocities up to 250 km s-1, enriching most of the gas to [Z/H] –2. This behaviour is further illustrated in Figure 5, where the SN ejecta thoroughly mixes with the ISM at all density-temperature pairs in the cold and warm phases. This greatly differs from the lack of mixing in the MC simulation that creates a distinct separation between dense metal-rich gas and diffuse metal-poor gas.
Metal mixing is enhanced by a sustained turbulent medium, resulting in a MDF (Fig. 6) with a mean metallicity of [Z/H] = and a standard deviation of 0.2 dex. This is in excellent agreement with the luminosity-metallicity relationship for dwarf galaxies for a stellar system of (Kirby et al., 2011). This agreement suggests that radiation pressure plays an important role in regulating star formation in high-redshift dwarf galaxies.
4.3.3 Star formation regulation
We have demonstrated that momentum input from massive stars prevents the overcooling and over-enrichment of the gas in galaxy formation simulations. The additional momentum from radiation both disperses the metal-rich SN ejecta to large radii and provides turbulent support to the system. The first effect reduces the metallicity in the dense gas. This reduces the radiative cooling from metal species and the amount of cold, dense gas available for star formation. The latter effect prevents the gaseous core from catastrophically collapsing and forming stars at a high efficiency.
Our comparison between the MC and RP simulations shows that star formation is self-regulated with radiation pressure playing a vital role in early galaxy formation. To reiterate, the RP simulation creates a galaxy with a sSFR = 37 Gyr-1 and a stellar population whose MDF () is in excellent agreement with observations of local dwarf galaxies.
4.4 Radiation pressure characteristics
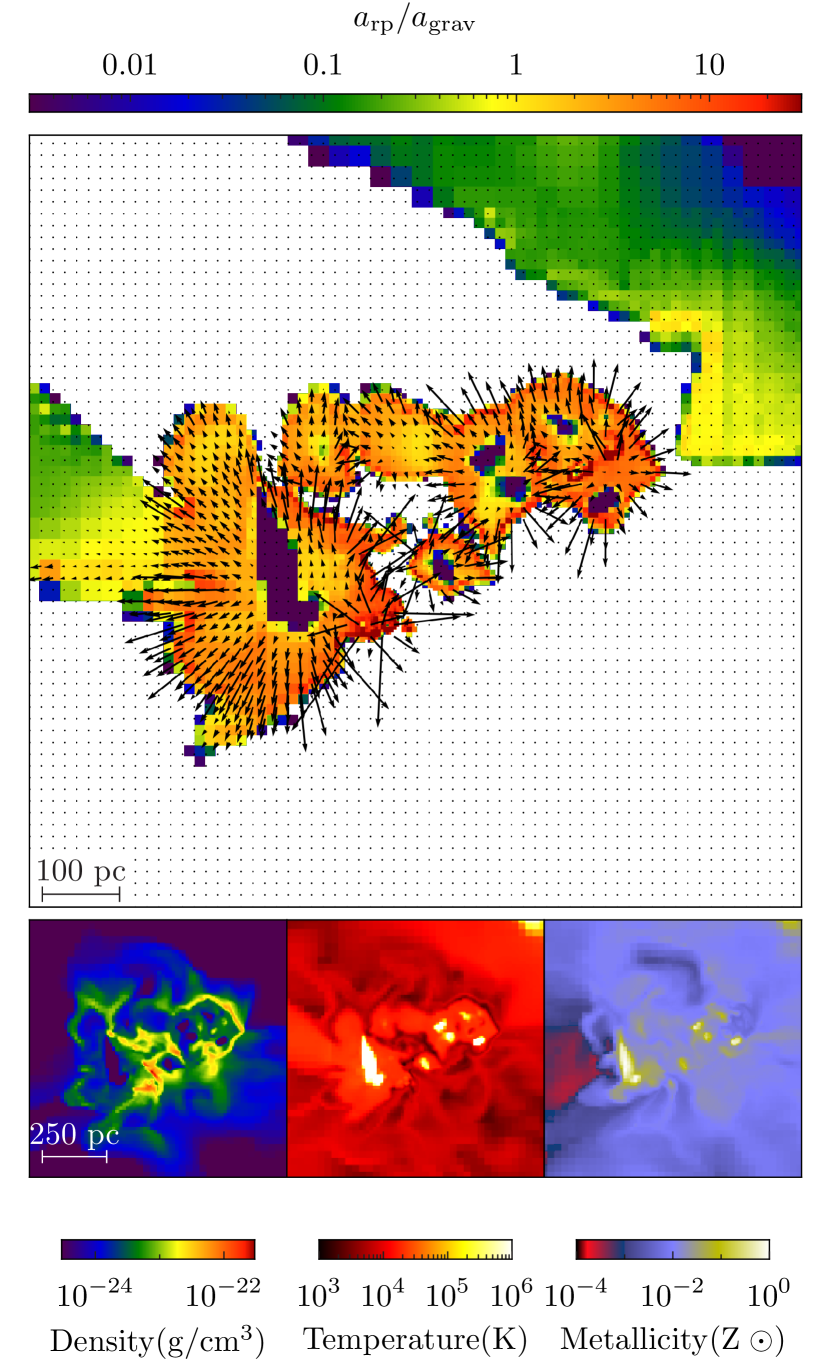
Here we describe some of the properties of radiation pressure within our largest galaxy. Figure 9 shows two-dimensional slices of acceleration from momentum transfer (Equation 15), gas density, temperature, and total metallicity through the centre of mass of the galaxy. The acceleration is scaled with respect to the gravitational acceleration at the virial radius, . The time to accelerate the gas above the escape velocity is
| (17) |
which is independent of the halo. Here and are the matter density and Hubble constant at redshift . In a matter dominated universe () for the adopted CDM cosmology, this timescale is Myr, which is possible with sustained star formation in a galaxy. However, this should be only be used to gauge the instantaneous impact of the momentum transfer because the acceleration will decrease as the shell travels farther from the source.
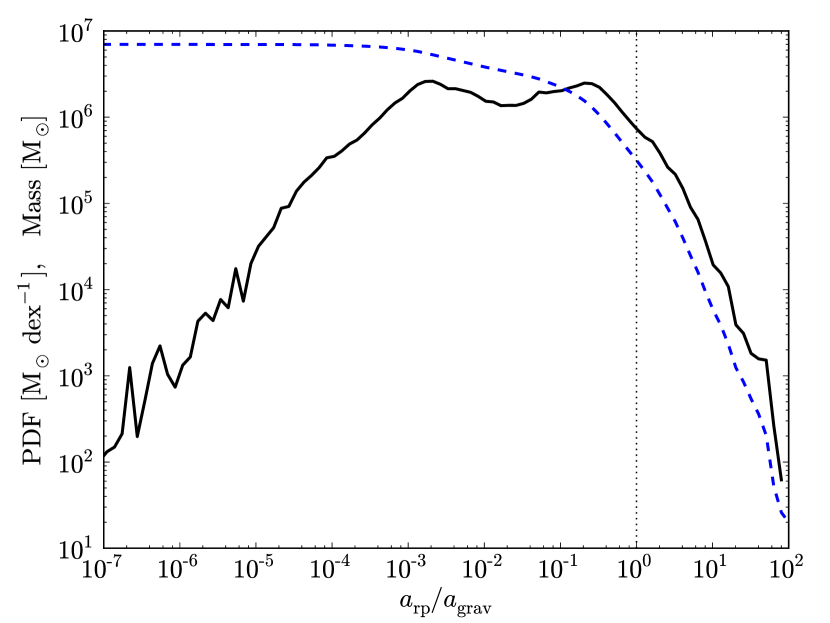
The density plot shows that the ISM is fractal and porous in nature with the H ii regions, creating dense shells on their surfaces. The acceleration exceeds 10 per cent of in most of the H ii region except for the interiors of the SN remnants, where the neutral hydrogen fraction is nearly zero. It exceeds in the dense, neutral shells surrounding the H ii regions. Figure 10 shows the probability and cumulative distribution function of / inside of this halo. There is a plateau in the distribution between and at per dex. Radiation pressure is accelerating about 4 per cent () of the halo gas greater than .
The slices of temperature and total metallicity in Figure 9 show the hot phase of the ISM, which have K and approximately solar metallicity. Our stellar feedback prescription injects SN thermal energy and metals after 4 Myr of main sequence radiative feedback. Consequently, the SN remnants are initially contained within the rarefied medium of the interior of their associated H ii regions and then expand into the ISM, and in some cases, they drive metal-rich outflows into the IGM.
5 Discussion
Stellar feedback comes in various forms. First, photo-ionisation and photo-heating from massive stars create H ii regions that provide pressure support to the warm phase of the ISM. An extreme case of photo-heating feedback exists in haloes with that host Pop III stars, where the 30 km s-1 shock launched by the H ii region can expel over 90 per cent of the gas from the halo (Whalen, Abel & Norman, 2004; Kitayama et al., 2004; Abel, Wise & Bryan, 2007). Second, SNe feedback injects thermal energy and heavy elements into the ISM, creating the hot bubbles and blastwaves. They can self-enrich their environment (e.g. Wise et al., 2012), disrupt its star-forming cloud (e.g. Draine & Woods, 1991; Whalen et al., 2008), create realistic bulgeless disc galaxies, and possibly launch large-scale outflows (Governato et al., 2010; Brook et al., 2012). Both processes together can play an important role in regulating star formation and altering gas and stellar metallicities, galactic morphologies, gas fractions, and the structure of the ISM.
Another feedback process is the momentum transfer from ionising radiation from massive stars, i.e. radiation pressure. It has been suggested that radiation pressure can regulate star formation and launch galactic outflows in large galaxies (Haehnelt, 1995; Murray, Quataert & Thompson, 2005; Murray, Ménard & Thompson, 2011; Hopkins, Quataert & Murray, 2011). In this paper, we have investigated the role of momentum deposition from ionising radiation in the formation of high-redshift dwarf galaxies. We have found that the addition of radiation pressure regulates star formation through additional turbulent support from shell collisions and allowing for SNe to drive large-scale outflows from the galaxy, ejecting metal-rich gas in the process. These effects alleviate the galaxy overcooling problem seen in various simulations of galaxy formation.
By including radiation pressure, our simulation creates realistic high-redshift dwarf galaxies that matches the local luminosity-metallicity relation. Although this is not a direct comparison between high-redshift and local dwarf galaxies, the metallicities of the stellar population is a good gauge of a reasonable ISM chemo-thermal state. If we assume that a fraction of high-redshift galaxies survive until the present-day (Gnedin & Kravtsov, 2006; Bovill & Ricotti, 2011), then the bounds of MDFs should not exceed the ones observed in local dwarf galaxies, which typically have most of their stars within the range –3 [Fe/H] –1 (Kirby et al., 2011). For instance in our MC simulation, the stars have a median metallicity of 0.3 , which will still exist in its MDF if we were to passively evolve them to . On the other hand, this galaxy is most likely to be incorporated into a galactic bulge, based on its halo mass accretion history (Wechsler et al., 2002). However, this result of overcooling is generic to galaxies reaching K and should occur in dwarf galaxies that form later. Another possible way to avoid this restriction is that these stars form from a top-heavy IMF. If all of the stars form with , then they will not survive until the present-day, and the MDFs from high-redshift dwarfs cannot be constrained by the observed MDFs in local dwarf galaxies.
5.1 Feedback prescriptions
Implementations of stellar feedback vary widely between different works. Here we discuss these variations, and their respective advantages and disadvantages. As galaxy formation simulations reach higher resolution, individual star forming clouds are being resolved. For example, Governato et al. (2010) found that a bulgeless disc galaxy forms instead of a bulge-dominated galaxy when the star formation density threshold was increased by a factor of 1000 to 100 cm-3. This occurred because the simulation allowed the gas to cool and clump into smaller associations instead of a large gas reservoir at the galaxy centre. When simulations resolve these clouds, more small-scale physical processes need to be accurately modelled, and the less previous “subgrid” models are applicable because of their original assumptions of star formation on the galactic scale.
As discussed before, there are four main components to stellar feedback: photo-ionisation, photo-heating, momentum transfer from radiation, and SN explosions, in addition to stellar winds and planetary nebulae. The temporal separation of the radiative and SNe feedback is crucial. In the case where both mechanisms have the same time-dependency, the injection of thermal energy and heavy elements are initially dumped into a dense and cold medium, unaffected by stellar radiation. If the SNe feedback is delayed for some amount of time, in our case, the minimum lifetime of an O-star of 4 Myr, then an H ii region is created surrounding the star(s), which lowers the ambient density and increases the temperature to 104 K. An optically-thick shell forms around the H ii region, and radiation pressure accelerates the shell in addition to pressure forces from the H ii region (Spitzer, 1978). After a few Myr, the massive stars start to explode in this warm and diffuse medium, instead of a cold and dense medium. Because cooling rates are , the SN remnants are less likely to overcool in an implementation that delays SNe feedback from radiative feedback.
There have been a few types of prescriptions of SNe and momentum injection to create galactic winds and to regulate star formation. For the most part, they have an unphysical basis but replicate the observed properties of outflows and cannot study the origin of the winds.
In galaxy simulations, it has been historically difficult to resolve the multi-phase ISM. In such a simulation, SNe thermal energy is injected into a large region, usually at its resolution limit. Per timestep, the total thermal energy is only sufficient to heat the gas to K, where the cooling rates are maximal. If the blastwave were resolved to parsec-scales, then the temperature in the Sedov-Taylor solution should be K, where the cooling rates are orders of magnitude lower. One approach is to neglect radiative cooling within the blastwave, allowing it to adiabatically expand (e.g. Thacker & Couchman, 2000; Governato et al., 2007; Guedes et al., 2011). Using this method results in realistic late-type galaxy morphologies, but it can deviate from the observed luminosity functions because they do not suppress star formation enough, particularly in low mass galaxies, and do not drive winds at sufficiently high velocities and mass-loading factors (e.g. Guo et al., 2010). We note that another approach is to sporadically inject thermal energy only after enough SNe thermal feedback has accumulated to heat the gas to K, where the cooling times are high. Here ejecta does not overcool and follows the Sedov-Taylor solution (Dalla Vecchia & Schaye, 2012).
Several groups (Springel & Hernquist, 2003; Oppenheimer & Davé, 2008; Dalla Vecchia & Schaye, 2008; Sales et al., 2010) have modelled momentum transfer from radiation by adding momentum, so-called “kicking”, to nearby particles to a velocity that is comparable to the circular velocity of the halo. Similar prescriptions exist for kinetic feedback from SN explosions (Dalla Vecchia & Schaye, 2008). The dependence on the choice of this kick velocity, a constant value, a constant multiple of , or halo mass dependent velocity, has been shown to replicate the galaxy luminosity function and mass-metallicity relation (Finlator & Davé, 2008). The kicked particles are decoupled from the hydrodynamics until they escape the virial radius. The authors acknowledge and warn that this implementation is phenomenological, and it is successful in quantifying the importance of momentum-driven winds in MW-like galaxies. Hopkins, Quataert & Murray (2011) used a more physical model for momentum loading that does not decouple the winds from the hydrodynamics and determines the momentum transfer directly from the stellar luminosity. The momentum transfer occurs within 10 pc, where they explore two schemes. Their stochastic model randomly kicks these nearby particles to the local escape velocity of the star-forming clump. Their continuous model adds the momentum at each timestep, where and can vary to account to uncertainties. They find that both models produce similar results. However, they do not solve the radiative transfer equation, so they must assume that the radiation is uniform within each H ii region. Radiation pressure from a non-uniform distribution of massive stars may result in some cancellation of the pressure forces in the centre of the association, while still providing an overall outward force (Socrates, Davis & Ramirez-Ruiz, 2008). In contrast, Krumholz & Thompson (2012) showed that the assumption of a uniform radiation field could lead to an overestimate the momentum transfer. As ionisation front instabilities grow, optically-thin gaps are created in the shock front, allowing for most of the flux to escape in these gaps and lowering the average momentum transfer per emitted photon.
Ultimately the location where momentum transfer occurs depends where the radiation is absorbed. To model this requires solving the radiative transfer equation. None of these models with the exception of Krumholz & Thompson utilises such a solver, but there are several simulation codes with coupled radiation transport. Momentum transfer from ionising radiation should be straightforward to implement in these codes because the absorption coefficient is already calculated and that absorbed photon momentum should be transferred to the absorbing medium, which is how enzo+moray simulates momentum loading.
5.2 Radiation trapping from dust and Lyman
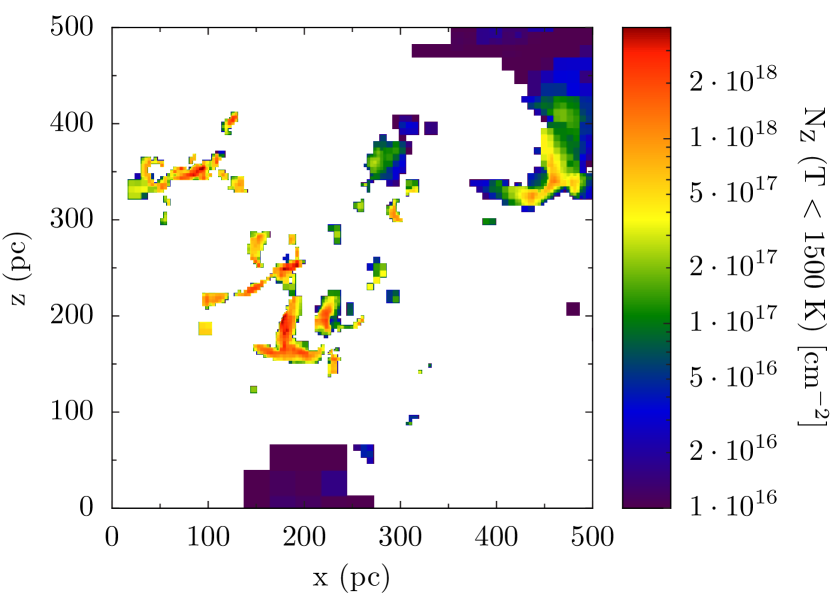
In this paper, we have neglected momentum transfer from dust absorption, which then re-radiates in the IR and absorbed again many times. Thus our results represent a lower limit of star formation regulation from radiation pressure. The effective cross section of dust in the Milky Way is cm2 per hydrogen atom in the near-IR (e.g. Draine, 2003), or equivalently, an opacity cm2 g-1 in terms of total gas mass. It should be noted that Rosseland dust opacity is temperature dependent, scaling as below 150 K and can vary by factors of a few at . Above 1500 K, even the most stable dust species are sublimated and the Rosseland opacity drops by a few orders of magnitude (Semenov et al., 2003). If we assume the dust extinction properties do not change with metallicity or redshift and scale the MW values with metallicity, the cross section per hydrogen atom scales with metallicity, giving . The optical depth to dust absorption is
| (18) |
where is the column density of metals, and and are the mean molecular weight and mass of a hydrogen atom. We take (Grevesse & Sauval, 1998). Figure 11 shows the metal column density of cold ( K) gas in the inner 500 pc of the galaxy. Dust in gas K is destroyed and is not considered in the plot. Using , the column density range corresponds to a optical depth range . In this case, the dust absorption should have little effect on radiation momentum transfer in dwarf galaxies and only becomes significant in MW-like galaxies. However, dust opacities may reach several hundred cm2 g-1 in local and distant starburst galaxies (e.g. Lehnert & Heckman, 1996; Sanders & Mirabel, 1996; Calzetti, 2001); however, see Krumholz & Thompson (2012) for a counter-argument. In this maximal case, the optical depth is of order unity and could boost the momentum transfer by a factor of a few if the dust were to couple with the gas (e.g. Murray, Quataert & Thompson, 2005).
In these low metallicity or dust-depleted cases, Lyman radiation can be trapped through resonant interactions, producing a possible significant source of radiation pressure (Henney & Arthur, 1998). This process becomes insignificant when dust opacities reach unity, where dust reprocesses UV starlight into IR. Lyman radiation accumulates in the resonances, and eventually its pressure saturates, enhancing momentum transfer by a factor of
| (19) |
where is the radius at where the gas pressure equals radiation pressure (Krumholz & Matzner, 2009). Thus we could be further underestimating radiation pressure as Lyman trapping should become important below , given similar dust properties as the MW.
6 Conclusions
We present results from three cosmological radiation hydrodynamics simulations that demonstrate the role of radiation pressure in affecting star formation in dwarf galaxies. We progressively add more physics to our simulations to understand the impact of each process. Our reference model considers primordial chemistry and Pop II and III star formation and feedback with a transition to a Salpeter IMF at . In the next model, we add radiative cooling from metals. In our final and most realistic model, we add an H2-dissociating radiation background and momentum input from stellar radiation. Our treatment of momentum transfer from ionising radiation is accurately calculated from the optical depth given by our radiation transport module enzo+moray down to our resolution limit of 1 comoving parsec. To our knowledge, this is the first cosmological galaxy simulation that has included the effects of radiation pressure that is computed from the radiative transfer equation.
The additional radiative cooling from metal species induced a runaway star formation event with a sSFR = 150 Gyr-1 and SFR = M⊙ yr-1 in our most massive galaxy with at . This strong burst creates enough ionising photons to reionise the entire 1 Mpc3 comoving domain; however, it creates a stellar population with a mean metallicity of 0.3 that does not follow the mass-metallicity relationship of dwarf galaxies. The latter fact indicates that the galaxy is overcooling and overproducing stars. Historically, this was avoided by using higher resolution and SNe feedback, but our simulations have both of these attributes. We find that radiation pressure plays a key role in regulating star formation in high-redshift dwarf galaxies. The highlights of our work on the effects of radiation pressure during the formation of a dwarf galaxy are as follows.
-
1.
Radiation pressure alone can reduce the SFR by a factor of 5 to M⊙ yr-1, and a similar decrease is seen in the sSFR to 37 Gyr-1. About 3 per cent of the accreted gas form stars in the buildup of the stellar population.
-
2.
The collision of dense shells that are driven by radiation pressure creates a turbulent medium with an rms velocity equivalent to the circular velocity of the host DM halo. This added turbulence mixes the SNe ejecta thoroughly with the entire ISM. The turbulent pressure and reduced metallicity prevents overcooling and the subsequent catastrophic collapse.
-
3.
Radiation pressure in dwarf galaxies is not sufficient to launch outflows, but it provides an additional impulse to drive dense gas away from massive stars and drive interstellar turbulence. SNe energy input is still the main mechanism to drive outflows in low-mass galaxies.
-
4.
Star formation regulation by radiation pressure creates a stellar population with a mean metallicity of with a normal metallicity distribution with standard deviation of 0.2 dex, agreeing with the mass-metallicity relationship of local dwarf galaxies.
-
5.
We show that the majority of the momentum transfer occurs in dense shells at the edges of H ii regions, i.e. it is not a local process. Furthermore, the timing of numerical radiative and SNe feedback processes is critical in capturing their effects. If the SNe feedback were to be released immediately into the ISM, densities will be artificially high and the SNe input will radiate too much of its energy. In nature, H ii region dynamics will evacuate the immediate volume surrounding massive stars of dense and cold gas, and SN explosions occur in a warmer, more diffuse ISM. Our simulations capture this temporal sequence, and the SN blastwaves do not overcool and are able to launch outflows from the galaxy.
-
6.
The column density of metals in dwarf galaxies reach a maximum value of cm-2. This may imply that that momentum transfer via dust grains is not important in low-mass early galaxies.
We have shown that radiation pressure regulates star formation in dwarf galaxies in addition to photo-heating and SNe feedback. Its inclusion in galaxy formation simulations is key in forming realistic stellar populations and avoiding the overcooling problem also in high-resolution simulations that capture star forming regions with many computational elements. The impact of radiation pressure should continue to be important in larger galaxies, and we plan to apply our numerical methods to simulating such galaxies that are currently observed in the Hubble Ultra Deep Field.
Acknowledgments
We thank Mark Krumholz and an anonymous referee for helpful comments on this manuscript. When this work started, JHW was supported by NASA through Hubble Fellowship grant #120-6370 awarded by the Space Telescope Science Institute, which is operated by the Association of Universities for Research in Astronomy, Inc., for NASA, under contract NAS 5-26555. MJT acknowledges support by the NSF CI TraCS fellowship award OCI-1048505. Computational resources were provided by NASA/NCCS award SMD-11-2258 and a director’s discretionary allocation on SDSC Trestles. This work was partially supported by NASA ATFP grant NNX08AH26G, NSF AST-0807312, and NSF AST-1109243. This research has made use of NASA’s Astrophysics Data System Bibliographic Services. The majority of the analysis and plots were done with yt (Turk et al., 2011).
References
- Abel et al. (1997) Abel T., Anninos P., Zhang Y., Norman M. L., 1997, New Astronomy, 2, 181
- Abel, Bryan & Norman (2002) Abel T., Bryan G. L., Norman M. L., 2002, Science, 295, 93
- Abel & Wandelt (2002) Abel T., Wandelt B. D., 2002, MNRAS, 330, L53
- Abel, Wise & Bryan (2007) Abel T., Wise J. H., Bryan G. L., 2007, ApJL, 659, L87
- Aguirre et al. (2001a) Aguirre A., Hernquist L., Katz N., Gardner J., Weinberg D., 2001a, ApJL, 556, L11
- Aguirre et al. (2001b) Aguirre A., Hernquist L., Schaye J., Katz N., Weinberg D. H., Gardner J., 2001b, ApJ, 561, 521
- Aguirre et al. (2001c) Aguirre A., Hernquist L., Schaye J., Weinberg D. H., Katz N., Gardner J., 2001c, ApJ, 560, 599
- Anninos et al. (1997) Anninos P., Zhang Y., Abel T., Norman M. L., 1997, New Astronomy, 2, 209
- Bally & Lada (1983) Bally J., Lada C. J., 1983, ApJ, 265, 824
- Benson (2010) Benson A. J., 2010, Physics Reports, 495, 33
- Bergin & Tafalla (2007) Bergin E. A., Tafalla M., 2007, ARA&A, 45, 339
- Bertschinger (2001) Bertschinger E., 2001, ApJS, 137, 1
- Bouwens et al. (2008) Bouwens R. J., Illingworth G. D., Franx M., Ford H., 2008, ApJ, 686, 230
- Bouwens et al. (2011) Bouwens R. J. et al., 2011, ArXiv e-prints (1105.2038)
- Bovill & Ricotti (2011) Bovill M. S., Ricotti M., 2011, ApJ, 741, 18
- Bromm & Yoshida (2011) Bromm V., Yoshida N., 2011, ARA&A, 49, 373
- Brook et al. (2012) Brook C. B., Stinson G., Gibson B. K., Roškar R., Wadsley J., Quinn T., 2012, MNRAS, 419, 771
- Bryan & Norman (1997) Bryan G. L., Norman M. L., 1997, ArXiv e-prints (astro-ph/9710187)
- Bryan et al. (1995) Bryan G. L., Norman M. L., Stone J. M., Cen R., Ostriker J. P., 1995, Computer Physics Communications, 89, 149
- Caffau et al. (2011) Caffau E. et al., 2011, Nature, 477, 67
- Calzetti (2001) Calzetti D., 2001, PASP, 113, 1449
- Cen & Ostriker (1992) Cen R., Ostriker J. P., 1992, ApJL, 399, L113
- Chabrier (2003) Chabrier G., 2003, PASP, 115, 763
- Couchman (1991) Couchman H. M. P., 1991, ApJL, 368, L23
- Dalla Vecchia & Schaye (2008) Dalla Vecchia C., Schaye J., 2008, MNRAS, 387, 1431
- Dalla Vecchia & Schaye (2012) —, 2012, ArXiv e-prints (1203.5667)
- Danovich et al. (2011) Danovich M., Dekel A., Hahn O., Teyssier R., 2011, ArXiv e-prints (1110.6209)
- Davies et al. (1998) Davies J. I., Alton P., Bianchi S., Trewhella M., 1998, MNRAS, 300, 1006
- Dekel et al. (2009) Dekel A. et al., 2009, Nature, 457, 451
- Draine (2003) Draine B. T., 2003, ARA&A, 41, 241
- Draine & Woods (1991) Draine B. T., Woods D. T., 1991, ApJ, 383, 621
- Eddington (1926) Eddington A. S., 1926, The Internal Constitution of the Stars
- Efstathiou et al. (1985) Efstathiou G., Davis M., White S. D. M., Frenk C. S., 1985, ApJS, 57, 241
- Fan, Carilli & Keating (2006) Fan X., Carilli C. L., Keating B., 2006, ARA&A, 44, 415
- Ferrara (1993) Ferrara A., 1993, ApJ, 407, 157
- Ferrarese & Merritt (2000) Ferrarese L., Merritt D., 2000, ApJL, 539, L9
- Finkelstein et al. (2010) Finkelstein S. L., Papovich C., Giavalisco M., Reddy N. A., Ferguson H. C., Koekemoer A. M., Dickinson M., 2010, ApJ, 719, 1250
- Finlator & Davé (2008) Finlator K., Davé R., 2008, MNRAS, 385, 2181
- Franco (1983) Franco J., 1983, ApJ, 264, 508
- Frebel et al. (2010) Frebel A., Simon J. D., Geha M., Willman B., 2010, ApJ, 708, 560
- Gebhardt et al. (2000) Gebhardt K. et al., 2000, ApJL, 539, L13
- Glover & Abel (2008) Glover S. C. O., Abel T., 2008, MNRAS, 388, 1627
- Gnedin (2000) Gnedin N. Y., 2000, ApJ, 542, 535
- Gnedin & Hui (1998) Gnedin N. Y., Hui L., 1998, MNRAS, 296, 44
- Gnedin & Kravtsov (2006) Gnedin N. Y., Kravtsov A. V., 2006, ApJ, 645, 1054
- Górski et al. (2005) Górski K. M., Hivon E., Banday A. J., Wandelt B. D., Hansen F. K., Reinecke M., Bartelmann M., 2005, ApJ, 622, 759
- Governato et al. (2010) Governato F. et al., 2010, Nature, 463, 203
- Governato et al. (2007) Governato F., Willman B., Mayer L., Brooks A., Stinson G., Valenzuela O., Wadsley J., Quinn T., 2007, MNRAS, 374, 1479
- Grebel, Gallagher & Harbeck (2003) Grebel E. K., Gallagher, III J. S., Harbeck D., 2003, AJ, 125, 1926
- Greif et al. (2010) Greif T. H., Glover S. C. O., Bromm V., Klessen R. S., 2010, ApJ, 716, 510
- Greif et al. (2007) Greif T. H., Johnson J. L., Bromm V., Klessen R. S., 2007, ApJ, 670, 1
- Greif et al. (2008) Greif T. H., Johnson J. L., Klessen R. S., Bromm V., 2008, MNRAS, 387, 1021
- Grevesse & Sauval (1998) Grevesse N., Sauval A., 1998, Space Science Reviews, 85, 161, 10.1023/A:1005161325181
- Guedes et al. (2011) Guedes J., Callegari S., Madau P., Mayer L., 2011, ApJ, 742, 76
- Guo et al. (2010) Guo Q., White S., Li C., Boylan-Kolchin M., 2010, MNRAS, 404, 1111
- Haehnelt (1995) Haehnelt M. G., 1995, MNRAS, 273, 249
- Heger et al. (2003) Heger A., Fryer C. L., Woosley S. E., Langer N., Hartmann D. H., 2003, ApJ, 591, 288
- Heger & Woosley (2002) Heger A., Woosley S. E., 2002, ApJ, 567, 532
- Henney & Arthur (1998) Henney W. J., Arthur S. J., 1998, AJ, 116, 322
- Hopkins, Quataert & Murray (2011) Hopkins P. F., Quataert E., Murray N., 2011, MNRAS, 417, 950
- Jubelgas et al. (2008) Jubelgas M., Springel V., Enßlin T., Pfrommer C., 2008, A&A, 481, 33
- Karim et al. (2011) Karim A. et al., 2011, ApJ, 730, 61
- Katz, Weinberg & Hernquist (1996) Katz N., Weinberg D. H., Hernquist L., 1996, ApJS, 105, 19
- Khochfar & Silk (2011) Khochfar S., Silk J., 2011, MNRAS, 410, L42
- Kirby et al. (2011) Kirby E. N., Lanfranchi G. A., Simon J. D., Cohen J. G., Guhathakurta P., 2011, ApJ, 727, 78
- Kitayama et al. (2004) Kitayama T., Yoshida N., Susa H., Umemura M., 2004, ApJ, 613, 631
- Komatsu et al. (2011) Komatsu E., et al., 2011, ApJS, 192, 18
- Kotarba et al. (2011) Kotarba H., Lesch H., Dolag K., Naab T., Johansson P. H., Donnert J., Stasyszyn F. A., 2011, MNRAS, 415, 3189
- Krumholz & Matzner (2009) Krumholz M. R., Matzner C. D., 2009, ApJ, 703, 1352
- Krumholz, Matzner & McKee (2006) Krumholz M. R., Matzner C. D., McKee C. F., 2006, ApJ, 653, 361
- Krumholz & Thompson (2012) Krumholz M. R., Thompson T. A., 2012, ArXiv e-prints (1203.2926)
- Lehnert & Heckman (1996) Lehnert M. D., Heckman T. M., 1996, ApJ, 472, 546
- Li & Shu (1996) Li Z.-Y., Shu F. H., 1996, ApJ, 472, 211
- Machacek, Bryan & Abel (2001) Machacek M. E., Bryan G. L., Abel T., 2001, ApJ, 548, 509
- Madau et al. (1996) Madau P., Ferguson H. C., Dickinson M. E., Giavalisco M., Steidel C. C., Fruchter A., 1996, MNRAS, 283, 1388
- Matzner (2007) Matzner C. D., 2007, ApJ, 659, 1394
- Matzner & McKee (1999) Matzner C. D., McKee C. F., 1999, ApJL, 526, L109
- McKee & Ostriker (2007) McKee C. F., Ostriker E. C., 2007, ARA&A, 45, 565
- McLure et al. (2010) McLure R. J., Dunlop J. S., Cirasuolo M., Koekemoer A. M., Sabbi E., Stark D. P., Targett T. A., Ellis R. S., 2010, MNRAS, 403, 960
- McLure et al. (2011) McLure R. J. et al., 2011, MNRAS, 418, 2074
- Monelli et al. (2010) Monelli M. et al., 2010, ApJ, 722, 1864
- Murray, Ménard & Thompson (2011) Murray N., Ménard B., Thompson T. A., 2011, ApJ, 735, 66
- Murray, Quataert & Thompson (2005) Murray N., Quataert E., Thompson T. A., 2005, ApJ, 618, 569
- Nomoto et al. (2006) Nomoto K., Tominaga N., Umeda H., Kobayashi C., Maeda K., 2006, Nuclear Physics A, 777, 424
- Norman & Silk (1980) Norman C., Silk J., 1980, ApJ, 238, 158
- Omukai & Yoshii (2003) Omukai K., Yoshii Y., 2003, ApJ, 599, 746
- Oppenheimer & Davé (2008) Oppenheimer B. D., Davé R., 2008, MNRAS, 387, 577
- O’Shea et al. (2004) O’Shea B. W., Bryan G., Bordner J., Norman M. L., Abel T., Harkness R., Kritsuk A., 2004, ArXiv e-prints (astro-ph/0403044)
- O’Shea & Norman (2007) O’Shea B. W., Norman M. L., 2007, ApJ, 654, 66
- O’Shea & Norman (2008) —, 2008, ApJ, 673, 14
- Osterbrock (1989) Osterbrock D. E., 1989, Astrophysics of gaseous nebulae and active galactic nuclei, Osterbrock, D. E., ed.
- Ouchi et al. (2010) Ouchi M. et al., 2010, ApJ, 723, 869
- Safranek-Shrader, Bromm & Milosavljević (2010) Safranek-Shrader C., Bromm V., Milosavljević M., 2010, ApJ, 723, 1568
- Sales et al. (2010) Sales L. V., Navarro J. F., Schaye J., Dalla Vecchia C., Springel V., Booth C. M., 2010, MNRAS, 409, 1541
- Sanders & Mirabel (1996) Sanders D. B., Mirabel I. F., 1996, ARA&A, 34, 749
- Schaerer (2002) Schaerer D., 2002, A&A, 382, 28
- Schaerer (2003) —, 2003, A&A, 397, 527
- Schaerer & de Barros (2010) Schaerer D., de Barros S., 2010, A&A, 515, A73
- Semenov et al. (2003) Semenov D., Henning T., Helling C., Ilgner M., Sedlmayr E., 2003, A&A, 410, 611
- Shapiro (1986) Shapiro P. R., 1986, PASP, 98, 1014
- Shu et al. (1991) Shu F. H., Ruden S. P., Lada C. J., Lizano S., 1991, ApJL, 370, L31
- Smith, Sigurdsson & Abel (2008) Smith B., Sigurdsson S., Abel T., 2008, MNRAS, 385, 1443
- Socrates, Davis & Ramirez-Ruiz (2008) Socrates A., Davis S. W., Ramirez-Ruiz E., 2008, ApJ, 687, 202
- Spitzer (1978) Spitzer L., 1978, Physical processes in the interstellar medium, Spitzer, L., ed.
- Springel & Hernquist (2003) Springel V., Hernquist L., 2003, MNRAS, 339, 289
- Stark et al. (2009) Stark D. P., Ellis R. S., Bunker A., Bundy K., Targett T., Benson A., Lacy M., 2009, ApJ, 697, 1493
- Tegmark et al. (1997) Tegmark M., Silk J., Rees M. J., Blanchard A., Abel T., Palla F., 1997, ApJ, 474, 1
- Thacker & Couchman (2000) Thacker R. J., Couchman H. M. P., 2000, ApJ, 545, 728
- Thompson, Quataert & Murray (2005) Thompson T. A., Quataert E., Murray N., 2005, ApJ, 630, 167
- Tolstoy, Hill & Tosi (2009) Tolstoy E., Hill V., Tosi M., 2009, ARA&A, 47, 371
- Tolstoy et al. (2004) Tolstoy E. et al., 2004, ApJL, 617, L119
- Toro, Spruce & Speares (1994) Toro E. F., Spruce M., Speares W., 1994, Shock Waves, 4, 25, 10.1007/BF01414629
- Tremaine et al. (2002) Tremaine S. et al., 2002, ApJ, 574, 740
- Trenti & Stiavelli (2009) Trenti M., Stiavelli M., 2009, ApJ, 694, 879
- Truelove et al. (1997) Truelove J. K., Klein R. I., McKee C. F., Holliman, II J. H., Howell L. H., Greenough J. A., 1997, ApJL, 489, L179+
- Turk et al. (2011) Turk M. J., Smith B. D., Oishi J. S., Skory S., Skillman S. W., Abel T., Norman M. L., 2011, ApJS, 192, 9
- Wang & Abel (2009) Wang P., Abel T., 2009, ApJ, 696, 96
- Wechsler et al. (2002) Wechsler R. H., Bullock J. S., Primack J. R., Kravtsov A. V., Dekel A., 2002, ApJ, 568, 52
- Whalen, Abel & Norman (2004) Whalen D., Abel T., Norman M. L., 2004, ApJ, 610, 14
- Whalen et al. (2008) Whalen D., van Veelen B., O’Shea B. W., Norman M. L., 2008, ApJ, 682, 49
- Wise & Abel (2005) Wise J. H., Abel T., 2005, ApJ, 629, 615
- Wise & Abel (2007a) —, 2007a, ApJ, 665, 899
- Wise & Abel (2007b) —, 2007b, ApJ, 671, 1559
- Wise & Abel (2008) —, 2008, ApJ, 685, 40
- Wise & Abel (2011) —, 2011, MNRAS, 414, 3458
- Wise & Cen (2009) Wise J. H., Cen R., 2009, ApJ, 693, 984
- Wise et al. (2012) Wise J. H., Turk M. J., Norman M. L., Abel T., 2012, ApJ, 745, 50
- Woodward & Colella (1984) Woodward P., Colella P., 1984, Journal of Computational Physics, 54, 115
- Woosley & Weaver (1995) Woosley S. E., Weaver T. A., 1995, ApJS, 101, 181
- Yorke, Tenorio-Tagle & Bodenheimer (1983) Yorke H. W., Tenorio-Tagle G., Bodenheimer P., 1983, A&A, 127, 313