Benchmarking van der Waals Density Functionals with Experimental
Data:
Potential Energy Curves for H2 Molecules on Cu(111), (100), and
(110) Surfaces
Abstract
Detailed physisorption data from experiment for the H2 molecule on low-index Cu surfaces challenge theory. Recently, density-functional theory (DFT) has been developed to account for nonlocal correlation effects, including van der Waals (dispersion) forces. We show that the functional vdW-DF2 gives a potential-energy curve, potential-well energy levels, and difference in lateral corrugation promisingly close to the results obtained by resonant elastic backscattering-diffraction experiments. The backscattering barrier is found selective for choice of exchange-functional approximation. Further, the DFT-D3 and TS-vdW corrections to traditional DFT formulations are also benchmarked, and deviations are analyzed.
pacs:
31.15.E-,71.15.Mb,71.15.NcI Introduction
The van der Waals (vdW) or dispersion interactions play important roles in defining structure, stability, and function for molecules and materials. Our understanding of chemistry, biology, solid state physics, and materials science benefits greatly from density-functional theory (DFT). This in principle exact theory for stability and structure of electron systems Kohn is computationally feasible also for complex and extended systems. However, in practice, approximations have to be made to describe exchange and correlation (XC) of the participating electrons KohnSham . This work aims at benchmarking some XC descriptions of nonlocal correlations that describe vdW interactions LeeEtAl10 ; Grimme ; TS .
To boil down the intricate electronic dynamics behind the vdW interaction into a density functional is a formidable task. should depend only on the electron density and do that in the right and generally applicable way. It should obey fundamental physical laws, like charge conservation and time invariance, and have a physically sound account of system and interactions. The vdW-DF method dion2004 ; LeeEtAl10 has such ambitions. There are more pragmatic methods, including those correcting traditional DFT calculations with pairwise vdW potentials, like the DFT-D Grimme and TS-vdW TS methods. Further, first-principles electron-structure calculations are made efficient but still carry much higher computational costs than DFT. An example is the random-phase approximation (RPA) to the correlation energy used as a suitable complement to the exact exchange energy HarlKresse2009 .
The results obtained from particular XC functionals and other vdW descriptions can be assessed by comparing with other accurate electron-structure theories like those presented in Refs. Jurecka2006, ; Takatani2010, , or with experiments. Typically one or two measurable quantities are available, like in Ref. Svetla, . In Ref. LeeEtAl10, some of us stressed the importance of exploiting extended and accurate experimental data sets when these are available. Here, we extend this comparison by considering several facets of the Cu surface.
Surface physics has a long and successful tradition of detailed and informative experiment-theory comparisons and offers possibilities also here. Extensive data sets are available for systems and conditions where the weak vdW forces can be reached and accurately mapped. A full physisorption potential and a detailed characterization thereof have been derived from versatile, accurate, and clearly interpretable measurements. In the physisorption regime, resonant elastic backscattering-diffraction experiments from low-index crystal faces provide a detailed quantitative knowledge. The actual data bank is rich and covers results, for instance for the whole shape of the physisorption potential, for the differences in corrugation across several facets, and for the energy levels in the potential well.
This Paper compares state-of-the-art vdW descriptions of physisorption of H2 and D2 molecules on the low-indexed Cu surfaces with physisorption potentials constructed from selective-adsorption bound-state measurements. These data were analyzed in the early 90s in model systems andersson1993 ; perandersson1993 ; persson2008 . In general terms, the measurements, calculations, and analysis underline the importance of building in the essential surface-physics into vdW functionals and other vdW accounts.
An earlier study of H2 on the close-packed Cu(111) surface shows some spread in the results from different vdW accounts and that one of the tested XC functionals (vdW-DF2) compares promisingly with the experimental physisorption potential h2cu . This motivates an extension of the study to the hydrogen molecule on other, more corrugated Cu surfaces. This paper is a significant extension of Ref. h2cu, , addressing questions that were not resolved back in 1993 andersson1993 ; perandersson1993 ; persson2008 , for instance, trends with crystal face.
The outline, beyond this introduction, is as follows: First a brief review of physisorption, in particular on metal surfaces, and a review of the traditional description. This is followed by a presentation of some DFTs with accounts of vdW forces, a presentation of the systems studied, and a review of the experimental benchmark sets. Next, calculated results for Potential-Energy Curves (PECs) and other physical quantities are presented, and the Paper is concluded with comparisons, analysis, and outlook for future functionals.
II Physisorption and Weak Adsorption
Chemically inert atoms and molecules adsorb physically on cold metal surfaces persson2008 . Characteristic desorption temperatures range from only a few K to tens of K, while adsorption energies range from a few meV to around 100 meV. These values may be determined from measurements of thermal desorption and isosteric heat of adsorption. For light adsorbates, like He and H2, gas-surface-scattering experiments provide a more direct and elegant method which involves the elastic backscattering with resonance structure. The bound-level sequences in the potential well can be measured with accuracy and in detail. Isotopes with widely different masses (3He, 4He, H2, D2) are available. This permits a unique assignment of the levels and a determination of the well depth and ultimately a qualified test of model potentials Roy .
The potential well is formed by the vdW attraction which arises from adsorbate-substrate electron correlation. At large distances from the surface the vdW attraction goes like . Here is the distance normal to the surface, measured from the center-of-mass of the particle to a surface reference plane close to the outermost layer of ion-cores in the solid, the so-called vdW plane. Near the surface the short-range repulsion, the “corrugated wall”, acts.
Specifically, we consider molecules that physisorb on metal surfaces where no significant change in the electronic configuration takes place upon adsorption. The weak coupling to electronic excitations SchGunnars1980 makes the adsorption largely electronically adiabatic. The energy transfer occurs through the phonon system of the solid lattice Brenig1987 . These conditions are expected to hold for hydrogen molecules on simple or noble metals.
In early days, atom- and molecule-diffraction studies of metallic single-crystal surfaces were lagging behind those of ion-crystal surfaces. On metals, diffraction spots appear much weaker, which reflects the much weaker corrugation of close-packed metal surfaces Boato , than on an ionic crystal, like LiF(100) Garcia .
In the traditional picture of physisorption, the interaction between an inert adparticle and a metal surface is approximated as a superposition of the long-ranged and a short-range Pauli repulsion, . The latter is due to the overlap between wavefunction tails of the metal conduction electrons and the closed-shell electrons of the adparticle zaremba1977 ; HarrisNordlander ; persson2008 ,
| (1) |
Here approximately
| (2) |
and
| (3) |
now with measured from the “jellium” edge jelliumedge . is an effective potential. It arises as a lateral and adsorption-angle average of an underlying adsorption potential. We use to express the amplitude of the modulation around the average .
The repulsive potential has a prefactor that can be determined from the shifts of the metal one-electron energies caused by the adparticle. It can also be calculated by, for example perturbation theory in a pseudo-potential description of the adparticle and a jellium-model representation of the metal surface andersson1993 .
The strength of the asymptotic vdW attraction, , and the reference-plane position, , depend on the dielectric properties of the metal substrate and the adsorbate ZarembaKohn1976 ; Liebsch1986 . The prefactor in the potential of Eq. (3) introduces a saturation of the attraction at atomic-scale separations. The function [ in some accounts] lacks a rigorous prescription and thus includes some level of arbitrariness for . Experimental data provides a possible empirical solution to this dilemma.
The physisorption potential in Eq. (1) depends on the details of the surface electron structure both via the electron spill out () and the spatial decay of polarization properties in the surface region (). Accordingly, there is a crystal-face dependence of for a given adparticle persson2008 .
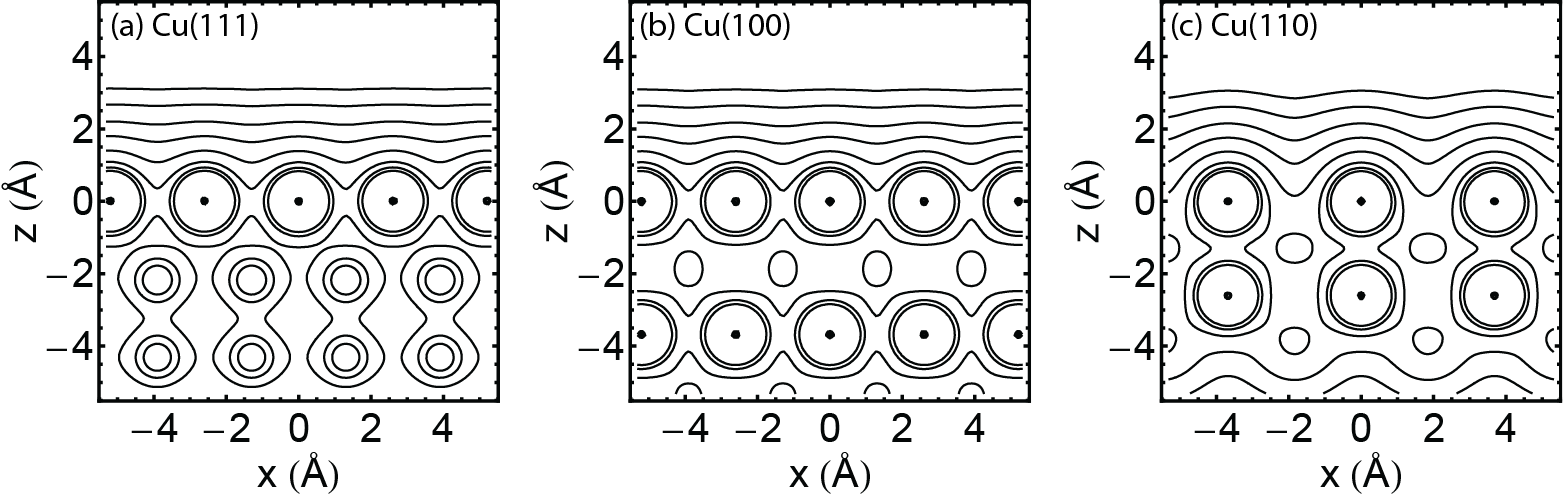
Figure 1 shows the electron density profiles calculated for the Cu(111), (100), and (110) surfaces with the method described below. They illustrate that the corrugations on these facets are small but differ, growing in order (111) (100) (110). For the scattering experiment, the density far out in the tails is particularly important.
That He-atom diffraction from dense metal surfaces is weak (compared to for instance ionic crystals) was early observed Boato and subsequently explained in terms of a simple tie between the scattering potential and the electron-density profile: The He-surface interaction energy can reasonably well be expressed as Esbjerg
| (4) |
where is the energy change on embedding a free He atom in a homogeneous electron gas of density , and is the host electron density at point . On close-packed metal surfaces the electron distribution is smeared out almost uniformly along the surface Smoluchowski1941 , thus giving weak corrugation. The crude proposal (4) might be viewed as the precursor to the effective-medium theory EMT .
The form (4) provides an interpretation of the mechanism by which the increasing density corrugation for (111) (100) (110) causes increasing amplitudes of modulation in the physisorption potentials. The min-to-max variation of the rotationally averaged, lateral periodic corrugation is modeled with an amplitude function HarrisAndLiebsch1982b , like in Eq. (2), . Here the exponent is related to the exponent of via . The strength prefactor is adjusted so that the calculated intensities of the first-order diffraction beams agree with measured values.
The simple message of the experimental characterization in Figure 2(a) is that, at the optimal separation and out, the corrugation terms are rather weak compared to the averages. This observation confirms that the basic particle-surface interaction is predominantly one dimensional.

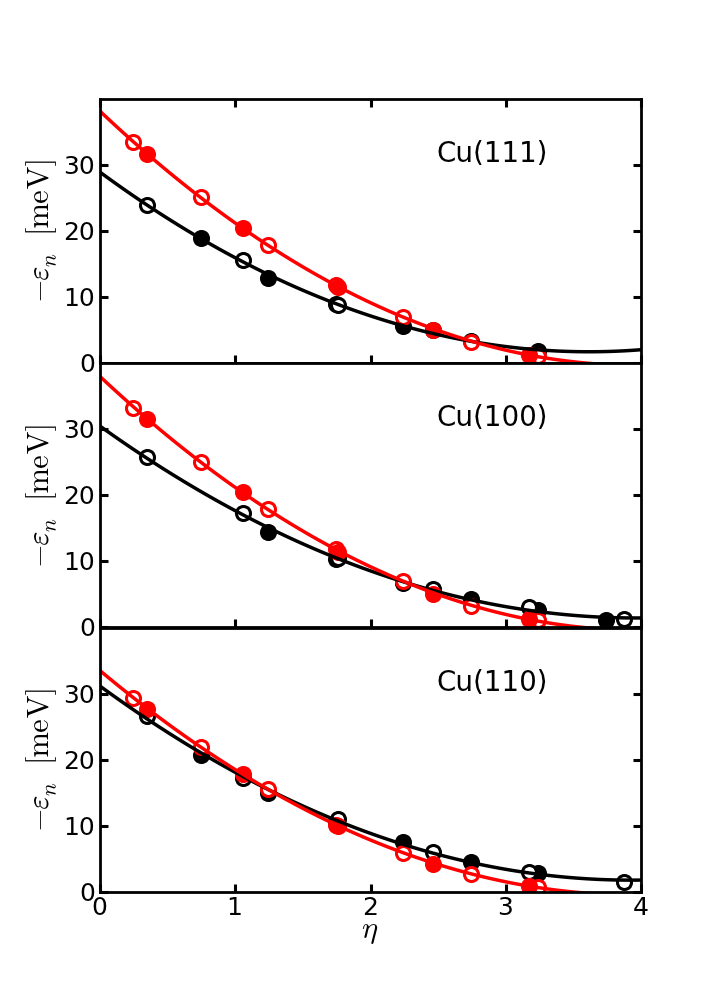
Figure 2(a) shows experiment-based PECs for physisorption of H2 on the Cu(111), Cu(100), and Cu(110) surfaces. The H2 molecules are trapped in states that are quantized in the perpendicular direction but have an essentially free in-surface dynamics. The panel details the laterally (and rotationally) averaged potential that reflects the perpendicular quantization, i.e., the physisorption levels . The experiment-based forms of [Fig. 2(a)] are obtained by adjusting the parameters111The procedure takes off from the Le Roy analysis Roy ; andersson1993 that gives an approximate determination of (a complete direct specification of would require measurements of even more shallow quantized physisorption levels) and of the depth of the physisorption well perandersson1993 . It also takes off from an approximate Zaremba-Kohn type zaremba1977 ; HarrisNordlander specification of the repulsive wall. The location of the jellium edge jelliumedge (relative to the position of the last atomic plane) is set at 1.97 , at 1.71 , and at 1.21 for the Cu(111), Cu(100) and for Cu(110) surfaces. The remaining set of parameters are split into two groups, those that are constrained to be identical for all facets and those that are assumed to be facet specific. Fitting against the set of measured quantization levels yields values meV, , and for parameters in the first group, as well as the facet specific determinations, meV, meV, and meV for Cu(111), Cu(100), and Cu(110), respectively. in the modeling framework andersson1993 ; perandersson1993 ; persson2008 , Eqs. (1)-(3), to accurately reproduce the set of values. The experiment-based PECs of Figure 2(a) are characterized by minima position (separations from the last atom plane), and depths given as follows: 3.52 Å and 29.0 meV for Cu(111), 3.26 Å and 31.3 meV for Cu(100), 2.97 Å and 32.1 meV for Cu(110). In Figure 2(a), however, the curves are shown with minima positions slightly translated so that the set of curves coincide at the classical turning point and thus facilitate an easy comparison.
The diffraction analysis of resonant back-scattering follows the reasoning: For light adsorbates, like He and H2, in gas-surface-scattering experiments, the elastic backscattering has a resonance structure. This provides a direct and elegant method to characterize the PEC, as they give accurate and detailed measurements of bound-level energies in the potential well. Isotopes with widely different masses, like 3He, 4He, H2, D2, permit a unique assignment of the levels and a determination of the well depth and ultimately a qualified test of model potentials Roy .
For a resonance associated with a diffraction that involves a surface reciprocal lattice vector there is a kinematical condition,
| (5) |
where is the particle mass and where and are the energy and wavevector component parallel to the surface of the incident beam, respectively. At resonance, weak periodic lateral corrugations of the basic interaction induce large changes in the diffracted beam intensities. The narrow resonance is observed as features in the diffracted beam intensities upon variations in the experimental incidence conditions. The intrinsically sharp resonances in angular and energy space have line widths that depend on intermediate bound-state life-time. They are limited by elastic and phonon inelastic processes. Lifetime broadening is only a fraction of a meV, substantially smaller than separations between the lower-lying levels (a few meV), allowing a number of physisorption levels with a unique assignment to be sharply determined from Eq. (5).
H2 is the only molecule for which a detailed mapping of the bound-level spectrum and the gas-surface interaction potential has been performed with resonance scattering measurements PerrauAndLapujoulade1982 ; YuEtAl1985 ; ChiesaEtAl1985 ; HartenEtAl1986 ; AnderssonEtAl1988 ; andersson1993 ; perandersson1993 ; persson2008 . The sequences here were obtained using nozzle beams of para-H2 and normal-D2, that is, the beams are predominantly composed of molecules. Two isotopes H2 and D2 of widely different masses and with the different rotational populations of para-H2 (p-H2) and ortho-D2 (o-D2) and the normal species (n-H2, n-D2) are thus available; this richness in data means that the data analysis is greatly simplified and the interpretation is clear. For instance, the rotational anisotropy of the interaction has been determined via analysis of resonance structure resulting from the rotational sub-level splittings observed for n-H2 and p-H2 beams ChiesaEtAl1985 ; WilzenEtAl1991 . Such knowledge permits a firm conclusion that the here-discussed measured bound-state energies, (Fig. 3), refer to an isotropic distribution of the molecular orientation. The level assignment is compatible with a single gas-surface potential for the two hydrogen isotopes perandersson1993 .
Figure 3 illustrates the analysis that leads to a single accurate gas-surface potential curve for each of the facets from the experimentally observed energies andersson1993 ; perandersson1993 ; persson2008 . The black open and filled circles represent measured values. The procedure is an adaptation to surface physics of the Rydberg-Klein-Rees method of molecular physics Roy . The ordering is experimentally known and in this ordering, all values fall accurately on a common curve [when plotted versus the mass-reduced level number ]. The variation in the quantization levels reflects the asymptotic behavior of the potential curve and thus determines the value of to a high accuracy and gives a good direct estimate of the well depth perandersson1993 ; persson2008 . A third-order polynomial fit to the data yields for a potential-well depth , 31.4, and 32.3 meV for the (111), (100), and (110) surfaces, respectively. This direct construction of an effective physisorption potential supplements the above-described experiment-based procedure [that instead uses the measured energies to fit curves and obtain an even higher accuracy222We have tested the accuracy and consistency among the two experimental determinations of the effective physisorption potential for Cu(111). Specifically, we constructed an alternative form in which we directly inserted the Rydberg-Klein-Rees/Le Roy value of and used the directly extracted well depth 31.4 meV perandersson1993 to specify an effective value of . We found that the lowest 4 physisorption eigenvalues of this potential then coincided within 3 percent of the measured energies. In contrast, the experiment-based potentials described in Ref. andersson1993 above and in potentials Fig. 2(a) reproduce the full set of measured energies (for all facets) to within 0.3 meV.].
Figure 2(a) also shows experiment-based determinations of the (rotationally averaged) amplitudes of the lateral corrugation. The measured intensities of the first-order diffraction beams provide (as described above) an estimate of the resulting lateral variation in the H2-Cu potential. The corrugation is very small, 0.5 meV at the potential well minimum. However, the existence of finite amplitudes is essential: The larger corrugation closer to the substrate contributes most importantly to the diffraction and resonance phenomena. In fact, it is a finite magnitude of that ensures a coupling to the in-plane crystal momentum and allows an elastic scattering event to satisfy the kinematical condition (5).
III van der Waals Accounts Used in DFT calculations
Noncovalent forces, such as hydrogen bonding and vdW interactions, are crucial for the formation, stability, and function of molecules and materials. In sparse matter the vdW forces are particularly relevant in regions with low electron density. For a long time, it has been possible to account for vdW interactions only by high-level quantum-chemical wave-function or Quantum Monte Carlo methods. The correct long-range interaction tail for separated molecules is absent from all popular local-density or gradient corrected XC functionals of density-functional theory, as well as from the Hartree-Fock approximation. Development of approximate DFT approaches that accurately model the London dispersion interactions Stone1997 ; Kaplan2006 is a very active field of research (reviewed in, for example Refs. GrimmeASM2007, ; GrafensteinCremer2009, ; JohnsonMD2009, ; SatoNakai2009, ; langreth2009, ).
To account for vdW interactions in computational physics traditional DFT codes are natural starting points. The vdW energy emanates from the correlated motion of electrons and there are proposals to account for it, like (i) DFT extended atom-pair potentials, (ii) explicit density functionals, and (iii) RPA in perturbation theory. Chemical accuracy is aimed for. Extensive physical and chemical systems are of great interest, including bio- and nanosystems, where the vdW interactions are indispensable. Describing bonds in a variety of systems with “chemical accuracy” requires that both strong and weak bonds are calculated. Strong covalent bonds are well described by traditional approximations, like the generalized gradient approximations (GGAs) PBE ; LangrMehl ; PerdewEtAl , which are typically built in into approaches (i) and (ii). vdW-relevant systems range from small organic molecules to large and complex systems, like sparse materials and protein-DNA complexes. They all have noncovalent bonds of significance. Quite a number of naturally and technologically relevant materials have already been successfully treated langreth2009 .
The methods (i) and (ii) are essentially cost free, speed is given by that of traditional DFT (for example GGA based). Such DFT calculations are competitive in terms of efficiency and broad applicability. Computational power is an important factor that is still relevant and an argument for choosing methods of types (i) and (ii) in many applications ahead of type (iii).
III.1 DFT extended by atom-pair potentials
A common remedy for the missing vdW interaction in GGA-based DFT consists of adding a pairwise interatomic term () to the DFT energy. Examples are DFT-D Grimme2004 , TS-vdW TS , and alike ElstnerHFSK2001 ; JureckaCHS2007 . Refs. SunKLZ2008 ; ZhaoTruhlar2008 describe various other approaches also currently in use.
The DFT-D method is a popular way to add on dispersion corrections to traditional Kohn-Sham (KS) density functional theory. It is implemented into several code packages. Successively it has been refined to obtain higher accuracy, a broader range of applicability, and less empiricism. In the recent DFT-D3 version Grimme , the main new ingredients are atom-pairwise specific dispersion coefficients and cutoff radii that are both computed from first principles. The coefficients for new eighth-order dispersion terms are computed using established recursion relations. Geometry-dependent information is here included by employing the new concept of fractional coordination numbers. They are used to interpolate between dispersion coefficients of atoms in different chemical environments. The method only requires adjustment of two global parameters for each density functional, is asymptotically exact for a gas of weakly interacting neutral atoms, and easily allows the computation of atomic forces. As recommended Grimme , three-body nonadditivity terms are not considered.
Another almost parameter-free333Both DFT-D and TS-vdW have a need to fix a cross-over function that is designed to minimize double counting of the semilocal correlation in regular DFT and the vdW contribution. The parameter of this cross over is often fitted to a reference system, for example S22. method for accounting for long-range vdW interactions from mean-field electronic structure calculations relies on the summation of interatomic terms, derived from the electron density of a molecule or solid and reference data for the free atoms TS . The mean absolute error in the coefficients is 5.5%, when compared to accurate experimental values for 1225 intermolecular pairs, irrespective of the employed exchange-correlation functional. The effective atomic coefficients have been shown to depend strongly on the bonding environment of an atom in a molecule TS .
III.2 Explicit density functionals
Ground-state properties can be described by functionals of the electron density Kohn . The functional for the XC energy is a central ingredient. The local-density approximation (LDA) KohnSham ; HedinLu and GGAs LangrMehl ; PerdewEtAl ; PBE do not describe the nonlocal correlations behind the vdW interactions. This subsection discusses explicit XC density functionals , focusing on the non-local correlation functional, .
In the vdW-DF, the vdW interactions and correlations are expressed in terms of the density as a truly nonlocal six-dimensional integral dion2004 ; langreth2005 ; thonhauser2007 . It originates in the adiabatic connection formula PerdLangrI ; GunnLund ; PerdLangrII , and uses an approximate coupling-constant integration and an approximate dielectric function with a single-pole form. The dielectric function is fully nonlocal and satisfies known limits, sum rules, and invariances, has a pole strength determined by a sum rule and is scaled to locally give the approximate gradient-corrected electron-gas ground-state energy. There are no empirical or fitted parameters, just references to general theoretical criteria.
Account for inhomogeneity is approximately achieved by a gradient correction, which is obtained from a relevant reference system. In the original vdW-DF version dion2004 ; thonhauser2007 ; rydberg2000 ; langreth2005 , the slowly varying electron gas is used for this. The gradient correction is then taken from Ref. LV1990, . Although promising results have been obtained for a variety of systems, including adsorption langreth2009 ; Mats , there is room for improvements. Recently another reference system has been proposed, with the argument that adsorption systems have electrons in separate molecule-like regions, with exponentially decaying tails in between. The vdW-DF2 functional uses the gradient coefficient of the B88 exchange functional B88 for the determination of the internal functional [Eq. (12) of Ref. dion2004, ] within the nonlocal correlation functional. This is based on application of the large- asymptote Schwinger1980 ; Schwinger1981 on appropriate molecular systems. Using this method, Elliott and Burke Elliott2009 have shown, from first principles, that the correct exchange gradient coefficient for an isolated atom (monomer) is essentially identical to the B88 value, which had been previously determined empirically B88 . Thus in the internal functional, vdW-DF2 LeeEtAl10 replaces in that equation with the value implied by the of B88. This procedure defines the relationship between the kernels of vdW-DF and vdW-DF2 for the nonlocal correlation energy. Like vdW-DF, vdW-DF2 is a transferable functional based on physical principles and approximations. It has no empirical input.
The choices of exchange functional also differ. The original vdW-DF uses the revPBE revPBE exchange functional, which is good at separations in typical vdW complexes dion2004 ; langreth2005 ; thonhauser2007 . At smaller separations puzder2006 ; kannemann-becke2009 ; murray2009 ; klimes2010 ; cooper2010 , recent studies suggest that the PW86 exchange functional PW86 most closely duplicates Hartree-Fock interaction energies both for atoms kannemann-becke2009 and molecules murray2009 . The vdW-DF2 functional LeeEtAl10 employs the PW86R functional murray2009 , which more closely reproduces the PW86 integral form at lower densities than those considered by the original PW86 authors.
III.3 RPA
For first-principles electron-structure calculations, the random-phase approximation (RPA) to the correlation energy is presumably a suitable complement to the exact exchange energy HarlKresse2009 . The RPA to the correlation energy NozieresPines1958 incorporates a screened nonlocal exchange term and long-range dynamic correlation effects that underpin vdW bonding HarlKresse2009 .
Hubbard, Pines and Nozieres pinesbook pointed out that RPA does have, at least, formal limitations in the description of local correlations (large momentum transfer). This is because RPA treats same- and opposite-spin scattering on the same footing, thereby neglecting effects of Pauli exclusion in the description of the RPA correlation term. There exist several suggestions for RPA corrections mahan . A recent study Ren2011 suggests a single-excitation extension for RPA calculations in inhomogeneous systems, thus lowering the mean average error for noncovalent systems Ren2011 .
Efficient RPA implementations have become increasingly available for solids MiyakeGR2002 ; HarlKresse2009 ; MariniGR2006 and molecular systems ScuseraHS ; Furche2001 ; Furche2008 ; RenRS2009 . One implementation HarlKresse2009 gives the XC functional as
| (6) |
where the exact exchange energy (Hartree-Fock energy) and the correlation energy , given as the independent-particle response function, are all evaluated from KS orbitals by using for example plane-wave code and suitably optimized projector augmented wave (PAW) potentials that describe high energy scattering properties very accurately up to 100 eV above the vacuum level ShishkinKresse2006 . The operations scale like and a high parallel efficiency can be reached HarlKresse2009 .
III.4 Implementation aspects
The vdW-DF2 calculations are performed by using the abinit abinit1 ; abinit2 code with a plane-wave basis set and Troullier-Martins-type Troullier1992 norm-conserving pseudopotentials. The scalar-relativistic correction is included in the pseudopotentials for transition-metals. A kinetic energy cut-off of 70 Ry is used. For k-space integrations, a Monkhorst-Pack mesh is used. For the partial occupation of metallic bands, we use the Fermi-Dirac smearing scheme with a 0.1 eV broadening width. With this setup the adsorption energies are converged within 1 meV. The vdW-DF total energy is calculated in a fully self-consistent way thonhauser2007 . We adapted an implementation of the efficient vdW-DF algorithm soler from siesta siesta for use within a modified version of abinit.

The surfaces are modeled by a slab of four atomic layers with a vacuum region of 20 Å in a periodic supercell. For the calculations on the (111), (100), and (110) surfaces we use the surface unit cells of , , and , respectively.
In the electron-structure calculations, the molecule is kept in a flat orientation above the high-symmetry positions or sites444In the description of the DFT calculations we refer to these positions as “sites” but note that there is a large zero-point motion perpendicular to the surface and that the experimentally relevant molecules move with a large in-surface kinetic energy while trapped in the physisorption well. on the Cu surfaces, as indicated in Figure 4. Some test points indicate that the total energy depends very little on orientation. For instance, in a “worst-case” situation, the energy change by a 90-degree in-plane rotation of H2 at the long bridge site of Cu(110) is 0.92 meV, in a fixed-height in-plane rotation. If H2 is moved to the equilibrium adsorption height, which is 0.04 Å lower, the energy difference increases to 0.97 meV. This variation is much smaller than the lateral corrugation ( meV in this facet) and out-of-plane rotation ( meV).
To estimate the magnitude of the error introduced by neglecting the angular average (that automatically is included in the experimental data) we perform a separate calculation of H2 in an up-right position on the Cu(111) surface using the optimal H2-to-surface separation. This calculation results in a downward energy shift of 4.8 meV, which is the amplitude of the angular variation at the optimal separation. However, for an isotropic H2 wave function this shift corresponds roughly to lowering of the ground state energy by merely meV = 1.6 meV, assuming a simple sinusoidal energy variation in the angular space. The energy of higher order states would also be lowered, but to a lesser extent. This estimate thus indicates that the effect of the angular energy dependence is merely a minor quantitative correction to the eigenvalues.
The PECs are calculated with vdW-DF2 for the high-symmetry sites, and from these the laterally averaged potential is approximately obtained. In turn, the bound quantum states in the potential well are calculated by solving the corresponding Schrödinger equation.
The theoretical values are generated for a number of discrete points, surface positions (atop, hollow, long bridge, and short bridge), and separations , while experimental data (Fig. 2) are presented as lateral averages and functions of separation . To connect the two, some approximation has to be made to extract the laterally averaged result out of the discrete one.
To capture the effects of the surface topology and to use the surface-lattice points used in the DFT calculations, we find the following approximate average reasonable:
| (7) |
where for the (100) and (111) surfaces. One argument in favor of this approximation is the fact that the (100) surface has twice as many bridge sites as there are atop sites. Approximation (7) is used in our comparisons between our vdW-DF2-determined potential and the experimentally determined one (Fig. 2) and in our generation of eigenvalues used to relate to the experimental ones [which are defined in terms of a laterally averaged and H2 rotational-angle averaged potential ] (Fig. 3). Reference h2cu, uses the atop PEC on Cu(111), which is an adequate choice due to the small corrugation of the Cu(111) surface.
For the discussion of the relation between corrugation and , the classical turning point is the relevant separation. The corrugation of the PEC minimum is smaller, but still representative of the expected variation in the probability for the H2 trapping.
The original report of experimental results also covers a potential . It represents the min-to-max variation of the lateral average of the rotational anisotropy. A full appreciation of the accuracy of the comparison between the experimentally determined and , based on existing vdW-DF2 calculations, would benefit from an understanding of . To indicate that this is unlikely to have any large consequence for the three Cu surfaces, a simple estimate of the rotation angle effect is made above. This should be considered as a stimulus for further refinement of the testing.
IV Results and Benchmarking
We present a new benchmark, taken from surface physics, with extraordinary virtues. Data are provided for (i) energy eigenvalues, , for H2 and D2 in the PEC well, which have direct ties to measured reflection intensity, (ii) the laterally averaged physisorption potential, , which is derived from measured data, the extracted PEC, and (iii) the corrugation, , also derived from measured data.
IV.1 Benchmarking strategies
Evaluation of XC functionals is often made by comparing with other theoretical results in a systematic way, for instance, the common comparison with S22 data set Jurecka2006 ; Sherrill2009 ; Molnar2009 ; Takatani2010 ; Szalewicz2010 . These sets have twenty-two prototypical small molecular duplexes for non-covalent interactions (hydrogen-bonded, dispersion-dominated, and mixed) in biological molecules. They provide PECs at a very accurate level of wave-function methods, in particular the CCSD(T) method. However, by necessity, the electron systems in such sets are finite in size. The original vdW-DF performs well on the S22 data set, except for hydrogen-bonded duplexes (underbinding by about 15% langreth2009 ; LeeEtAl10 ). Use of the vdW-DF2 functional reduces the mean absolute deviations of binding energy and equilibrium separation significantly LeeEtAl10 . Shapes of PECs away from the equilibrium separation are greatly improved. The long-range part of the vdW interaction, particularly crucial for extended systems, has a weaker attraction in the vdW-DF2, thus reducing the error to 8 meV at separations 1 Å away from equilibrium LeeEtAl10 .
Recently, other numbers for the S22 benchmark on vdW-DF2 have been published bligard . The two calculations differ in the treatment of the intermolecular separation, being relaxed LeeEtAl10 and unrelaxed bligard , respectively. Of course, absence of relaxations does lead to an appearance of worse performance.
Experimental information provides the ultimate basis for assessing functionals. The vdW-DF functional has been promising in applications to a variety of systems langreth2009 , but primarily vdW-bonded ones. Typically, the calculated results are tested on measured binding-energy and/or bond-length values that happen to be available. The vdW-DF2 functional has also been successfully applied to some extended systems, like graphene and graphite LeeEtAl10 , metal-organic-frameworks systems LeeEtAl10B , molecular crystal systems MolcrysDF2 , physisorption systems LeeEtAl10C ; selfassembly , liquid water mogelhoj and layered oxides londero . However, the studies are of the common kind that focus on comparison against just a few accessible observations.
Accurate experimental values for the eigenenergies of H2 and D2 molecules bound to Cu surfaces andersson1993 ; perandersson1993 motivate theoretical account and assessment. This knowledge base covers results for the whole shape of the physisorption potentials. Here calculations on several Cu facets allow studies of trends and a deeper analysis. The extensive report of vdW-DF2 results in Figure 5 serves as a starting point.
IV.2 PECs from vdW-DF2

PECs are calculated for H2 in atop, bridge, and hollow sites on the Cu(111), (100), and (110) surfaces. The resulting benchmark for vdW-DF2 is also compared (below) with those of two other vdW approximations, the DFT-D3 Grimme and TS-vdW TS methods.
To emphasize various aspects of the PECs and make valuable use of the numerical accuracy, the next few sections (and figures) highlight various aspects of the vdW-DF2 results. For each position of the molecular center of mass, we compare the averaged potential functions and , in Fig. 2, and find strong qualitative agreement. For instance, at the potential minimum of , Figure 2 gives for the approximate values 1, 3, and 4 meV for (111), (100), and (110), respectively, in quantitative agreement with the illustration of theoretical results analysis. The insensitivity to facets and the corrugation is discussed in greater detail below.
IV.3 Isotropy of lateral averaged potentials
An important feature of the experimental in Figure 2 is the similar sizes of the well depths (range 29–32 meV) and separations (around 3.5 Å) on the (111), (100), and (110) surfaces. This isotropy, i.e., similarity of physisorption potential among different facets, is interesting and perhaps surprising because Cu(111) contains a metallic surface state, whereas Cu(100) and Cu(110) do not.
The most striking feature of the vdW-DF2 results for the H2-Cu PEC is probably that it is able to reproduce this isotropy. From Figure 5 we find physisorption depths in the interval 35–39 meV and separations in the range 3.3–3.6 Å. From the experimentally more relevant laterally averaged , Fig. 2(b), we find physisorption depths 31–36 meV.

The isotropy is emphasized in Figure 6 by plotting the vdW-DF2 PECs on the atop sites of each surface. The curves lie very close to each other, both in the Pauli-repulsion region at short separations, dominated by in the traditional theory [Eqs. (1)-(3)], and in the vdW-attraction region at large separations. They differ only discernibly in the -region, which can be understood in terms of the higher electron density, on the atop site on the dense (111) surface.
Both agreements and differences are found in the trends (with facets) of the experiment-based [, ] and vdW-DF2 based [] characterizations, Figure 2(a) and (b). vdW-DF2 reproduces the trend in ordering and roughly the magnitudes in the modulation amplitudes [] at the classical turning points (identified as position ‘0’ in Figure 2). As shown in Fig. 6, vdW-DF2 also reproduces the ordering of separations corresponding to physisorption minima, correctly decreasing as (111) (100) (110). On the other hand, for the physisorption depth varies as (111) (100) (110) whereas in the depth varies (110) (100) (111). The largest relative difference, 25%, is found for Cu(111). The set of physisorption depths on the three facets are reproduced with an average confidence of 15%.
IV.4 Corrugation
Another striking feature of the PECs is the variation with the density corrugation of each surface. In Figure 1, the density profiles of the clean Cu(111), (100), and (110) surfaces indicate how the corrugation may vary. For fcc metals the (111) surface is the most dense, while the (100) and (110) surfaces are successively more open and thus corrugated. The trend is reflected in the PECs. These clear effects on the PEC are illustrated by the calculated PECs for H2 in atop, bridge, and hollow sites on the Cu(111), (100), and (110) surfaces (Fig. 5). From being small on the flat and dense (111) surface [Fig. 5(a)], the corrugation grows from (111) to (100) and from (100) to (110), just as expected from the above reasoning.
Figure 7 shows the variations in the adsorption energies relative to the value of the atop configuration on the various facets. We choose to report the corrugation at the PEC minimum. The corrugation at the classical turning point is likely a stronger indicator of the strength of the elastic scattering that traps the incoming H2 molecules, Sec. II.


On all three facets, the calculated stable site is atop (Figs. 5 and 7). This result can be understood with a simple argument based on the traditional model and a tight-binding (TB) description of the electrons. Equations (1)–(3) separate the potential energy into repulsive and attractive parts, and , respectively. Close to the minimum point, the vdW attraction, (Eq. (3)) gets stronger in the direction towards the surface. The repulsion terms prevent the admolecule from benefiting from this by going even closer. Equation (4) reflects that higher density gives higher repulsion, and the density profiles in Figure 1 show the proper order. For a more general discussion, see Ref. Chen .
While the electron density (Fig. 1) is characterized by only one kind of corrugation, the corrugation of the PECs depends on where the probe hits the PEC. From Figure 5 we can envisage different corrugation values for different values. For the reflection-diffraction experiment one can argue that H2 molecules coming in to the surface with a positive kinetic energy, i.e., at or above the energy of the classical turning point, are particularly relevant.
IV.5 Corrugation and exchange functional
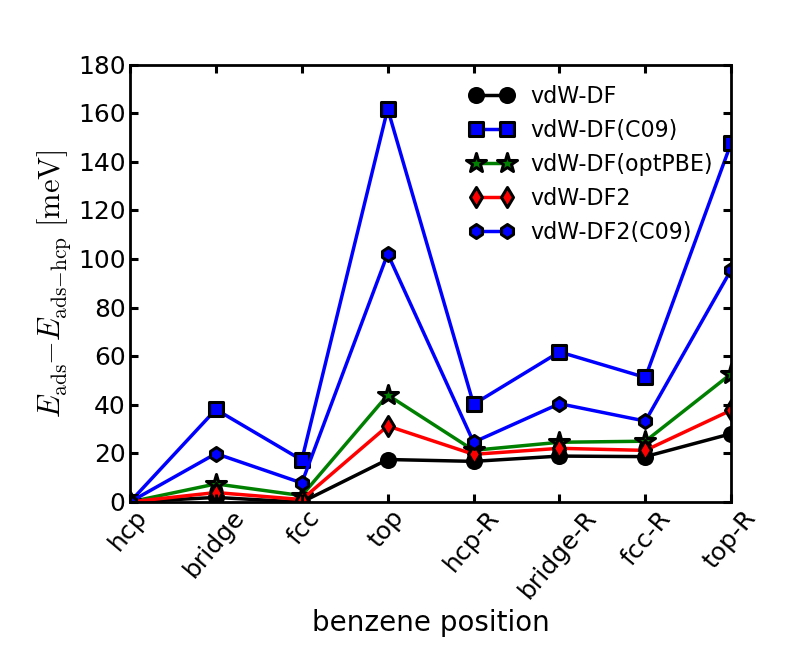
To clarify the underlying cause of corrugation, a different adsorption system is first studied. Benzene on the Cu(111) surface is known to be a true vdW system slidingrings . Interaction-energy values for the benzene molecule at various positions on the Cu(111) are calculated with five different density functionals, all accounting for vdW forces, and shown in Figure 8. The functionals differ by the differing strengths of vdW attraction in vdW-DF and vdW-DF2, but in particular by different exchange approximations, revPBE dion2004 ; revPBE , C09 cooper2010 , optPBE klimes2010 , and PW86R PW86 ; murray2009 ; LeeEtAl10 . While the binding-energy value is not so sensitive to choice of functional, corrugation-energies values are.
Therefore, the accurate results of a reflection-diffraction experiment are valuable in several respects. On one hand, they support that the traditional model is right in its separation in Eqs. (1)-(3) and there attaching the repulsive wall, , to Pauli repulsion persson2008 and thus to exchange. On another hand, they are able to discriminate between different approximations for the exchange functional. Similar results have also been calculated for benzene on graphene berland12 .
IV.6 Comparison with experiment-related quantities

Comparison of the calculated results on the H2-Cu systems with the model used for the analysis of the experimental data andersson1993 ; perandersson1993 is next done for the laterally averaged potential , the potential derived from experiment. The experiment-derived results in Figure 2 are redrawn in Figure 9 as the experimental physisorption potential for H2 on Cu(111). Figure 9(a) shows our comparison of PECs calculated using vdW-DF and vdW-DF2, respectively, drawn against the experimental physisorption potential for H2, originally published in Ref. h2cu, . The Cu(111) surface is chosen for its flatness that gives clarity in the analysis and eliminates several side-issues that could have made interpretations fuzzier. Several qualitative similarities are found for both vdW-DF and vdW-DF2 functionals. The vdW-DF2 functional gives PECs in a useful qualitative and quantitative agreement with the experimental physisorption curve, for instance with respect to well depth, equilibrium separation, and curvature of PEC near the well bottom, and thus zero-point vibration frequency. Comparisons of full PECs are also parts of the benchmarking.
IV.7 Other methods
Well depths and equilibrium separations for H2 on Cu(111) are seen as PEC minimum points in Figure 9(a). As the corrugation is so small, it should suffice to use only the atop result. More precise value pairs h2cu are ( meV; 3.5 Å) for extracted from experiment andersson1993 , ( meV; 3.8 Å) as calculated with the vdW-DF functional, ( meV; 3.6 Å) with the vdW-DF2 functional, ( meV; 2.8 Å) with the DFT-D3(PBE) method Grimme , and ( meV; 3.2 Å) with the TS-vdW method TS . The striking discrepancy between the three major types of accounts for vdW in extended media is discussed below.
As reported for example in Ref. h2cu, , the LDA and GGA functionals do not describe the nonlocal correlation effects that give vdW forces. They also misrepresent the PECs. The minima are too shallow and the equilibrium separations are too large rydberg2000 .
In Figure 9, the DFT-D3(PBE) curves are the results of calculations with the DFT-D3 corrections Grimme added on top of the PBE PECs. Figure 9(b) compares a DFT-D3 PEC at the hollow site of the (111) surface with that of an atop site [same as the one in Fig. 9(a)] h2cu . The energy difference between atop and hollow adsorption-energy values is found to be 11 meV. If this corrugation at were a measure of the corrugation, the corrugation by DFT-D3 on Cu(111) would be 11 meV, or 11 times larger than that given by vdW-DF2 (1 meV).
IV.8 Energy levels
The quantum-mechanical motion of the H2 molecule in the various (laterally averaged) potentials (Fig. 2) can be calculated and for the motion perpendicular to the surface be described by, e.g., the bound-state eigenenergy values. Figure 3 presents and compares results from experiment and theory. The experimental curve, identified by filled (H2) and empty (D2) black circles may be analyzed andersson1993 ; perandersson1993 ; persson2008 within the traditional theoretical picture zaremba1977 ; HarrisNordlander of the interaction between inert adsorbates and metal surfaces, Section II. The experimental level sequence in Figure 3 can be accurately reproduced ( meV) by such a physisorption potential perandersson1993 ; persson2008 (Fig. 2), having a well depth of 28.9 meV and a potential minimum located 3.5 Å outside the topmost layer of copper ion cores. From the measured intensities of the first-order diffraction beams, a very small lateral variation of the H2-Cu(111) potential can be deduced, meV at the potential-well minimum.
The vdW-DF2 theory results for the levels are identified by filled (H2) and empty (D2) red circles. The theoretical results are constructed from the calculated vdW-DF2 PECs in Figure 5 by first providing an estimate for the laterally averaged potential for each facet, according to Eq. (7).
We note that unlike the experimental results [which define ], the variation in does not reflect an average over the angles of the H2. We also note that this is a small effect, Section III.4.
Figure 3 documents good agreement in results from vdW-DF2 and experiment for the energy levels on each of the Cu facets. The eigenvalues have the same order as in the experimental results (Fig. 3), indicating good agreement between the calculated and measured average potentials.
There are some discrepancies between the eigenvalues for H2. This signals that the vdW-DF2 functional might not give the right shape for the PEC of H2 on Cu(111). The vdW-DF2 PEC is judged to lie close to the experimental physisorption potential, both at the equilibrium position and at separations further away from the surface, and is thus described as “promising” h2cu . The same applies for H2 on Cu(100) and Cu(110).
IV.9 Summary
Having access to the full PEC, including shape of potential and asymptotic behavior, allows a more stringent assessment of the theoretical results. This is in addition to the many other conclusions that Figure 9 gives.
PECs from vdW-DF2: The picture for H2 on Cu(111) of Ref. h2cu, at large applies also to the Cu(100) and (110) surfaces. Going from the most dense surface, Cu(111), to the more open surfaces, the changes are small. The vdW-DF2 description is good to 25% in calculating the potential depth in the worst case, Cu(111). vdW-DF2 describes the mean physisorption well depths (averaged over all three facets) to within 15% of the experiments.
Lateral average: Approximate lateral averages of the PECs, , have a fair agreement with those derived from experiment (Fig. 2).
Corrugation: On each surface, the PECs vary (Figs. 5–8) with the density corrugation (Fig. 1). For fcc metals the (111) surface is most dense, and (100) and (110) are successively more open and corrugated. For the calculated PECs for H2 in atop, bridge, and hollow sites on the Cu, trends and magnitudes of agree with experimental findings (Figs. 2 and 7).
Corrugation and exchange functional: By the example of the benzene molecule on the Cu(111) surface, calculations with several different density functionals that account for vdW forces show that corrugation-energies values are sensitive to functionals that differ by different exchange approximations. Therefore, the accurate results of a reflection-diffraction experiment are valuable for discriminating between exchange functionals (Fig. 8). The vdW-DF2 functional uses a good exchange approximation.
Comparison with experiment-related quantities: The experiment-derived results are shown in Figures 2 and 9 as the experimental physisorption potential for H2 on Cu(111). Comparison of PECs calculated with vdW-DF and vdW-DF2 show that the vdW-DF2 functional gives PECs in a useful qualitative and quantitative agreement with the experimental physisorption curve.
Other functionals: PECs calculated with several different methods for H2 on Cu(111) in atop and hollow positions show a striking discrepancy between the results from the DFT-D3 Grimme and TS-vdW TS methods on the one hand, and those of vdW-DF2 and experiment on the other hand. This discrepancy is traced back to the fact that pair potentials center the interactions on the nuclei and do not fully reflect that important binding contributions arise in the wave function tails outside the surface.
Energy levels: The energy levels in the H2-Cu PEC wells (Fig. 3) are calculated for all facets and compared with the experimental ones (Fig. 3). Agreement with experimental results is gratifying.
We judge the performance of vdW-DF2 as very promising. In making this assessment we observe that (i) vdW-DF2 is a first-principles method, where characteristic electron energies are typically in the eV range, and (ii) the test system and results are very demanding. The second point is made evident by the fact that other popular methods deviate significantly more from the experimental curve. For instance, application of the DFT-D3(PBE) method Grimme (with atom-pairwise specific dispersion coefficients and cutoff radii computed from first principles) gives ( meV; 2.8 Å) for the PEC minimum point. The good agreement of the minima of the vdW-DF2 and experimental curves are encouraging, and so is the relative closeness of experimental and calculated eigenenergy values in Figure 3. The discrepancies between the eigenvalues signal that the vdW-DF2 PEC might not express the exact shape of the physisorption potential for H2 on Cu(111).
V Comparisons and Analysis
Figures 9(a) and (b) show that the vdW-DF2 functional and DFT-D3 and TS-vdW methods give very different results. We could have made this point even stronger by showing also results for corrugation and energy values. However, we believe that comparisons of the PECs at atop and hollow sites on the Cu(111) surface suffice. No doubt, H2 on Cu is a demanding case for all methods. The local probe H2 on Cu avoids smearing-out effects, unlike for example graphene and PAHs, and incipient covalency, unlike H2O and CO, and is thus a pure vdW system and a lateral-sensitive one.
We trace the differing of the results with the vdW-DF2 and DFT-D3 methods to the differences in the descriptions of the vdW forces. The vdW-DF2 and similar functionals describe interactions between all electrons, while DFT-D3 and TS-vdW methods rely on atom-pair interactions. Even if large efforts are put into mimicking the real electron-charge distribution by electron-charge clouds around each atom nucleus, this has to be a misrepresentation of surface-induced redistributions of electronic charge in a general-geometry correction of a traditional DFT calculation. There is no mechanism for Zaremba-Kohn effects.
The Zaremba-Kohn formulation of physisorption is not build in explicitly into the vdW-DF2 functional. However, the interactions of the electrons are build in into the supporting formalism in the similar way as in the derivation of the Zaremba-Kohn formula.
VI Conclusions
Accurate and extensive experimental data are used to benchmark calculational schemes for sparse matter, that is, methods that account for vdW forces. Reflection-diffraction experiments on light particles on well-characterized surfaces provide accurate data banks of experimental physisorption information, which challenge any such scheme to produce relevant physisorption PECs. PECs of H2 on the Cu(111), (100), and (110) surfaces are here studied. Accuracy is high even by the surface-physics standards and is here provided thanks to diffraction kinematical conditions giving sharp resonances in diffraction beam intensities. We propose that such surface-related PEC benchmarking should find a broader usage.
The vdW-DF, vdW-DF2, DFT-D3, and TS-vdW schemes are used, and results are compared. The first two are expressions of the vdW-DF method, that is, nonempirical nonlocal functionals in which the electrodynamical couplings of the plasmon response produces fully distributed contributions to vdW interactions; Like in the Zaremba-Kohn picture zaremba1977 , they permit the extended conduction electrons to respond also in the density tails outside a surface. The latter two are examples of DFT extended with vdW pair potentials and represent the dispersive interaction through an effective response and pair potentials located on the nuclei positions. Several qualitative similarities are found between the vdW-DF and vdW-DF2 functionals. The vdW-DF2 functional gives PECs in a useful qualitative and quantitative agreement with the experimental PECs. This is looked at for well depths, equilibrium separations, and curvatures of PEC near the well bottom, and thus molecular zero-point vibration frequency. The DFT-D3 and TS-vdW schemes give PEC results that deviate significantly more from experimental PECs. The benchmark with the experimental H2/Cu scattering data is thus able to discriminate between the results of pair-potential-extended DFT methods and vdW-DF2. The differences suggest that it is important to reflect the actual, distributed location of the fluctuations (plasmons) that give rise to vdW forces.
The vdW-DF2 density functional benchmarks very well against the S22 data sets LeeEtAl10 . It is also the functional being more extensively compared between experiment and theory here. Certain very well-pronounced features, like isotropy of the H2-Cu PEC, the (111), (100), and (110) PECs being close to identical, and the clear trend in its corrugation that grows in order (111) (100) (110), are well described. The calculated results are found to be close to the experimental ones, thereby being almost decisive on exchange functionals. The energy levels for the quantum-mechanical motion in the H2-Cu PEC agree in a gratifying way.
The accuracy of this experiment is also shown to be valuable for discriminating between exchange functionals (Fig. 6). The vdW-DF2 functional is found to apply a good exchange approximation.
The vdW-DF2 is found promising for applications at short and intermediate distances, as is relevant for adsorption. However, the accuracy of experimental data is high enough to stimulate a more detailed analysis of all aspects of the theoretical description. This should be valuable for the further XC-functional development. For instance, some discrepancies are found for the eigenvalues. They signal that the vdW-DF2 PEC for H2 on Cu(111) might not have a perfect shape. Additional physical effects could be searched for. The metallic surface state on Cu(111) might be one source; It is possible that the metallic nature of the H2/Cu(111), H2/Cu(100), and H2/Cu(110) systems motivates modifications in the description of the electrodynamical response inside the nonlocal functional. For a well established conclusion, a more accurate theory is called for.
In any case, H2/Cu physisorption constitutes possibilities for benchmarking theory descriptions and represents a very strong challenge for the density functional development.
Acknowledgements.
The Swedish National Infrastructure for Computing (SNIC) at C3SE is acknowledged for providing computer allocation and the Swedish Research Council (VR) for providing support to KB, ES, and PH. Work by KL is supported by NSF DMR-0801343, MY is sponsored by the US Department of Energy, Basic Energy Sciences, Materials Sciences and Engineering Division.References
- (1) P. Hohenberg and W. Kohn, Phys. Rev. 136, B864 (1964).
- (2) W. Kohn and L.J. Sham, Phys. Rev. 140, A1133 (1965).
- (3) K. Lee, É.D. Murray, L. Kong, B.I. Lundqvist, and D.C. Langreth, Phys. Rev. B (RC) 82, 081101 (2010).
- (4) S. Grimme, J. Antony, S. Ehrlich, and H. Krieg, J. Chem. Phys. 132, 154104 (2010).
- (5) A. Tkatchenko and M. Scheffler, Phys. Rev. Lett. 102, 073005 (2009).
- (6) M. Dion, H. Rydberg, E. Schröder, D.C. Langreth, and B.I. Lundqvist, Phys. Rev. Lett. 92, 246401 (2004); 95, 109902(E) (2005).
- (7) J. Harl and G. Kresse, Phys. Rev. Lett. 103, 056401 (2009).
- (8) P. Jurečka, J. Šponer, J. Černý, and P. Hobza, Phys. Chem. Chem. Phys. 8, 1985 (2006).
- (9) T. Takatani, E.G. Hohenstein, M. Malagoli, M.S. Marshall, and C.D. Sherrill, J. Chem. Phys. 132, 144104 (2010).
- (10) S. D. Chakarova-Käck, E. Schröder, B. I. Lundqvist, and D. C. Langreth, Phys. Rev. Lett. 96, 146107 (2006).
- (11) S. Andersson and M. Persson, Phys. Rev. Lett. 70, 202 (1993).
- (12) S. Andersson and M. Persson, Phys. Rev. B 48, 5685 (1993).
- (13) See, e.g., M. Persson and S. Andersson, Chapter 4, “Physisorption Dynamics at Metal Surfaces”, in Handbook of Surface Science, Vol. 3 (Eds. E. Hasselbrink and B.I. Lundqvist), Elsevier, Amsterdam (2008), p. 95.
- (14) K. Lee, A.K. Kelkkanen, K. Berland, S. Andersson, D.C. Langreth, E. Schröder, B.I. Lundqvist, and P. Hyldgaard, Phys. Rev. B 84, 193408 (2011).
- (15) R.J. Le Roy, Surf. Sci. 59, 541 (1976).
- (16) K. Schönhammer and O. Gunnarsson, Phys. Rev. B 22, 1629 (1980).
- (17) W. Brenig, Physica Scripta 35, 329 (1987).
- (18) G. Boato, P. Cantini, and R. Tatarek, in Proceedings of the Seventh International Vacuum Congress and the Third International Conference on Solid Surfaces, Vienna, 1977, edited by R. Dobrozemsky et al. (F. Berger and Sohne, Vienna, 1977), p. 1377.
- (19) N. Garcia, J. Ibaniz, J. Solana, and N. Canbrera, Surf. Sci. 60, 385 (1976).
- (20) E. Zaremba and W. Kohn, Phys. Rev. B 15, 1769 (1977).
- (21) P. Nordlander and J. Harris, J. Phys. C 17, 1141 (1984).
- (22) N.D. Lang, Solid State Physics 28, 225 (1973).
- (23) E. Zaremba and W Kohn, Phys. Rev. B 13, 2270 (1976).
- (24) A. Liebsch, Europhys. Lett. 1, 361 (1986).
- (25) N. Esbjerg and J. K. Nørskov, Phys. Rev. Lett. 45, 807 (1980).
- (26) R. Smoluchowski, Phys. Rev. 60, 661 (1941).
- (27) K.W. Jacobsen, J.K. Nørskov, and M.J. Puska, Phys. Rev. B 35, 7423 (1987).
- (28) J. Perrau and J. Lapujoulade, Surf. Sci. 121, 341 (1982).
- (29) C.-F. Yu, K.B. Whaley, C. Hogg, and S. Sibener, J. Chem. Phys. 83, 4217 (1985).
- (30) M. Chiesa, L. Mattera, R. Musenich, and C. Salvo, Surf. Sci. 151, L145 (1985).
- (31) U. Harten, J.P. Toennies, and C. Wöll, J. Chem. Phys. 85, 2249 (1986).
- (32) S. Andersson, L. Wilzen, and M. Persson, Phys. Rev. B 38, 2967 (1988).
- (33) L. Wilzen, F. Althoff, S. Andersson, et al., Phys. Rev. B 43, 7003 (1991).
- (34) J. Harris and A. Liebsch, J. Phys. C - Solid State Physics 15, 2275 (1982).
- (35) A.J. Stone, The Theory of Intermolecular Forces, Oxford University Press, Oxford, 1997.
- (36) G. Kaplan, Intermolecular Interactions, Wiley, Chichester, 2006.
- (37) S. Grimme, J. Antony, T. Schwabe, and C. Mück-Lichtenfeld, Org. Biomol. Chem. 5, 741 (2007).
- (38) J. Gräfenstein and D. Cremer, J. Chem. Phys. 130, 124105 (2009).
- (39) E.R. Johnson, I.D. Mackie, and G.A. DiLabio, J. Phys. Org. Chem. 22, 1127 (2009).
- (40) T. Sato and H. Nakai, J. Chem. Phys. 131, 224104 (2009).
- (41) D.C. Langreth, B.I. Lundqvist, S.D. Chakarova-Käck, V.R. Cooper, M. Dion, P. Hyldgaard, A. Kelkkanen, J. Kleis, L. Kong, S. Li, P.G. Moses, E. Murray, A. Puzder, H. Rydberg, E. Schröder, and T. Thonhauser, J. Phys.: Cond. Mat. 21, 084203 (2009).
- (42) J.P. Perdew, K. Burke, and M. Ernzerhof, Phys. Rev. Lett. 77, 3865 (1996); 78, 1396(E) (1997).
- (43) D.C. Langreth and M.J. Mehl, Phys. Rev. Lett. 47, 446 (1981).
- (44) J. P. Perdew et al., Phys. Rev. Lett. 100, 136406 (2008).
- (45) S. Grimme, J. Comput. Chem. 25, 1463 (2004).
- (46) M. Elstner, P. Hobza, T. Frauenheim, S. Suhai, and E. Kaxiras, J. Chem. Phys. 114, 5149 (2001).
- (47) P. Jurečka, J. Černý, P. Hobza, and D.R. Salahub, J. Comput. Chem. 28, 555 (2007).
- (48) Y. Y. Sun, Y.-H. Kim, K. Lee, and S. B. Zhang, J. Chem. Phys. 129, 154102 (2008).
- (49) Y. Zhao and D.G. Truhlar, Acc. Chem. Res. 41, 157 (2008).
- (50) L. Hedin and B.I. Lundqvist, J. Physics Part C Solid State Physics 4, 2064 (1971).
- (51) T. Thonhauser, V.R. Cooper, S. Li, A. Puzder, P. Hyldgaard, and D.C. Langreth, Phys. Rev. B 76, 125112 (2007).
- (52) D.C. Langreth, M. Dion, H. Rydberg, E. Schröder, P. Hyldgaard, and B.I. Lundqvist, Int. J. Quant. Chem. 101, 599 (2005).
- (53) D.C. Langreth and J.P. Perdew, Solid State Commun. 17, 1425 (1975).
- (54) O. Gunnarsson and B.I. Lundqvist, Phys. Rev. B 13, 4274 (1976).
- (55) D.C. Langreth and J.P. Perdew, Phys. Rev. B 15, 2884 (1977).
- (56) H. Rydberg, B.I. Lundqvist, D.C. Langreth, and M. Dion, Phys. Rev. B 62, 6997 (2000).
- (57) D.C. Langreth and S.H. Vosko, in “Density Functional Theory of Many-Fermion Systems”, ed. S.B. Trickey, Academic Press, Orlando, 1990.
- (58) Y.N. Zhang, F. Hanke, V. Bortolani, M. Persson, and R. Q. Wu, Phys. Rev. Lett. 106, 236103 (2011).
- (59) A.D. Becke, Phys. Rev. A 38, 3098 (1988).
- (60) J. Schwinger, Phys. Rev. A 22, 1827 (1980).
- (61) J. Schwinger, Phys. Rev. A 24, 2353 (1981).
- (62) P. Elliott and K. Burke, Can. J. Chem. 87, 1485 (2009).
- (63) Y. Zhang and W. Yang, Phys. Rev. Lett. 80, 890 (1998).
- (64) A. Puzder, M. Dion, and D.C. Langreth, J. Chem. Phys. 126, 164105 (2006).
- (65) F.O. Kannemann and A.D. Becke, J. Chem. Theory Comput. 5, 719 (2009).
- (66) É.D. Murray, K. Lee, and D.C. Langreth, Jour. Chem. Theor. Comput. 5, 2754 (2009).
- (67) J. Klimeš, D.R. Bowler, and A. Michaelides, J. Phys.: Condens. Matter 22, 022201 (2010).
- (68) V.R. Cooper, Phys. Rev. B 81, 161104(R) (2010).
- (69) J.P. Perdew and Y. Wang, Phys. Rev. B 33, 8800(R) (1986).
- (70) P. Nozières and D. Pines, Phys. Rev. 111, 442 (1958).
- (71) D. Pines and P. Nozières, “The Theory of Quantum Liquids,” Vol 1 (Addison-Wesley Publ. Comp., inc. Redwood City, 1966), p. 327.
- (72) G.D. Mahan, “Many-particle Physics” (2nd ed.), Plenum Press, New York (1990), pp. 444–454.
- (73) X. Ren, A. Tkatchenko, P. Rinke, and M. Scheffler, Phys. Rev. Lett. 106, 153003 (2011).
- (74) T. Miyake et al., Phys. Rev. B 66, 245103 (2002).
- (75) A. Marini, P. García-González, and A. Rubio, Phys. Rev. Lett. 96, 136404 (2006).
- (76) G.E. Scuseria, T.M. Henderson, and D.C. Sorensen, J. Chem. Phys. 129, 231101 (2008).
- (77) F. Furche, Phys. Rev. B 64, 195120 (2001).
- (78) F. Furche, J. Chem. Phys. 129, 114105 (2008).
- (79) X. Ren, P. Rinke, and M. Scheffler, Phys. Rev. B 80, 045402 (2009).
- (80) M. Shishkin and G. Kresse, Phys. Rev. B 74, 035101 (2006).
- (81) X. Gonze et al., Zeit. Kristallogr. 220, 558 (2005).
- (82) X. Gonze et al., Computer Phys. Commun. 180, 2582 (2009).
- (83) N. Troullier and J. L. Martins, Phys. Rev. B 46, 1754 (1992).
- (84) G. Román-Pérez and J.M. Soler, Phys. Rev. Lett. 103, 096102 (2009).
- (85) P. Ordejón, E. Artacho, and J.M. Soler, Phys. Rev. 53, 10441(R) (1996); J.M. Soler, E. Artacho, J.D. Gale, A. García, J. Junquera, P. Ordejón, and D. Sánchez-Portal, J. Phys.: Condens. Matter 14, 2745 (2002).
- (86) D. Sherrill, T. Takatani, and E. G. Hohenstein, J. Phys. Chem. A 113, 10146 (2009).
- (87) L.F. Molnar, X. He, B. Wang, and K.M. Merz, J. Chem. Phys. 131, 065102 (2009).
- (88) R. Podeszwa, K. Patkowski, and K. Szalewicz, Phys. Chem. Chem. Phys. 12, 5974 (2010).
- (89) J. Wellendorff and T. Bligaard, Topics in Catalysis 54, 1143 (2011).
- (90) L.Z. Kong, G. Román-Pérez, J.M. Soler, and D.C. Langreth, Phys. Rev. Lett. 103, 096103 (2009).
- (91) K. Berland, Ø. Borck, and P. Hyldgaard, Comp. Phys. Commun. 182, 1800 (2011).
- (92) K. Lee, Y. Morikawa, and D.C. Langreth, Phys. Rev. B 82, 155461 (2010).
- (93) J. Wyrick, D.-H. Kim, D. Sun, Z .Cheng, W. Lu, Y. Zhu, K. Berland, Y.S. Kim, E. Rotenberg, M. Luo, P. Hyldgaard, T.L. Einstein, and L. Bartels, Nano Letters 11, 2944 (2011).
- (94) A. Møgelhøj, A. Kelkkanen, K.T. Wikfeldt, J. Schiøtz, J.J. Mortensen, L.G.M. Pettersson, B.I. Lundqvist, K.W. Jacobsen, A. Nilsson, and J.K. Nørskov, J. Phys. Chem. B 115, 14149 (2011).
- (95) E. Londero and E. Schröder, Computer Phys. Commun. 182, 1805 (2011).
- (96) De-Li Chen, W.A. Al-Saidi, and J.K. Johnson, Phys. Rev. B 84, 241405R (2011).
- (97) K. Berland, T.L. Einstein, and P. Hyldgaard, Phys. Rev. B 80, 155431 (2009).
- (98) K. Berland et al., unpublished (2012).