On Pulsar Distance Measurements and their Uncertainties
Abstract
Accurate distances to pulsars can be used for a variety of studies of the Galaxy and its electron content. However, most distance measures to pulsars have been derived from the absorption (or lack thereof) of pulsar emission by Galactic H i gas, which typically implies that only upper or lower limits on the pulsar distance are available. We present a critical analysis of all measured H i distance limits to pulsars and other neutron stars, and translate these limits into actual distance estimates through a likelihood analysis that simultaneously corrects for statistical biases. We also apply this analysis to parallax measurements of pulsars in order to obtain accurate distance estimates and find that the parallax and H i distance measurements are biased in different ways, because of differences in the sampled populations. Parallax measurements typically underestimate a pulsar’s distance because of the limited distance to which this technique works and the consequential strong effect of the Galactic pulsar distribution (i.e. the original Lutz-Kelker bias), in H i distance limits, however, the luminosity bias dominates the Lutz-Kelker effect, leading to overestimated distances because the bright pulsars on which this technique is applicable are more likely to be nearby given their brightness.
1 Introduction
The rotation of pulsars, which causes their continuous emission to be observed as highly regular pulses, makes these objects highly useful probes of any dispersive phenomena in interstellar space. Combined with an accurate and precise distance, pulsar emission (specifically its dispersion and Faraday rotation) provides crucial information for modelling of the Galactic electron distribution and magnetic field.
Parallax measurements are non-trivial undertakings and only very few significant parallax measurements (Gwinn et al., 1986; Bailes et al., 1990) were made within the first two decades after pulsars were discovered. Another method to determine a pulsar’s distance is based on Galactic H i spectra in the direction to the pulsar. This method (known as the kinematic or H i method) compares the H i spectrum on-pulse (when the pulsar emission is seen) and off-pulse (when the pulsar emission beam is turned away). Any observed pulsar absorption must originate in gas lying closer than the pulsar; while gas located farther than the pulsar will not exhibit absorption. The velocities of these respective H i regions are subsequently derived from the spectrum and translated to distances with help of a Galactic rotation model. The distance of the furthest H i gas that appears in absorption then provides a lower limit on the pulsar distance, while the distance of the nearest gas that only appears in emission, is interpreted as an upper limit on the pulsar distance.
Roughly two decades after the discovery of pulsars, Frail & Weisberg (1990, henceforth FW90) collated all published pulsar distances, which at the time consisted of 50 H i distances, three parallax measurements and 20 distances by association. Given the importance of H i distances, they critically investigated the various measurements and defined a set of criteria that has been used in almost all subsequent publications.
Progress in both interferometric hardware (at the Long Baseline Array in the South and the Very Long Baseline Array in the North) and in the sensitivity of pulsar timing, subsequently allowed an exponential increase in the number of measured pulsar parallaxes so that currently 57 parallaxes are measured. This led Verbiest et al. (2010, henceforth VLM10) to collate those distances and investigate the statistical bias predicted by Lutz & Kelker (1973). The work presented by VLM10 was based on a Bayesian analysis that took into account both the Galactic distribution of pulsars (which is the actual bias first discussed by Lutz and Kelker in 1973) and the intrinsic pulsar luminosity distribution; but they only considered parallax measurements.
In this paper, we present an update of the work done by FW90: we list all 80 published distances to pulsars and other neutron stars, based on H i measurements or associations with objects having H i distances, and evaluate them based largely on the criteria laid out by FW90. We then improve the analysis of VLM10 by deriving fully analytic solutions that replace the need for (approximate) Monte-Carlo simulations. Also, the VLM10 analysis is expanded to incorporate information provided by H i distance limits; and to provide bias-corrected distances in addition to parallaxes. As in the case of VLM10, the present paper bases its bias-correction method on empirical models for the Galactic pulsar distribution and luminosity function. These models do add an unquantified level of uncertainty to the analysis, but can easily be updated as our knowledge about the pulsar population grows through pulsar surveys. The evaluation of H i distance limits is presented in Section 2; the likelihood analysis to correct for the biases is derived in Section 3. Bias-corrected parallaxes and distances are given in tables 1 and 2 and a summarising discussion is found in Section 4.
2 H i Kinematic Distances
2.1 Source Selection and H i Kinematic Distance Limit Determination
FW90 established standard techniques for the extraction of reliable pulsar kinematic distance limits. Specifically, they defined the bound of K on the brightness temperature of H i emission used for deriving upper distance limits111They also note this bound can be relaxed depending on the sensitivity of the observation, provided the optical depth for the emission is 0.3 or higher., pointing out that weaker emission would not be expected to result in significant absorption. Secondly, they re-evaluated distance limits based on old Galactic models and rotation curves, defaulting to the IAU values for the distance of the Solar System to the centre of the Galaxy [kpc] and the Galactic rotation velocity in the Solar System neighborhood [km s-1](Kerr & Lynden-Bell, 1986), and using the flat rotation curve of Fich et al. (1989). In converting velocities to distances, furthermore, they assumed an uncertainty of 7 km s-1 because of known random motions of that order (Dickey & Lockman, 1990). Finally, in the Perseus arm, with its well-known spiral shock, they either used independent distance tracers or applied the approximation proposed by Joncas et al. (1989), which states the global rotation curve can be applied (near ) provided the measured H i velocities are decreased by a factor of 1.6. Most investigations since then have used these same criteria and so does the present paper, with a few exceptions as listed below.
In the current work, we present a uniformly-determined sample of neutron star H i kinematic upper and lower distance estimates by finding all such efforts in the literature, and then applying the FW90 criteria to any published data that have not previously been analyzed with that procedure. If the cited authors made a good case for a non-flat rotation curve (e.g, in the direction of the Galactic bar, the 3 kpc arm, or the Perseus arm shock), we maintain their curve in our analysis. If, however, the original authors used a flat rotation curve but non-IAU Galactic constants, we reanalyze the kinematic distance limits, using the flat rotation curve and IAU constants. We note that Reid et al. (2009) obtain a Galactic rotation velocity that is larger than the IAU value at a signficance of 95%. More recent measurements by the same authors have increased the significance of this offset to close to 99% (Reid, personal communication). Based on Eq. 2.21 of Damour & Taylor (1991), we find that this could imply an overestimate of our H i distance limits by up to (though generally much less), depending on Galactic longitude and the measured H i velocity.
In Table 1, we list the H i kinematic lower and upper distance limits, and respectively; and their uncertainties, and , to conventional radio pulsars as well as to otherwise radio-quiet neutron stars with radio bursts; and to supernova remnants (SNRs) securely associated with various kinds of neutron stars. The values shown are from the stated authors’ work, unless otherwise indicated in the table. If the original authors gave distance limits meeting our criteria, but neglected to derive uncertainties on these limits, then we do so ourselves according to the procedure laid out in FW90. In such cases, the table entry’s reference shows a superscript . If we judge that the listed authors’ distance limits themselves need adjustment, we do so and mark the entry’s reference with a superscript , and describe details of any such changes in §2.2. Two sources, marked with the superscript , had two or more original sets of distance limits because the cited authors evaluated multiple Galactic rotation models without expressing a clear preference for one; in those cases we select the one using the standard flat rotation curve, for overall consistency. (Note that in none of these cases the various rotation models provided significantly different results.)
2.2 Notes on individual sources
In the subsections below, we explain any adjustments to criteria that led to the originally published upper and/or lower distance limits. The values themselves are summarized in Table 1.
2.2.1 SNR Kesteven 73 and AXP 1E1841-045
Tian & Leahy (2008a) performed an H i kinematic distance study of the supernova remnant Kes 73, which is associated with AXP 1E1841-045. The authors showed that the SNR absorption extends to the tangent point, 7.5 kpc distant, which marks the lower distance limit. They also made the case that the lack of absorption at km s-1 sets an upper distance limit on the far side of the tangent point. We find these arguments compelling. However, we find that the flat rotation curve then indicates that kpc, whereas Tian & Leahy (2008a) quoted kpc for a flat rotation curve.
2.2.2 PWN G54.1+0.3 and PSR J1930+1852
Leahy et al. (2008) analyzed H i spectra of PWN G54.1+0.3, which is associated with PSR J1930+1852. We confirm that the lower distance limit is at the tangent point. While they place the upper distance limit at the Solar Circle on the far side of the Galaxy due to a lack of any negative velocity absorption, we instead adhere to the procedure of FW90, relaxing the limit to the distance corresponding to the first strong emission at negative velocities not showing absorption, i.e., at km s-1. After resetting the rotation curve to the flat model with IAU galactic constants, we then find that kpc.
2.2.3 SNR CTB 80 and PSR B1951+32
Strom & Stappers (2000) measured the H i absorption spectrum of SNR CTB 80, which is associated with PSR B1951+32. There is significant absorption out to the tangent point, yielding kpc. Unfortunately, the published absorption spectrum does not extend below km s-1, which is insufficient to establish a measurement.
3 Lutz-Kelker Bias and Corrections
Lutz & Kelker (1973) first presented the argument that because of the non-linearity of sample volume with distance, objects are statistically more likely to be further away rather than closer by. Correction for this bias (which is related to the Malmquist bias but is more correctly named Lutz-Kelker bias, as discussed by VLM10, ) is relatively straightforward through a likelihood analysis that incorporates probabilities derived from a variety of possible measurements. Our derivation is similar to that of VLM10 but differs in a few fundamental areas. First, the primary focus of VLM10 was biases in parallax measurements, while our analysis considers both parallax and distance, which is a more natural quantity when dealing with H i distance limits. (Note that the conversion between parallax and distance is not a simple inversion in the case of finite uncertainties, as the transformation between these two quantities is non-linear.) Second, where VLM10 applied a Bayesian analysis with prior information based on the pulsar luminosity and position in the Galaxy, we consider these quantities as measurements and have hence no need for prior information at all, which removes the Bayesian character of this analysis and leaves a straightforward likelihood analysis. Effectively this is no more than an aesthetic difference, however, which does not affect the results. Indeed, our approach could be considered Bayesian with a uniform prior. In particular, our analysis considers the following possible measurements:
-
•
a parallax measurement, ;
-
•
a lower H i distance limit, ;
-
•
an upper H i distance limit, ;
-
•
the pulsar radio flux, (measured at or near an observing frequency of GHz);
-
•
and the pulsar’s Galactic position, .
Given a subset or all of these measurements and assuming no correlations between these values, we can determine the probability density function of the pulsar distance, , through
| (1) |
In the above equation (as in all equations throughout this paper), we only explicitly state dependence on parameters, while dependence on the uncertainties of said parameters is implied. In other words, where we write , we really mean . In the following, these five terms will be derived; they will respectively be referred to as the parallax term, the lower H i limit term, the upper H i limit term, the luminosity term and the volumetric or Galactic term.
3.1 The Parallax Term,
Given a measurement with uncertainty and assuming a Gaussian uncertainty distribution, the probability of the true parallax given the data is
| (2) |
Since , this means
| (3) |
In the case of asymmetric uncertainties on parallax measurements (as given, e.g., by Chatterjee et al., 2009), we assume
| (4) |
with and respectively the upper and lower limit of the 1 interval of the measurement’s probability density function; and with the Heaviside step function, for which
| (5) |
For distance, as in the symmetric case, the extra factor of is added, resulting in
| (6) |
3.2 The H i Distance Limit Terms,
Assuming the distance of the furthest absorbing H i gas is determined to be with measurement uncertainty , then the probability distribution of the actual distance of the limiting gas is given (assuming Gaussian uncertainties) by
| (7) |
where is the actual distance of the gas and hence the actual lower limit on the pulsar distance. This implies that for any pulsar distance we must have . Hence we derive the probability distribution for the pulsar’s distance as
| (8) |
in which
| (9) |
with the heaviside function, as defined above. We therefore have
| (10) |
which results in
| (11) |
with the error function.
Analogous to the above derivation, we have the probability distribution for the distance of the nearest gas not seen in absorption
| (12) |
which is used in the probability distribution for the pulsar’s distance as:
| (13) |
with
| (14) |
hence:
| (15) |
which results in
| (16) |
3.3 The Galactic (“Volumetric”) Term,
As derived by Lorimer et al. (2006), the distribution of pulsars in the Galaxy is not homogeneous, but rather follows a distribution of the form
| (17) |
with the number of pulsars per volume and constants Rkpc, , and pc for common pulsars and pc for millisecond pulsars (constants from model fit C and equations 10 and 11 from Lorimer et al., 2006).
Since the volume density is invariant with the coordinate system used, we can use an Earth-based coordinate system based on the Galactic coordinates of the pulsar and its distance to the Earth, , for which . For the Earth-based observer the infinitesimal sample volume now becomes
| (18) |
for a pulsar at given distance and an infinitesimal solid angle . The number of pulsars in this volume is, hence,
| (19) |
Since the infinitessimal probability scales with , we get
| (20) |
Consequently, we derive
| (21) |
with
| (22) |
and
| (23) |
3.4 The Pulsar Luminosity Term,
Finally, since the radio flux, , of pulsars is related to the luminosity222Note that Faucher-Giguère & Kaspi (2006) define a “pseudo-luminosity” that avoids the complexities of emission beam and viewing geometries. This approach is practical for our purposes and hence we copy their usage of as an effective ’pseudo-luminosity’., , of the pulsar through , this measure can be used to constrain the pulsar distance, through the luminosity distribution of radio pulsars derived by Faucher-Giguère & Kaspi (2006). Considering pulsar luminosities at 1.4 GHz observing frequency with luminosity expressed in units of mJy kpc2, they proposed a log-normal function with mean and standard deviation :
| (24) |
With , we get
| (25) |
or, given ,
| (26) |
Note that this probability is based on the measured radio flux of the pulsar, not on the H i flux or the luminosity of an associated supernova remnant or the like. Also, given the analysis of Faucher-Giguère & Kaspi (2006) who derived the luminosity distribution that we use, the above analysis does not hold for non-radio or bursting pulsars.
3.5 Combined Distance Probability
Combining equations 3, 11, 16, 21 and 26 into Equation 1, we obtain the complete formula for the pulsar distance given the five measurements listed at the start of this section:
| (27) |
with as in Equation 23. Note that the parallax term should be replaced by Equation 3.1 in case of asymmetric uncertainties. (Technically Equation 3.1 can be applied generally to both asymmetric and symmetric cases, but for reasons of clarity, we present the more common, simplified formula here.) Note also that in case measurements are not available, the relevant terms should be omitted, as (for example) is nonsensical in the absence of a measurement.
Equivalently, we find for the pulsar’s parallax
| (28) |
where each term contributes a factor , since , etc., implying that each of the five terms contributes a term.
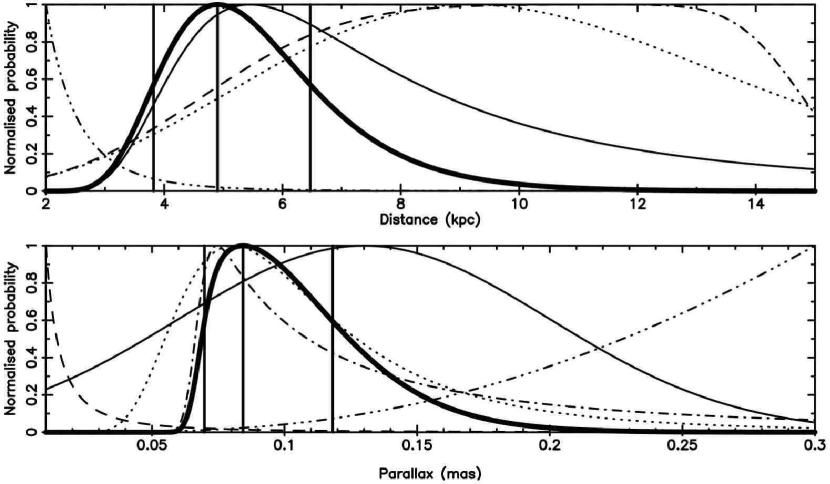
Equation 3.5 presents the analytic result to the question first discussed by VLM10. However, because in that previous paper parts of the analysis were performed by Monte-Carlo simulation, our present results are more accurate; and in contrast to the analysis by VLM10, which only considered parallax, we now derive the full formulae for both distance and parallax. We therefore present in Table 2 the bias-corrected parallax and distance values for the pulsars with parallax measurements first collated by VLM10. Results for pulsars with H i distance limits (which were not included in VLM10, ), are presented in Table 1. For the data in these tables, we use the following definitions: the corrected distance () is the distance for which Equation 3.5 reaches a maximum; for corrected parallax () the same convention is used, based on Equation 3.5. The 1 uncertainty intervals are defined (consistent with Chatterjee et al., 2009) as the narrowest interval that contains 68% of the integrated probability density. In practice this means that a level is found so that the integral of for those values of where , contains 68% of the total probability. For bimodal distributions (which only occur towards the Galactic centre, and particularly for the measurements for PSR J17522806), this may result in two separate regions (a global optimum and a secondary optimum) which in combination contain 68% probability. Estimation of these quantities is analytically unfeasible and is therefore performed numerically. The code used to calculate the bias-corrected parallax and distance values and uncertainties listed in the tables, is available as a supplement to this paper and through an on-line interface on http://psrpop.phys.wvu.edu/LKbias. An example of the graphical output, showing all five probability terms for PSR J1939+2134 (B1937+21), is shown in Figure 1.
4 Discussion and Conclusions
Of the 80 pulsars with H i distance limits, all but one have post-correction distances consistent (at the 1 level assuming the uncertainties derived from our analysis) with the H i limits published. The exception is PSR J2018+2839 (PSR B2016+28), which has a lower distance limit of kpc, but a parallax measurement of mas (Brisken et al., 2002), which dominates the result and therefore makes the H i distance limit irrelevant. Furthermore, there is a single source that is beyond the upper H i distance limit (though within 1): this is XTE J1810-197, for which we determine a bias-corrected distance of kpc, which is just beyond the upper distance limit of kpc derived from H i observations. Since for this neutron star both the lower and the upper limit are equal; and because no radio luminosity is available, the volumetric term determines the slightly higher distance. For 20 sources, the bias-corrected distance is closer than the lower H i distance limit (though within 1) and 59 (or three out of four) sources are completely within the distance limits, with typically bias-corrected distances close to the lower H i distance limit. The fact that our analysis finds sources are more likely to be closer to the lower rather than upper H i distance limit (or, indeed, closer even than the lower limit), is unexpected when seen from the perspective presented by Lutz & Kelker (1973). There are two reasons for this.
First, the upper H i distance limits are mostly past the tangent point. This means that the volumetric term peaks within – or close to – the range allowed by the H i limits, which causes the volumetric bias to be either very weak or non-existent. Second, the pulsars to which H i distance limits have been measured, are mostly bright sources, with the exception of the flaring neutron stars and those neutron stars that have H i limits derived from associations with supernova remnants. The brightness of these pulsars implies a luminosity term that peaks at very small distances.
Comparing the results in Table 1 and the discussion above with the results in Table 2, it is clear that the types of neutron star distance estimates (parallax and H i measurements) suffer from different statistical biases, although the magnitude of the biases is limited in both cases. While parallax measurements are typically biased towards smaller distances (i.e. the sources are actually further away than suggested by the measurement) because of the relatively limited distance to which this technique works (and the consequential strong effect of the volumetric term), the H i measurements are typically biased towards larger distances (i.e. the sources are often closer than suggested by the measurement) because the volumetric term has little impact and the luminosity term dominates the analysis.
Finally, of the eight pulsars with both H i distance limits and parallax distances, only PSR J1857+0943 (B1855+09) has a bias-corrected parallax that is inconsistent with the parallax measurement. The published value of mas (Verbiest et al., 2009) is found to be considerably larger than the most likely value of mas, which is partly because of the volumetric information (as already found by VLM10, who derived a value of mas), but also because of the H i limits, which place the pulsar well beyond 1 kpc.
References
- Backer & Fisher (1974) Backer, D. C. & Fisher, J. R. 1974, ApJ, 189, 137
- Bailes et al. (1990) Bailes, M., Manchester, R. N., Kesteven, M. J., Norris, R. P., & Reynolds, J. E. 1990, Nature, 343, 240
- Brisken et al. (2002) Brisken, W. F., Benson, J. M., Goss, W. M., & Thorsett, S. E. 2002, ApJ, 571, 906
- Brisken et al. (2003) Brisken, W. F., Thorsett, S. E., Golden, A., & Goss, W. M. 2003, ApJ, 593, L89
- Burgay et al. (2006) Burgay, M., Joshi, B. C., D’Amico, N., Possenti, A., Lyne, A. G., Manchester, R. N., McLaughlin, M. A., Kramer, M., Camilo, F., & Freire, P. C. C. 2006, MNRAS, 368, 283
- Chatterjee et al. (2009) Chatterjee, S., Brisken, W. F., Vlemmings, W. H. T., Goss, W. M., Lazio, T. J. W., Cordes, J. M., Thorsett, S. E., Fomalont, E. B., Lyne, A. G., & Kramer, M. 2009, ApJ, 698, 250
- Chatterjee et al. (2001) Chatterjee, S., Cordes, J. M., Lazio, T. J. W., Goss, W. M., Fomalont, E. B., & Benson, J. M. 2001, ApJ, 550, 287
- Chatterjee et al. (2004) Chatterjee, S., Cordes, J. M., Vlemmings, W. H. T., Arzoumanian, Z., Goss, W. M., & Lazio, T. J. W. 2004, ApJ, 604, 339
- Damour & Taylor (1991) Damour, T. & Taylor, J. H. 1991, ApJ, 366, 501
- Deller et al. (2009a) Deller, A. T., Bailes, M., & Tingay, S. J. 2009a, Science, 323, 1327
- Deller et al. (2009b) Deller, A. T., Tingay, S. J., Bailes, M., & Reynolds, J. E. 2009b, ApJ, 701, 1243
- Deller et al. (2009c) Deller, A. T., Tingay, S. J., & Brisken, W. 2009c, ApJ, 690, 198
- Deller et al. (2008) Deller, A. T., Verbiest, J. P. W., Tingay, S. J., & Bailes, M. 2008, ApJ, 685, L67
- Dickey & Lockman (1990) Dickey, J. M. & Lockman, F. J. 1990, Ann. Rev. Astr. Ap., 28, 215
- Dodson et al. (2003) Dodson, R., Legge, D., Reynolds, J. E., & McCulloch, P. M. 2003, ApJ, 596, 1137
- Faherty et al. (2007) Faherty, J., Walter, F. M., & Anderson, J. 2007, Ap&SS, 308, 225
- Faucher-Giguère & Kaspi (2006) Faucher-Giguère, C. A. & Kaspi, V. M. 2006, ApJ, 643, 332
- Fich et al. (1989) Fich, M., Blitz, L., & Stark, A. A. 1989, ApJ, 342, 272
- Fomalont et al. (1999) Fomalont, E. B., Goss, W. M., Beasley, A. J., & Chatterjee, S. 1999, AJ, 117, 3025
- Frail et al. (1993) Frail, D. A., Kulkarni, S. R., & Vasisht, G. 1993, Nature, 365, 136
- Frail & Weisberg (1990) Frail, D. A. & Weisberg, J. M. 1990, AJ, 100, 743
- Gaensler et al. (1999) Gaensler, B. M., Brazier, K. T. S., Manchester, R. N., Johnston, S., & Green, A. J. 1999, MNRAS, 305, 724
- Gaensler & Wallace (2003) Gaensler, B. M. & Wallace, B. J. 2003, ApJ, 594, 326
- Gwinn et al. (1986) Gwinn, C. R., Taylor, J. H., Weisberg, J. M., & Rawley, L. A. 1986, AJ, 91, 338
- Hotan et al. (2006) Hotan, A. W., Bailes, M., & Ord, S. M. 2006, MNRAS, 369, 1502
- Jacoby et al. (2007) Jacoby, B. A., Bailes, M., Ord, S. M., Knight, H. S., & Hotan, A. W. 2007, ApJ, 656, 408
- Jacoby et al. (2003) Jacoby, B. A., Bailes, M., van Kerkwijk, M. H., Ord, S., Hotan, A., Kulkarni, S. R., & Anderson, S. B. 2003, ApJ, 599, L99
- Johnston et al. (2001) Johnston, S., Koribalski, B., Weisberg, J. M., & Wilson, W. 2001, MNRAS, 322, 715
- Johnston et al. (1996) Johnston, S., Koribalski, B. S., Weisberg, J., & Wilson, W. 1996, MNRAS, 279, 661
- Joncas et al. (1989) Joncas, G., Roger, R. S., & Dewdney, P. E. 1989, A&A, 219, 303
- Kaplan et al. (2007) Kaplan, D. L., van Kerkwijk, M. H., & Anderson, J. 2007, ApJ, 660, 1428
- Kerr & Lynden-Bell (1986) Kerr, F. J. & Lynden-Bell, D. 1986, MNRAS, 221, 1023
- Koribalski et al. (1995) Koribalski, B. S., Johnston, S., Weisberg, J., & Wilson, W. 1995, ApJ, 441, 756
- Lazaridis et al. (2009) Lazaridis, K., Wex, N., Jessner, A., Kramer, M., Stappers, B. W., Janssen, G. H., Desvignes, G., Purver, M. B., Cognard, I., Theureau, G., Lyne, A. G., Jordan, C. A., & Zensus, J. A. 2009, MNRAS, 400, 805
- Leahy et al. (2008) Leahy, D. A., Tian, W., & Wang, Q. D. 2008, AJ, 136, 1477
- Leahy & Tian (2008) Leahy, D. A. & Tian, W. W. 2008, A&A, 480, L25
- Lewandowski et al. (2004) Lewandowski, W., Wolszczan, A., Feiler, G., Konacki, M., & Sołtysiński, T. 2004, ApJ, 600, 905
- Lommen et al. (2006) Lommen, A. N., Kipphorn, R. A., Nice, D. J., Splaver, E. M., Stairs, I. H., & Backer, D. C. 2006, ApJ, 642, 1012
- Lommen et al. (2000) Lommen, A. N., Zepka, A., Backer, D. C., McLaughlin, M., Cordes, J. M., Arzoumanian, Z., & Xilouris, K. 2000, ApJ, 545, 1007
- Lorimer et al. (2006) Lorimer, D. R., Faulkner, A. J., Lyne, A. G., Manchester, R. N., Kramer, M., McLaughlin, M. A., Hobbs, G., Possenti, A., Stairs, I. H., Camilo, F., Burgay, M., D’Amico, N., Corongiu, A., & Crawford, F. 2006, MNRAS, 372, 777
- Lutz & Kelker (1973) Lutz, T. E. & Kelker, D. H. 1973, PASP, 85, 573
- Manchester et al. (1980) Manchester, R. N., Hamilton, P. A., & McCulloch, P. M. 1980, MNRAS, 192, 153
- Manchester et al. (2005) Manchester, R. N., Hobbs, G. B., Teoh, A., & Hobbs, M. 2005, AJ, 129, 1993
- McClure-Griffiths & Gaensler (2005) McClure-Griffiths, N. M. & Gaensler, B. M. 2005, ApJ, 630, L161
- Minter et al. (2008) Minter, A. H., Camilo, F., Ransom, S. M., Halpern, J. P., & Zimmerman, N. 2008, ApJ, 676, 1189
- Nice et al. (2005) Nice, D. J., Splaver, E. M., Stairs, I. H., Löhmer, O., Jessner, A., Kramer, M., & Cordes, J. M. 2005, ApJ, 634, 1242
- Ord et al. (2002) Ord, S. M., Bailes, M., & van Straten, W. 2002, MNRAS, 337, 409
- Reid et al. (2009) Reid, M. J., Menten, K. M., Zheng, X. W., Brunthaler, A., Moscadelli, L., Xu, Y., Zhang, B., Sato, M., Honma, M., Hirota, T., Hachisuka, K., Choi, Y. K., Moellenbrock, G. A., & Bartkiewicz, A. 2009, ApJ, 700, 137
- Saravanan et al. (1996) Saravanan, T. P., Deshpande, A. A., Wilson, W., Davies, E., McCulloch, P. M., & McConnell, D. 1996, MNRAS, 280, 1027
- Stairs et al. (2002) Stairs, I. H., Thorsett, S. E., Taylor, J. H., & Wolszczan, A. 2002, ApJ, 581, 501
- Strom & Stappers (2000) Strom, R. G. & Stappers, B. W. 2000, in Pulsar Astronomy - 2000 and Beyond, IAU Colloquium 177, ed. M. Kramer, N. Wex, & R. Wielebinski (San Francisco: Astronomical Society of the Pacific), 509–510
- Tian & Leahy (2008a) Tian, W. W. & Leahy, D. A. 2008a, ApJ, 677, 292
- Tian & Leahy (2008b) —. 2008b, MNRAS, 391, L54
- Tian et al. (2010) Tian, W. W., Leahy, D. A., & Li, D. 2010, MNRAS, 404, L1
- van Kerkwijk & Kaplan (2007) van Kerkwijk, M. H. & Kaplan, D. L. 2007, Ap&SS, 308, 191
- Verbiest et al. (2009) Verbiest, J. P. W., Bailes, M., Coles, W. A., Hobbs, G. B., van Straten, W., Champion, D. J., Jenet, F. A., Manchester, R. N., Bhat, N. D. R., Sarkissian, J. M., Yardley, D., Burke-Spolaor, S., Hotan, A. W., & You, X. P. 2009, MNRAS, 400, 951
- Verbiest et al. (2010) Verbiest, J. P. W., Lorimer, D. R., & McLaughlin, M. A. 2010, MNRAS, 405, 564
- Weisberg et al. (1995) Weisberg, J. M., Siegel, M. H., Frail, D. A., & Johnston, S. 1995, ApJ, 447, 204
- Weisberg et al. (2008) Weisberg, J. M., Stanimirović, S., Xilouris, K., Hedden, A., de la Fuente, A., Anderson, S. B., & Jenet, F. A. 2008, ApJ, 674, 286
- Wolszczan et al. (2000) Wolszczan, A., Doroshenko, O., Konacki, M., Kramer, M., Jessner, A., Wielebinski, R., Camilo, F., Nice, D. J., & Taylor, J. H. 2000, ApJ, 528, 907
| Pulsar name | Association | RefeeReferences: (1) Frail & Weisberg (1990); (2) Johnston et al. (1996); (3) Koribalski et al. (1995); (4) Gaensler & Wallace (2003); (5) Ord et al. (2002); (6) Saravanan et al. (1996); (7) Gaensler et al. (1999); (8) Johnston et al. (2001); (9) Weisberg et al. (1995); (10) Johnston et al. (2001); (11) Frail et al. (1993) and Frail personal communication; (12) McClure-Griffiths & Gaensler (2005); (13) Minter et al. (2008); (14) Tian & Leahy (2008b); (15) Tian & Leahy (2008a); (16) Leahy & Tian (2008); (17) Weisberg et al. (2008); (18) Leahy et al. (2008); (19) Strom & Stappers (2000); (20) Tian et al. (2010); (21) Brisken et al. (2002), (22) Chatterjee et al. (2004), (23) Deller et al. (2009c), (24) Verbiest et al. (2009), (25) Chatterjee et al. (2009). | |||||||
|---|---|---|---|---|---|---|---|---|---|
| J2000 | B1950 | (mas) | (kpc) | (kpc) | (mJy) | (mas) | (kpc) | ||
| J0141+6009 | B0138+59 | - | 4.5 | (1) | |||||
| J0332+5434 | B0329+54 | 203 | (1, 21) | ||||||
| J0358+5413 | B0355+54 | 23 | (1, 22) | ||||||
| J07384042 | B073640 | - | - | 80 | (2) | ||||
| J07422822 | B074028 | - | 15 | (3) | |||||
| J08374135 | B083541 | - | 16 | (2) | |||||
| J09084913 | B090649 | - | 10.0 | (3) | |||||
| J09425552 | B094055 | - | - | 10.0 | (2) | ||||
| J10015507 | B095954 | - | - | 6.3 | (3) | ||||
| J10485832 | B104658 | - | 6.5 | (2) | |||||
| J10566258 | B105462 | - | 21 | (3) | |||||
| J11245916 | SNR G292.0+1.8 core | - | - | 0.08 | (4)aaDistance limit uncertainty is derived by the current authors. | ||||
| J11416545 | - | - | 3.3 | (5)aaDistance limit uncertainty is derived by the current authors. | |||||
| J11576224 | B115462 | - | 5.9 | (2) | |||||
| J12246407 | B122163 | - | 3.9 | (2) | |||||
| J12436423 | B124064 | - | 13 | (1) | |||||
| J13265859 | B132358 | - | - | 9.9 | (6) | ||||
| J13276222 | B132362 | - | 16.0 | (1) | |||||
| J13596038 | B135660 | - | - | 7.6 | (1) | ||||
| J14016357 | B135863 | - | 6.2 | (2) | |||||
| J14536413 | B144964 | - | - | 14.0 | (3) | ||||
| J15135908 | B150958 | SNR G320.4-01.2 | - | 0.94 | (7) | ||||
| J15594438 | B155644 | - | 40 | (3, 23) | |||||
| J16005044 | B155750 | - | 17.0 | (8) | |||||
| J16025100 | B155850 | - | 5.7 | (8) | |||||
| J16444559 | B164145 | - | 310 | (1) | |||||
| J16514246 | B164842 | - | - | 16.0 | (9) | ||||
| J17074053 | B170340 | - | - | 7.2 | (9) | ||||
| J17094429 | B170644 | - | 7.3 | (3) | |||||
| J17213532 | B171835 | - | 11.0 | (9) | |||||
| J17403015 | B173730 | - | - | 6.4 | (8) | ||||
| J17453040 | B174230 | - | - | 13.0 | (8) | ||||
| J17522806 | B174928 | - | - | 18.0 | ddPSR J17522806 (B174928) has a secondary optimum in its parallax, at mas. | (1, 10) | |||
| J18012304 | B175823 | - | 2.2 | (11) | |||||
| J18032137 | B180021 | SNR G8.7-0.1 | - | 7.6 | (1) | ||||
| J18070847 | B180408 | - | - | 15.0 | (1) | ||||
| SGR 180620 | radioflare 2005 | - | - | - | (12) | ||||
| XTE J1810197 | radioflare 2006 | - | - | (13)ffOriginal authors cited multiple distances derived from multiple rotation curves; we choose the standard flat model. | |||||
| J18200427 | B181804 | - | - | 6.1 | (1) | ||||
| J1823+0550 | B1821+05 | - | - | 1.7 | (1) | ||||
| J18241945 | B182119 | - | - | 4.9 | (8) | ||||
| J18250935 | B182209 | - | - | 12.0 | (8) | ||||
| J18320827 | B182908 | - | 2.1 | (1) | |||||
| J18330827 | B183008 | - | 3.6 | (9) | |||||
| J18331034 | SNR G21.5-0.9 | - | 0.071 | (14)a,ga,gfootnotemark: | |||||
| AXP 1E1841045 | SNR Kes73 | - | - | (15)b,fb,ffootnotemark: | |||||
| J18460258 | SNR Kes75 | - | - | (16)a,ga,gfootnotemark: | |||||
| J18480123 | B184501 | - | 8.6 | (1) | |||||
| J1852+0031 | B1849+00 | - | 2.2 | (1) | |||||
| J1857+0212 | B1855+02 | - | - | 1.6 | (1) | ||||
| J1857+0943 | B1855+09 | 5 | (1, 24) | ||||||
| J1901+0331 | B1859+03 | - | 4.2 | (1) | |||||
| J1901+0716 | B1859+07 | - | 0.9 | (1) | |||||
| J1902+0556 | B1900+05 | - | 1.2 | (1) | |||||
| J1902+0615 | B1900+06 | - | 1.1 | (1) | |||||
| J1903+0135 | B1900+01 | - | 1.1 | (1) | |||||
| J1906+0641 | B1904+06 | - | 1.7 | (1) | |||||
| J1909+0254 | B1907+02 | - | - | 0.63 | (17) | ||||
| J1909+1102 | B1907+10 | - | 1.9 | (1) | |||||
| J1915+1009 | B1913+10 | - | 1.3 | (1) | |||||
| J1916+1312 | B1914+13 | - | 1.2 | (1) | |||||
| J1917+1353 | B1915+13 | - | 1.9 | (1) | |||||
| J1921+2153 | B1919+21 | - | - | 6 | (1) | ||||
| J1922+2110 | B1920+21 | - | 1.4 | (17) | |||||
| J1926+1648 | B1924+16 | - | 1.3 | (17) | |||||
| J1932+1059 | B1929+10 | - | 36 | (1, 22) | |||||
| J1932+2020 | B1929+20 | - | 1.2 | (1) | |||||
| J1930+1852 | PWN G54.1+0.3 | - | 0.06 | (18)b,gb,gfootnotemark: | |||||
| J1932+2220 | B1930+22 | - | 1.2 | (1) | |||||
| J1935+1616 | B1933+16 | - | 42 | (1, 25) | |||||
| J1939+2134 | B1937+21 | 10 | (1, 24) | ||||||
| J1946+1805 | B1944+17 | - | - | 10 | (1) | ||||
| J1952+3252 | B1951+32 | SNR CTB80 | - | - | 1.0 | (19)b,hb,hfootnotemark: | |||
| J2004+3137 | B2002+31 | - | 1.8 | (1) | |||||
| J2018+2839 | B2016+28 | - | 30 | (1, 21) | |||||
| J2022+2854 | B2020+28 | - | 38 | (1, 21) | |||||
| J2113+4644 | B2111+46 | - | 19 | (1) | |||||
| J2257+5909 | B2255+58 | - | - | 9.2 | (1) | ||||
| AXP 1E2259+586 | SNR CTB109 | - | ccUpper limit based on CO emission from a molecular cloud associated with SNR CTB109. | - | (20) | ||||
| J2321+6024 | B2319+60 | - | - | 12 | (1) | ||||
| Pulsar name | Ref. | |||||
|---|---|---|---|---|---|---|
| J2000 | B1950 | (mas) | (mJy) | (mas) | (kpc) | |
| J0030+0451 | 0.6 | Lommen et al. (2006, 2000) | ||||
| J00340721 | B003107 | 11 | Chatterjee et al. (2009) | |||
| J01081431 | 1.0 | Deller et al. (2009b) | ||||
| J0139+5814 | B0136+57 | 4.6 | Chatterjee et al. (2009) | |||
| J04374715 | 142 | Deller et al. (2008) | ||||
| J04521759 | B045018 | 5.3 | Chatterjee et al. (2009) | |||
| J0454+5543 | B0450+55 | 13 | Chatterjee et al. (2009) | |||
| J0538+2817 | 1.9 | Chatterjee et al. (2009); Lewandowski et al. (2004) | ||||
| J06130200 | 1.4 | Verbiest et al. (2009) | ||||
| J06302834 | B062828 | 23 | Deller et al. (2009b) | |||
| J0633+1746 | - | Faherty et al. (2007) | ||||
| J0659+1414 | B0656+14 | 3.7 | Brisken et al. (2003) | |||
| J07203125 | - | Kaplan et al. (2007) | ||||
| J07373039A | 1.6 | Deller et al. (2009a); Burgay et al. (2006) | ||||
| J0751+1807 | 3.23 | Nice et al. (2005) | ||||
| J0814+7429 | B0809+74 | 10 | Brisken et al. (2002) | |||
| J08201350 | B081813 | 7 | Chatterjee et al. (2009) | |||
| J0826+2637 | B0823+26 | 10 | Gwinn et al. (1986) | |||
| J08354510 | B083345 | 1100 | Dodson et al. (2003); Backer & Fisher (1974) | |||
| J0922+0638 | B0919+06 | 4.2 | Chatterjee et al. (2001) | |||
| J0953+0755 | B0950+08 | 84 | Brisken et al. (2002) | |||
| J1012+5307 | 3 | Lazaridis et al. (2009) | ||||
| J1022+1001 | 3 | Verbiest et al. (2009) | ||||
| J10240719 | 0.66 | Hotan et al. (2006) | ||||
| J10454509 | 3 | Verbiest et al. (2009) | ||||
| J1136+1551 | B1133+16 | 32 | Brisken et al. (2002) | |||
| J1239+2453 | B1237+25 | 10 | Brisken et al. (2002) | |||
| J1300+1240 | B1257+12 | 2 | Wolszczan et al. (2000) | |||
| J14566843 | B145168 | 80 | Bailes et al. (1990); Manchester et al. (1980) | |||
| J1509+5531 | B1508+55 | 8 | Chatterjee et al. (2009) | |||
| J1537+1155 | B1534+12 | 0.6 | Stairs et al. (2002) | |||
| J1543+0929 | B1541+09 | 5.9 | Chatterjee et al. (2009) | |||
| J16003053 | 3.2 | Verbiest et al. (2009); Jacoby et al. (2007) | ||||
| J16431224 | 4.8 | Verbiest et al. (2009) | ||||
| J1713+0747 | 8 | Verbiest et al. (2009) | ||||
| J17441134 | 3 | Verbiest et al. (2009) | ||||
| J18563754 | - | van Kerkwijk & Kaplan (2007) | ||||
| J19002600 | B185726 | 13 | Fomalont et al. (1999) | |||
| J19093744 | 3 | Verbiest et al. (2009); Jacoby et al. (2003) | ||||
| J2022+5154 | B2021+51 | 27 | Brisken et al. (2002) | |||
| J20481616 | B204516 | 13 | Chatterjee et al. (2009) | |||
| J2055+3630 | B2053+36 | 2.6 | Chatterjee et al. (2009) | |||
| J21243358 | 1.6 | Verbiest et al. (2009) | ||||
| J21295721 | 1.4 | Verbiest et al. (2009) | ||||
| J21443933 | 0.8 | Deller et al. (2009b) | ||||
| J21450750 | 8 | Verbiest et al. (2009) | ||||
| J2157+4017 | B2154+40 | 17 | Chatterjee et al. (2009) | |||
| J2313+4253 | B2310+42 | 15 | Chatterjee et al. (2009) | |||