Near-infrared spectroscopy of stellar populations in nearby spiral galaxies††thanks: Based on observations collected at the European Southern Observatory (ESO), Chile, programs 068.B-0653 and 076.B-0714
Abstract
We present high spatial resolution, medium spectral resolution near-infrared (NIR) - and -band long-slit spectroscopy for a sample of 29 nearby () inactive spiral galaxies, to study the composition of their NIR stellar populations. These spectra contain a wealth of diagnostic stellar absorption lines, e.g. Mgi 1.575 m, Sii 1.588 m, CO (6-3) 1.619 m, Mgi 1.711 m, Nai 2.207 m, Cai 2.263 m and the 12CO and 13CO bandheads longward of 2.29 m. We use NIR absorption features to study the stellar population and star formation properties of the spiral galaxies along the Hubble sequence, and we produce the first high spatial resolution NIR -band template spectra for low redshift spiral galaxies along the Hubble sequence. These templates will find applications in a variety of galaxy studies. The strength of the absorption lines depends on the luminosity and/or temperature of stars and, therefore, spectral indices can be used to trace the stellar population of galaxies. The entire sample testifies that the evolved red stars completely dominate the NIR spectra, and that the hot young star contribution is virtually nonexistent.
keywords:
galaxies: elliptical and lenticular, cD – galaxies: spiral – galaxies: stellar content – infrared: galaxies1 Introduction
Disentangling the stellar populations of galaxies is important to understanding their evolution and the enhancement of star formation in the Universe, since the integrated spectrum of galaxies is sensitive to the mass, age, metallicity, dust and star formation history of their dominant stellar populations. Despite this complexity, the observed optical spectra of galaxies can be accurately reproduced (e.g., Worthey 1994). High-quality observational data is paramount to test and improve spectrophotometric models, which are used, in turn, to derive the main properties of high redshift galaxies. Optical Lick spectral indices have usually been used in stellar population studies of local galaxies (Worthey & Ottaviani 1997), but they have problems due to blended features and various population of galaxies. Near-infrared (NIR, hereafter) spectroscopy has advantages compared to optical, because red giant branch (RGB) stars dominate at m and the wavelength region contains many diagnostic stellar absorption lines (e.g., Mgi 1.575 m, Si m, CO(6-3) 1.619 m, Mgi 1.711 m, Nai m, Cai 2.263 m and CO(2-0) bandhead 2.29 m) which can be used as indicators of stellar population in terms of their temperature and/or luminosity. The contributions of dwarf, giant and supergiant stars can be characterized by different depths of their absorption lines and by different shapes of their NIR continuum (e.g. Lançon et al. 1999).
Much of the work at NIR wavelengths has focused on unusual objects with either active galactic nuclei (AGN) or very strong star formation activity. These surveys include those of luminous and ultraluminous infrared galaxies (Goldader et al. 1997; Burston, Ward, & Davies 2001; Dannerbauer et al. 2005), various types of starbursts (Engelbracht et al. 1998; Vanzi & Rieke 1997; Coziol, Doyon, & Demers 2001; Reunanen, Tacconi-Garman & Ivanov 2007), Seyfert galaxies (Ivanov et al. 2000; Reunanen, Kotilainen, & Prieto 2002,2003; Riffel et al. 2009) LINERs (Larkin et al. 1998; Alonso-Herrero et al. 2000), and ellipticals (Silva et al. 2008; Cesetti et al. 2009). However, relatively little NIR spectroscopy exists for inactive nearby spiral galaxies. Such surveys are necessary, though, for understanding their star formation histories, and for setting a baseline for the NIR emission from inactive spiral galaxies. Without such a baseline, the contribution of quiescent stellar populations to NIR emission in more exotic systems like ultraluminous infrared galaxies and starbursts will remain unknown.
The two largest previous NIR spectroscopic studies of inactive spirals were performed by Mannucci et al. (2001) and Bendo & Joseph (2004). Mannucci et al. (2001) studied 28 galaxies with a 7 x 53 arcsec aperture and R = 400 - 500. Generally, they found a high degree of uniformity for the spectra of spirals (earlier types being more homogeneous) but their study was hampered by the low spectral resolution which prevented them from detecting faint and/or blended lines. More recently, Bendo & Joseph (2004) studied 41 galaxies in the K-band and 20 galaxies in the H-band, with slightly higher spectral resolution R = 800–1200. They extracted spectra from 3015 arcsec apertures, and found that in almost all cases evolved red stars completely dominate the nuclear stellar populations, while young stars were virtually non-existent. We stress, however, that both these studies suffer from poor spatial resolution, leading to a possible mix of bulge and disk stellar populations.
To improve this situation, we present in this work NIR spectroscopy of nearby inactive spiral galaxies along the Hubble sequence, to study their stellar population content and SF histories. Stellar emission and absorption features can probe with great detail the age and SF properties of the stellar population in the nucleus and as a function of radius. Comparison of these properties along the Hubble sequence of spirals will assess any relationship of SF with Hubble stage.
We present NIR spectroscopy for a sample of 29 nearby () spirals with reasonable spatial resolution (1 kpc/arcsec) and medium spectral resolution (600) to study the NIR properties and ages of their stellar populations. Except for a few individual sources, these are the first medium resolution NIR spectra of a sizable sample of low redshift spirals. Long-slit spectra of the spirals are extracted across the nucleus to detect all the important diagnostic absorption lines, and emission from the galaxies can usually be studied to large distance from the nucleus. Our aim is to study the stellar population of spirals based on the NIR stellar absorption indices, and to inter-compare these indices within the different morphology types.
This paper is organized as follows: In Section 2 we describe the sample selection, observations, data reduction and methods of analysis. In Section 3, we present the results and discussion concerning the properties of the galaxies, and the composite quiescent spectra, and in Section 4 we summarize our conclusions based on the full sample of 29 spiral galaxies. Throughout this paper, we adopt a concordance cosmology with = 70 km s-1 Mpc-1, = 0.3 and = 0.7.
2 Sample selection, observations, data reduction and analysis
This project started as a followup to our NIR spectroscopy of Seyfert galaxies (Reunanen et al. 2002, 2003). We created a comparison sample of non-active spiral galaxies that were matched in Hubble type with our sample of Seyferts. We selected in each Hubble type from E to Sc a similar number of nearby bright galaxies (z 0.01; m(K) 11 to keep the exposure time reasonable to reach the required S/N) and paid careful attention that the spiral galaxies had no indication of nuclear or peculiar activity, based on their multiwavelength properties, especially from optical spectroscopy, radio and X-ray data. We planned to observe five galaxies for each Hubble type between E and Sc, in order to obtain a good estimate of the intrinsic spread in the spectra of each class, to remove possible individual peculiar characteristics. Although our sample is not complete, we consider it as representative of the class of nearby spiral galaxies, and an improvement over the samples in Mannucci et al. (2001) and Bendo & Joseph (2004).
The H- and K-band spectroscopic observations of the spirals were carried out in February 2002 and March 2006 at the 3.5 m ESO New Technology Telescope (NTT) using the 10241024 px SOFI camera and spectrograph (Moorwood et al. 1998) with pixel scale 0.288 arcsec pix-1. The average seeing during the observations was 0.7 ′′ FWHM. The medium resolution (600) long-slit -band spectra were taken along the major axis of the galaxies and across the nucleus, with the red grism and slit width 1.0 arcsec. The wavelength range of the spectra is from 1.5 to 2.5 m and the useful slit length 2′. The spectra of each target were taken with pairs using ABBA observing cycle of alternating galaxy and sky exposures nodding 60 arcsec along the slit, and slightly moving the target position in the slit between exposures, with total integration time of 48 minutes (except 32 minutes for NGC 5612), divided into individual exposures of 60 s.
A literature search was carried out to collect previous measurements of the galaxies in our sample: intrinsic velocity dispersion , and optical spectral indices Mg2 and H in the Lick system (e.g., Targer et al. 1998 and references therein). The velocity dispersion and the Mg2 are taken from the HyperLEDA compilation111http://leda.univ-lyon1.fr/ (Paturel et al. 2003), which has applied unification of the measurements from different sources (i.e. Golev & Prugniel 1998). An average H was taken if more than one measurement was available. The measurements are listed in Table 1, together with other properties of the observed sample of galaxies (redshift, K-band magnitude, morphological type, Hubble type), and the FWHM seeing during the observations. The literature references are given in Table 2.
| Galaxy | z | m(K) | Morphology | type | T | Mg2 | H | Date | Seeing | |
|---|---|---|---|---|---|---|---|---|---|---|
| km/s | dd/mm/yyyy | ′′ | ||||||||
| (1) | (2) | (3) | (4) | (5) | (6) | (7) | (8) | (9) | (10) | (11) |
| NGC 1617 | 0.003546 | 9.2 | SB(s)a | .SBS1.. | 1.0 | . . . | . . . | . . . | 20/02/2002 | 0.9 |
| NGC 2090 | 0.003072 | 10.3 | SA(rs)c | .SAT5.. | 5.0 | . . . | . . . | . . . | 07/03/2006 | 0.8 |
| NGC 2196 | 0.007742 | 10.3 | (R’)SA(s)a | PSAS1.. | 1.0 | . . . | . . . | . . . | 08/03/2006 | 0.6 |
| NGC 2380 | 0.005944 | 9.0 | SAB00: | .LX.0*. | -1.7 | 18725 | 0.2730.012 | . . . | 07/03/2006 | 0.8 |
| NGC 2502 | 0.003551 | 9.6 | SAB00(s) | .LXS0.. | -2.0 | 1423 | 0.2620.005 | 1.410.25 | 08/03/2006 | 0.6 |
| NGC 2566 | 0.005460 | 9.5 | (R’)SB(rs)ab pec: | PSBT2P* | 2.5 | . . . | . . . | . . . | 07/03/2006 | 0.75 |
| NGC 2613 | 0.005591 | 9.6 | SA(s)b | .SAS3.. | 3.0 | 16912 | . . . | . . . | 22/02/2002 | 0.9 |
| NGC 2640 | 0.003506 | 8.5 | SAB0- | .LX.-.. | -3.0 | . . . | . . . | . . . | 08/03/2006 | 0.6 |
| NGC 2775 | 0.004503 | 9.6 | SA(r)ab | .SAR2.. | 2.0 | 1767 | 0.2630.014 | . . . | 22/02/2002 | 0.8 |
| NGC 2781 | 0.006848 | 9.8 | SAB0+(r) | .LXR+.. | -1.0 | 14415 | 0.2040.004 | 2.040.17 | 08/03/2006 | 0.5 |
| NGC 2855 | 0.006328 | 10.1 | (R)SA(rs)0/a | RSAT0.. | 0.0 | 23125 | . . . | . . . | 10/03/2006 | 0.7 |
| NGC 2935 | 0.007575 | 9.8 | (R’)SAB(s)b | PSXS3.. | 3.0 | . . . | . . . | . . . | 22/02/2002 | 1.0 |
| NGC 3056 | 0.003246 | 10.1 | (R)SA0-(s): | RLAS+*. | -1.0 | 743 | 0.1550.018 | . . . | 07/03/2006 | 0.75 |
| NGC 3637 | 0.006158 | 10.1 | (R)SB(r)0 | RLBR0.. | -2.0 | 12314 | 0.2430.016 | . . . | 08/03/2006 | 0.45 |
| NGC 3715 | 0.007085 | 10.8 | (R’)SB(rs)bc: | PSBT4*. | 4.0 | . . . | . . . | . . . | 07/03/2006 | 0.8 |
| NGC 3810 | 0.003309 | 10.6 | SA(rs)c | .SAT5.. | 5.0 | 638 | 0.1240.011 | . . . | 10/03/2006 | 0.7 |
| NGC 3892 | 0.005994 | 10.6 | SB0+(rs) | .LBT+.. | -1.0 | 1166 | 0.2480.017 | . . . | 20/02/2002 | 0.9 |
| NGC 4179 | 0.004190 | 11.3 | S0 edge-on | .L…./ | -2.0 | 1578 | . . . | . . . | 21/02/2002 | 0.8 |
| NGC 4546 | 0.003502 | 8.9 | SB0-(s): | .LBS-*. | -3.0 | 19713 | 0.3150.008 | . . . | 10/03/2006 | 0.7 |
| NGC 4751 | 0.006985 | 9.7 | SA0-: | .LA.-*. | -3.0 | 34910 | 0.3390.008 | 1.480.13 | 10/03/2006 | 0.7 |
| NGC 4856 | 0.004513 | 9.0 | SB(s)0/a | .SBS0.. | 0.0 | 1604 | 0.2410.010 | . . . | 07/03/2006 | 0.8 |
| NGC 4958 | 0.004853 | 9.0 | SB0(r)? edge-on | .LBR./ | -2.0 | 1564 | 0.2640.004 | 1.430.22 | 08/03/2006 | 0.5 |
| NGC 5054 | 0.005807 | 9.8 | SA(s)bc | .SAS4.. | 4.0 | . . . | . . . | . . . | 10/03/2006 | 0.8 |
| IC 4214 | 0.007705 | 9.6 | (R’)SB(r)ab | PSBR2.. | 1.5 | 1735 | 0.2410.006 | 1.560.04 | 22/02/2002 | 0.8 |
| NGC 5101 | 0.006231 | 9.2 | (R)SB(rs)0/a | RSBT0.. | 0.0 | 20317 | 0.2970.020 | 0.990.35 | 07/03/2006 | 0.8 |
| NGC 5134 | 0.005861 | 10.5 | SA(s)b? | .SAS3. | 3.0 | 11910 | 0.2210.010 | 2.220.05 | 07/03/2006 | 0.8 |
| NGC 5507 | 0.006151 | 10.2 | SAB(r)00 | .LXR0.. | -2.3 | 1829 | 0.3420.017 | . . . | 20/02/2002 | 0.9 |
| NGC 5612 | 0.009003 | 9.8 | SAab: | .SA.2*. | 2.0 | . . . | . . . | . . . | 08/03/2006 | 0.7 |
| NGC 5806 | 0.004533 | 10.4 | SAB(s)b | .SXS3.. | 3.0 | . . . | . . . | . . . | 08/03/2006 | 0.5 |
-
Columns: (1) target name; (2) redshift from NED; (3) the -band magnitude from 2MASS in a 10 arcsec diameter aperture; (4) and (5) morphology and type from NED and RC3, respectively; (6) Hubble type from RC3; (7) velocity dispersion; (8) and (9) Lick Mg2 and H index, respectively; (10) observing date; and (11) average seeing during the observations.
| Galaxy | References for: | ||
| Mg2 | H | ||
| (1) | (2) | (3) | (4) |
| NGC 2380 | 7Sam, LCO-LO | 7Sam, LCO-LO | . . . |
| NGC 2502 | 51057, Be02, | 51057, CDB-93 | Be02, |
| CDB-93, CPWSM | CDB-93 | ||
| NGC 2613 | Bot89b, BRBH93 | . . . | . . . |
| NGC 2775 | S83, Ton84c, | JMA96a | . . . |
| WK, WM | |||
| NGC 2781 | OFJSB | Tr98a, WFG92a | Tr98a |
| NGC 2855 | WM | . . . | . . . |
| NGC 3056 | 51057 | 51057 | . . . |
| NGC 3637 | 51057 | 51057 | . . . |
| NGC 3810 | HSMP99, Vega01 | PMS01b | . . . |
| NGC 3892 | 51057 | 51057 | . . . |
| NGC 4179 | DS83, ENEARc7 | . . . | . . . |
| NGC 4546 | 51057, BGO91 | 51057 | . . . |
| NGC 4751 | 51057, Be02 | 51057 | Be02 |
| NGC 4856 | 51057 | 51057 | . . . |
| NGC 4958 | 51057, DBD93, | 51057, DBD93, | Tr98a |
| OFJSB | Tr98a | ||
| IC 4214 | 51057,iFC96 | 51057,iFC96 | IFC96 |
| NGC 5101 | IFC96, OFJSB | IFC96, Tr98a | IFC96, Tr98a |
| NGC 5134 | IFC96 | IFC96 | IFC96 |
| NGC 5507 | 51057 | 51057 | . . . |
-
References: 51057 - Wegner et al. (2003); 7Sam - Faber et al. (1989); Be02 - Beuing et al. (2002); BGO91 - Bettoni et al. (1991); CDB-93 - Carollo et al. (1993); DBD93 - De Souza et al. (1993); DS83 - Dressler & Sandage (1983); ENEARc7 - Bernardi et al. (2002); HSMP99 - Héraudeau et al. (1999); IFC96 - Idiart et al. (1996); JMA96a - Jablonka et al. (1996); LCO-LO - Davies et al. (1987); OFJSB - Dalle Ore et al. (1991); S83 - Schechter (1983); Ton84c - Tonry (1984); Tr98a - Trager et al. (1998); Vega01 - Vega Beltrán et al. (2001); WFG92a - Worthey et al. (1992); WK - Whitmore & Kirshner (1981); WM - Whitmore & Malumuth (1984).
Data reduction was performed using IRAF222IRAF is distributed by the National Optical Astronomy Observatories, which are operated by the Association of Universities for Research in Astronomy, Inc., under cooperative agreement with the National Science Foundation. and followed the procedure described in Hyvönen et al. (2009). The AB pairs of spectra were subtracted from each other to eliminate background sky emission and then divided by the flat-field images, constructed from incandescent lamp spectra. Bad pixels and cosmic rays were masked out. One-dimensional spectra were extracted from each individual image. Wavelength calibration was done using Xe-arc lamp calibration frames using the same continuum tracing as for the galaxy, and its zero point was checked against the OH sky lines. The galaxy spectra were divided by a G-type spectroscopic standard star and then averaged. The spectroscopic standards were selected to be as close to the target galaxies as possible. The nuclear (’nuc’, 1 arcsec diameter, corresponding to 1 kpc at the average distance of the galaxies) and off-nuclear extended emission spectra (’off1’ and ’off2’, from radii 0.5 to 2 arcsec at opposite sides of the nucleus, and covering an area of 1.5 arcsec2) were extracted for each target. Three or even more bin widths were added together to trace the extended emission. The -band spectra were normalized by fitting the continuum level to both sides of the absorption features. In the -band, the continuum was fitted only to the shortward wavelengths from the CO bandhead. The journal of observations of the sample is presented in Table 1.
The equivalent widths (EW) of the spectral lines were measured on the normalized spectra, integrating over the same passbands for all targets: =1.5870-1.5910 m for Sii, =1.6175-1.6220 m for CO(6-3), =2.2040-2.2107 m for Nai, =2.2577-2.2692 m for Cai, and =2.2924-2.2977 m for CO(2-0). The continuum at the line was defined by a straight line fitted to the continuum around the spectral feature. For purpose of a direct comparison, the same wavelength ranges were adopted as in Origlia et al. (1993) and Silva et al. (2008).
The accuracy of the EWs is limited by the uncertain continuum level in the vicinity of the particular line rather than the S/N of the spectra. This is especially true for the -band which is rich in spectral features, and for the CO(2-0) bandhead in the -band because the continuum level has to be extrapolated longward of 2.295 m. It is worth to keep in mind, that there are many blends and broad molecular features (Wallace & Hinkle 1996). Furthermore, the measured EWs of the indices are evidently upper limits due to spreading caused by velocity dispersion. The possible dependence of the EWs on velocity dispersion and resolution was checked by degrading the medium resolution stellar spectra from Wallace & Hinkle (1997) to the lower resolution applicable for the spiral galaxy sample, and measuring the indices of all the five diagnostic features for both resolutions. This comparison showed that the indices do not significantly depend on the degradation: all measurements agree within the errors. Therefore, the bandpasses are wide enough to fully encompass the measured features, despite the broadening due to the intrinsic velocity dispersion. We estimate our typical EW errors to be: 0.5 for the -band and for the -band metallic lines, and 1.0 for the -band CO(2-0) feature.
3 Results and discussion
The inactive spiral galaxies have strikingly similar NIR nuclear spectra as a function of their Hubble type, especially when compared to more active classes of objects. The main - and -band spectral absorption features from the stellar population – Mgi, Sii, CO(6-3), Nai, Cai, and CO(2-0) – are clearly visible. Their relative strengths are quite similar for all Hubble types. No H-band [Fe II] or K-band Br or H2 emission lines are evident at a significant level. However, weak H2 and/or Br emission was detectable in a few galaxies after subtracting an elliptical galaxy template representing the old stellar population. (see Section 3.5).


The -band nuclear spectra for the individual spiral galaxies in the sample are presented in Fig. 1. The EWs of all the diagnostic absorption lines were measured for all the spiral galaxies, and they are presented in Tables 3 and 4. The off-nuclear and nuclear EWs of the spirals are generally similar, and they are in broad agreement with the EW values from the literature (Mannucci et al. 2001; Bendo & Joseph 2004; Silva et al. 2008; Cesetti et al. 2009; Hyvönen et al. 2009), if differences in aperture sizes and index definitions are taken into account.
| Galaxy | T | Mgi | Sii | CO(6-3) | Mgi | ||||||||
| [m] | T | 1.575 | 1.589 | 1.619 | 1.711 | ||||||||
| nuc | off1 | off2 | nuc | off1 | off2 | nuc | off1 | off2 | nuc | off1 | off2 | ||
| (1) | (2) | (3) | (4) | (5) | (6) | (7) | (8) | (9) | (10) | (11) | (12) | (13) | (14) |
| Sc spirals (4 T 5) | |||||||||||||
| NGC 2090 | 5.0 | 3.7 | 3.5 | 3.4 | 3.5 | 3.8 | 4.2 | 5.5 | 5.0 | 6.0 | 3.9 | 3.1 | 3.5 |
| NGC 3715 | 4.0 | 3.5 | 3.4 | 3.3 | 4.0 | 3.3 | 3.3 | 4.8 | 5.3 | 4.6 | 3.0 | 3.3 | 3.2 |
| NGC 3810 | 5.0 | 3.4 | 3.0 | 3.3 | 3.5 | 3.8 | 3.8 | 5.3 | 5.0 | 5.2 | 3.3 | 3.3 | 3.2 |
| NGC 5054 | 4.0 | 2.7 | 2.9 | 2.7 | 3.1 | 3.2 | 3.5 | 5.4 | 6.6 | 6.6 | 4.0 | 3.8 | 3.1 |
| Sb spirals (2.0 T 4) | |||||||||||||
| NGC 2566 | 2.5 | 2.4 | 2.7 | 1.8 | 3.3 | 3.6 | 3.6 | 3.6 | 4.8 | 5.4 | 4.2 | 3.3 | 3.6 |
| NGC 2613 | 3.0 | … | … | … | 3.1 | 3.2 | 3.2 | 4.9 | 4.6 | 4.8 | 4.5 | 3.9 | 3.5 |
| NGC 2775 | 2.0 | … | … | … | 3.8 | 3.6 | 3.8 | 5.0 | 4.9 | 4.8 | 4.1 | 3.8 | 3.9 |
| NGC 2935 | 3.0 | 3.1 | 3.0 | 2.8 | 3.4 | 3.0 | 3.6 | 5.2 | 5.7 | 5.4 | 3.6 | 3.3 | 3.2 |
| NGC 5134 | 3.0 | 3.2 | 3.4 | 3.3 | 3.3 | 3.2 | 3.2 | 4.8 | 5.0 | 5.0 | 3.8 | 3.5 | 3.3 |
| NGC 5612 | 2.0 | 3.2 | 3.3 | 3.3 | 2.7 | 2.5 | 2.1 | 4.5 | 5.0 | 4.6 | 4.2 | 3.6 | 3.6 |
| NGC 5806 | 3.0 | 3.1 | 3.6 | 3.7 | 3.3 | 3.5 | 3.3 | 5.5 | 5.2 | 5.6 | 3.7 | 3.5 | 3.4 |
| Sa spirals (0.0 T 2.0) | |||||||||||||
| NGC 1617 | 1.0 | … | … | … | 3.5 | 3.4 | 3.4 | 5.2 | 5.3 | 5.1 | 3.4 | 3.4 | 3.4 |
| NGC 2196 | 1.0 | 3.0 | 3.1 | 3.3 | 3.5 | 2.8 | 3.0 | 5.2 | 5.5 | 4.6 | 2.9 | 2.6 | 2.5 |
| NGC 2855 | 0.0 | 3.2 | 3.6 | 3.6 | 2.6 | 3.4 | 3.5 | 4.3 | 4.4 | 4.6 | 2.9 | 3.1 | 3.2 |
| NGC 4856 | 0.0 | 3.1 | 3.1 | 3.1 | 3.4 | 3.5 | 3.4 | 5.0 | 4.8 | 5.1 | 3.8 | 3.8 | 3.5 |
| IC 4214 | 1.5 | 3.4 | 3.2 | 3.0 | 4.0 | 3.2 | 3.4 | 4.2 | 4.2 | 4.7 | 4.1 | 3.8 | 3.6 |
| NGC 5101 | 0.0 | 3.3 | 3.4 | 3.5 | 3.0 | 2.8 | 2.6 | 5.4 | 5.0 | 5.1 | 4.1 | 3.4 | 3.4 |
| Late S0 (-1.7 T 0.0) | |||||||||||||
| NGC 2380 | -1.7 | 4.1 | 3.8 | 3.8 | 3.6 | 3.2 | 3.2 | 4.9 | 4.6 | 5.0 | 3.4 | 3.2 | 3.1 |
| NGC 2781 | -1.0 | 3.8 | 3.6 | 3.6 | 3.9 | 3.4 | 3.5 | 5.0 | 4.4 | 4.8 | 3.3 | 3.5 | 3.6 |
| NGC 3056 | -1.0 | 2.4 | 2.7 | 2.4 | 3.3 | 3.2 | 3.2 | 4.9 | 4.6 | 4.6 | 3.4 | 3.4 | 3.4 |
| NGC 3892 | -1.0 | … | … | … | 3.6 | 3.6 | 3.7 | 5.5 | 5.4 | 5.5 | 3.7 | 3.5 | 3.4 |
| Intermediate S0 (-2.0 T -1.7) | |||||||||||||
| NGC 2502 | -2.0 | 3.0 | 3.0 | 3.0 | 3.3 | 3.1 | 2.9 | 5.4 | 4.8 | 4.9 | 3.2 | 3.8 | 3.3 |
| NGC 3637 | -2.0 | 3.3 | 3.3 | 3.4 | 3.5 | 3.8 | 4.0 | 5.0 | 4.8 | 5.4 | 4.0 | 3.1 | 3.2 |
| NGC 4179 | -2.0 | … | … | … | 3.1 | 3.0 | 3.1 | 5.1 | 4.8 | 4.8 | 3.4 | 3.4 | 3.3 |
| NGC 4958 | -2.0 | 2.6 | 2.6 | 2.5 | 3.3 | 3.2 | 3.4 | 5.4 | 5.1 | 5.4 | 3.7 | 3.7 | 3.7 |
| Early S0 (-3.0 T -2.0) | |||||||||||||
| NGC 2640 | -3.0 | 3.9 | 3.6 | 3.0 | 3.1 | 3.4 | 2.8 | 5.0 | 4.8 | 4.2 | 3.4 | 3.4 | 3.1 |
| NGC 4546 | -3.0 | 3.1 | 3.0 | 3.2 | 3.3 | 3.0 | 3.1 | 4.8 | 4.5 | 4.6 | 3.3 | 2.9 | 2.9 |
| NGC 4751 | -3.0 | 3.5 | 3.1 | 3.4 | 2.8 | 2.9 | 2.7 | 4.3 | 4.5 | 4.8 | 3.6 | 3.3 | 3.0 |
| NGC 5507 | -3.0 | … | … | … | 2.9 | 3.1 | 3.2 | 6.1 | 6.1 | 5.9 | 3.7 | 4.0 | 4.1 |
-
Column (1) gives the name of the spiral galaxy; (2) the luminosity class T; and (3) to (14) the EWs of the main diagnostic absorption lines in units of , in the nuclear 1.0 arcsec diameter aperture (nuc), and in the two off-nuclear apertures (off1 and off2).
| Galaxy | T | Br | Nai | Cai | CO(2-0) | ||||||||
| [m] | T | 2.166 | 2.207 | 2.263 | 2.295 | ||||||||
| nuc | off1 | off2 | nuc | off1 | off2 | nuc | off1 | off2 | nuc | off1 | off2 | ||
| (1) | (2) | (3) | (4) | (5) | (6) | (7) | (8) | (9) | (10) | (11) | (12) | (13) | (14) |
| Sc spirals (4 T 5) | |||||||||||||
| NGC 2090 | 5.0 | … | … | … | 2.0 | 2.6 | 3.0 | 3.1 | 2.7 | 2.6 | 14.9 | 15.4 | 14.8 |
| NGC 3715 | 4.0 | … | 0.6 | … | 3.1 | 3.4 | 3.2 | 3.7 | 3.7 | 3.7 | 15.3 | 15.8 | 17.4 |
| NGC 3810 | 5.0 | … | … | … | 2.6 | 2.4 | 3.0 | 1.7 | 2.7 | 3.5 | 15.9 | 13.7 | 14.5 |
| NGC 5054 | 4.0 | … | … | … | 3.9 | 3.7 | 3.8 | 3.6 | 3.4 | 2.7 | 15.2 | 15.5 | 16.1 |
| Sb spirals (2.0 T 4) | |||||||||||||
| NGC 2566 | 2.5 | 0.6 | 5.4 | 7.4 | 3.8 | 3.2 | 3.5 | 2.6 | 2.2 | 2.6 | 15.0 | 15.4 | 14.8 |
| NGC 2613 | 3.0 | … | … | … | 3.8 | 3.6 | 2.6 | 2.0 | 2.8 | 2.4 | 15.9 | 15.8 | 15.8 |
| NGC 2775 | 2.0 | … | … | 0.3 | 4.5 | 4.0 | 3.5 | 3.5 | 3.0 | 2.6 | 13.8 | 13.0 | 13.2 |
| NGC 2935 | 3.0 | … | 0.5 | 0.5 | 4.0 | 3.1 | 3.5 | 2.8 | 2.6 | 3.2 | 15.1 | 16.2 | 15.5 |
| NGC 5134 | 3.0 | … | … | … | 3.2 | 3.2 | 3.2 | 2.6 | 3.9 | 3.2 | 14.8 | 16.2 | 16.2 |
| NGC 5612 | 2.0 | … | … | … | 4.3 | 3.0 | 3.4 | 2.3 | 2.0 | 2.3 | 15.3 | 14.8 | 16.4 |
| NGC 5806 | 3.0 | … | … | 0.6 | 4.1 | 4.2 | 4.2 | 2.7 | 2.6 | 2.8 | 14.1 | 14.0 | 14.6 |
| Sa spirals (0.0 T 2.0) | |||||||||||||
| NGC 1617 | 1.0 | … | … | … | 3.0 | 2.9 | 3.3 | 2.8 | 2.6 | 2.8 | 15.7 | 15.8 | 13.8 |
| NGC 2196 | 1.0 | … | 0.4 | … | 3.3 | 3.2 | 2.5 | 3.8 | 3.4 | 3.2 | 15.8 | 14.2 | 15.5 |
| NGC 2855 | 0.0 | … | … | … | 2.5 | 3.8 | 3.2 | 2.7 | 2.8 | 2.4 | 12.5 | 14.0 | 14.2 |
| NGC 4856 | 0.0 | … | … | … | 3.5 | 3.3 | 3.6 | 2.6 | 3.1 | 2.2 | 16.9 | 16.6 | 15.2 |
| IC 4214 | 1.5 | 0.8 | 0.7 | 0.4 | 4.4 | 4.0 | 4.0 | 2.5 | 3.0 | 2.8 | 17.8 | 17.5 | 17.7 |
| NGC 5101 | 0.0 | … | … | … | 5.5 | 4.8 | 4.0 | 2.7 | 3.1 | 2.3 | 15.7 | 16.2 | 16.2 |
| Late S0 (-1.7 T 0.0) | |||||||||||||
| NGC 2380 | -1.7 | … | … | … | 5.2 | 5.4 | 4.0 | 2.9 | 3.0 | 3.1 | 16.3 | 15.5 | 16.6 |
| NGC 2781 | -1.0 | … | … | … | 4.8 | 4.2 | 2.6 | 2.6 | 3.6 | 3.6 | 14.6 | 16.4 | 16.5 |
| NGC 3056 | -1.0 | … | … | … | 2.4 | 2.8 | 2.5 | 1.6 | 2.8 | 3.4 | 13.0 | 13.2 | 15.3 |
| NGC 3892 | -1.0 | 0.3 | 0.7 | 3.2 | 3.4 | 3.2 | 3.0 | 2.8 | 3.0 | 2.6 | 15.1 | 14.7 | 13.6 |
| Intermediate S0 (-2.0 T -1.7) | |||||||||||||
| NGC 2502 | -2.0 | … | … | … | 4.2 | 3.4 | 3.4 | … | 2.0 | 2.6 | 9.2 | 15.0 | 14.5 |
| NGC 3637 | -2.0 | … | … | … | 3.5 | 3.2 | 3.5 | 3.2 | 2.0 | 2.4 | 15.1 | 15.8 | 15.4 |
| NGC 4179 | -2.0 | … | … | … | 5.5 | 5.1 | 3.6 | 3.8 | 3.8 | 3.2 | 15.5 | 15.0 | 14.9 |
| NGC 4958 | -2.0 | … | … | … | 4.2 | 4.0 | 3.2 | 3.5 | 3.3 | 2.9 | 13.9 | 14.8 | 15.0 |
| Early S0 (-3.0 T -2.0) | |||||||||||||
| NGC 2640 | -3.0 | … | … | … | 5.1 | 5.2 | 4.8 | 2.4 | 2.6 | 2.2 | 14.7 | 13.9 | 14.8 |
| NGC 4546 | -3.0 | … | … | … | 3.9 | 3.6 | 4.0 | 2.1 | 2.7 | 2.9 | 15.9 | 15.8 | 16.8 |
| NGC 4751 | -3.0 | … | … | … | 4.9 | 4.7 | 4.1 | 2.1 | 2.5 | 2.6 | 17.6 | 16.4 | 16.9 |
| NGC 5507 | -3.0 | … | … | … | 4.2 | 4.0 | 2.9 | 3.1 | 2.9 | 2.8 | 17.6 | 17.2 | 16.8 |
-
Column (1) gives the name of the spiral galaxy; (2) the luminosity class T; and (3) to (23) the EWs of the main diagnostic emission and absorption lines in units of , in the nuclear 1.0 arcsec diameter aperture (nuc), and in the two off-nuclear apertures (off1 and off2).
3.1 NIR line indices as stellar population indicators
The NIR spectroscopy is well-suited to study stellar populations in galaxies and star clusters because it contains many strong stellar absorption features tracing the presence of red stars, particularly red supergiants and giants. The -band has been widely studied (e.g., Merrill & Ridgway 1979; Kleinmann & Hall 1986; Wallace & Hinkle 1997, Ivanov et al. 2000), and it is a natural choice for studying reddened (dusty) galaxies at low redshift (e.g., Mobasher & James 2000; Mannucci et al. 2001). However, the dust emission that tends to dilute the stellar absorption has even smaller effect in the -band which has been studied systematically only recently (e.g., Origlia et al. 1993; Oliva et al. 1995; Ivanov et al. 2004; Fremaux et al. 2007). The -band remains relatively unexplored in galaxies (but see Wallace et al. 2000 for stars).
The integrated NIR light is dominated by different stars from those that contribute significantly at visible wavelengths: Whereas the integrated light at visible wavelengths comes from a mix of stellar types, the -band light in all but the youngest stellar systems is dominated by evolved giants and asymptotic giant branch (AGB) stars, whose photometric and spectroscopic properties are sensitive to age and metallicity (Maraston 2005).
The relative strengths of the NIR features can be used to characterize the stellar contents of the central regions of galaxies, and to provide insights into their history (e.g., Vazquez et al. 2003) because of their sensitivity to the spectral type (temperature) and/or luminosity (gravity) of the star (Kleinmann & Hall 1986; Ali et al., 1995; Ramirez et al. 1997; Ivanov et al. 2004). Ivanov (2001) discussed the possibility to develop NIR analog of the optical H vs. Mg2 diagnostic diagram used to derive ages and metallicities. To give an example for the utility of this diagnostic tool: while H vs. Mg2 can be used to constrain the properties of the host galaxies of optical supernovae (e.g, Hamuy et al. 2000), NIR diagnostic is needed to do the same for the host galaxies of obscured supernovae (e.g, Mannucci et al. 2003). Ivanov (2001) pointed that the optical H has an IR counterpart – Br at 2.167 m, and that there are a number of candidates to replace the Mg2, including some NIR Mg features.
The most evident absorption features in the -band are the molecular CO(2-0) bandhead (2.295 m), atomic Br (2.166 m), Nai (2.207 m), and Cai (2.263 m) lines. Br is the strongest absorption feature within stars earlier than K5, but disappears in stars later than K5 (Kleinmann & Hall 1986), while Nai is the strongest atomic feature when effective temperature is Teff3400 K (Ali et al. 1995). The -band has a very complex absorption line pattern due to a number of metallic and molecular lines, especially in cool late-type stars. The most studied -band features are atomic Sii (1.589 m) and molecular CO(6-3) (1.619 m) (e.g., Origlia et al. 1993). The CO is very strong in young giant and supergiant stars (10 Myr-100 Myr) and strong in cool AGB stars (100 Myr-1 Gyr; Oliva et al. 1995), while it is weaker in older population. This makes it suitable to trace recent star formation in galaxies (Mayya 1997). There are also some relatively weak Mgi features (e.g. 1.504, 1.710 m) that potentially could provide a direct comparison with the optical element abundances, but they are rather demanding in terms of the quality of the observations (Cesetti et al. 2009). The Nai, Cai and CO features in K and M stars become stronger with lower temperature, i.e. redder colour (Ramirez et al. 1997; Förster Schreiber 2000; Frogel et al. 2001). At a given , giants in more metal rich clusters have stronger Nai and Cai features (Frogel et al. 2001). Some line ratios, such as EW(CO 1.62)/EW(Sii 1.59) and EW(CO 1.62)/EW(CO 2.29), are even better temperature indicators than single lines (Origlia et al. 1993; Ivanov et al. 2004), especially if the two lines have very similar wavelengths making their ratio insensitive to dilution from dust or hot stars. Last but not least. most of these features suffer some degree of contamination from other elements, much like in the optical (e.g., Worthey et al. 1994).
Currently, there are few self-consistent theoretical spectral synthesis models for the interpretation of NIR spectra of galaxies (although see e.g. Leitherer et al. 1999; Bendo & Joseph 2004; Maraston 2005; Riffel et al. 2008). Thus, one has to rely on e.g. their comparison with high-resolution NIR stellar spectral atlases (e.g., Wallace & Hinkle 1996) or on direct comparison with optical indices (e.g. Silva et al. 2008, Cesetti et al. 2009).
3.2 NIR-to-optical and NIR-to-NIR line index relations of spiral galaxies
The optical Mg2, Fe, and H indices show tight correlations with the central velocity dispersion (e.g. Bernardi et al. 1998; Mehlert et al. 2003), suggesting that the chemical and dynamical evolution of galaxies are intertwined. For the galaxies in our sample, the relation with is well established for Mg2 but it suffers from somewhat more scatter for the Fe5270. None of the NIR features show as clear a relation with as the Mg2. The best Mg2 analog in the NIR appears to be Nai at 2.207 m which shows approximately the same scatter with as the Fe5270. We also find that the Nai at 2.207 m feature shows a fair direct correlation with Mg2 despite the possible combined production of Na in both low and high mass stars, which sets it apart from Mg, which is produced only in massive stars.
3.3 Dilution of the NIR line indices of spiral galaxies

Non-stellar thermal sources, such as dust surrounding young star forming regions, and/or non-thermal dilution reduce the intrinsic values of EWs originating from the stellar population. However, the dust observed in NIR is close to its sublimation temperature, and in such cases HII emission line series are expected to be observed. The comparison of absorption indices in different filters depends on the level of dilution by the non-stellar component that can be different in - and -band. The dilution fraction of the continuum emission at 1.6 m and 2.3 m can be estimated from the plots of EW(CO 1.62) vs. EW(CO 1.62)/EW(Si 1.59), and EW(CO 1.62) vs. EW(CO 1.62)/EW(CO 2.29), shown in Fig. 2, top panels. Objects with diluted stellar features lie away from the loci occupied by stars, along the dilution vectors, and the fraction of non-stellar continuum is simply given by the displacement of the point in the diagram (e.g., for dilution from non-thermal emission in AGN see Fig. 3 in Ivanov et al. 2000). Fig. 2 shows that in the - and -band, all spirals have either no or only slight dilution. This indicates that no significant amount of dust is present in the nuclear region of spirals.
Fig. 2, bottom left panel, shows the EW(Nai+Cai) as a function of EW(CO 2.29) for the nuclear spirals, and for elliptical galaxies (from Hyvönen et al. 2009), together with stars of different spectral type. Caution should be exercised when comparing stellar and galactic data, as galaxies are composite stellar systems and their spectra show the integrated contributions from stars spanning a range of properties. Still, given that the NIR spectral region is dominated by evolved (RGB) stars, this issue is not as critical as at visible wavelengths, where stars contribute over a much larger range of evolutionary states (both RGB and main sequence stars (e.g., Maraston 2005). All three luminosity classes of stars have a relatively tight linear correlation between EW(Nai+Cai) and EW(CO 2.29). Most of the off-nuclear spirals are in good agreement with the relation of giant (III) stars, while ellipticals deviate more strongly from that relation. As expected, for spirals in most cases the main role is played by class III giant stars, possibly with some contribution from class V dwarf stars.
On the other hand, the plot of EW(CO 2.29) vs. EW(CO 1.62)/EW(Si 1.59) (Fig. 2, bottom right panel) indicates that the stellar populations are mostly dominated by a mixture of giants (III) and supergiants (I). However, it is very likely that the CO(1.62) line is underestimated and/or the Sii line overestimated decreasing the line ratio of EW(Sii)/EW(CO 1.62) and thus, in both cases, shifting the real data points to the left in Fig. 2, bottom right panel. The Sii line is slightly overestimated, because it is contaminated, mainly by CO, due to the intrinsic velocity dispersion of the galaxies, together with the medium-resolution of our spectra. In conclusion, the majority of spirals are closer to giants and supergiants than the ellipticals, demonstrating the difference in their stellar populations.
Almost all spirals and ellipticals have EW(CO 2.29) 15 which is larger than the EW of K giants (from 10 to 15 ) or main sequence stars. In fact, the only stars with EW of CO(2.29) higher than 15 are M giants and K and M supergiants. The stellar population of these galaxies must therefore be dominated by very cool stars, probably M giants, to match the measured EWs. Note, however, that since M stars are much brighter in the -band than K stars, this does not imply that M giants are the only significant luminosity-weighted population.
The EWs of CO 2.29 m and Cai of the spiral and elliptical galaxies are plotted against EW(Nai ) in Fig. 3. Majority of the spirals and ellipticals occupy a locus which is consistent with the relation of purely old galaxies (Silva et al. 2008). They also have larger Nai indices than those of solar metallicity cluster stars, consistent with early-type galaxies in the Fornax cluster (Silva et al. 2008). Unlike the sample of Cesetti et al. (2009), our spirals and ellipticals do not show a significant correlation between EW(Cai) and EW(Nai), probably due to the smaller abundance range. We also note that Ca and Na are produced by both high and low mass stars (e.g. Denisenkov & Ivanov 1987; Denissenkov 2005; Langer et al. 1993; Cavallo et al. 1996), so that yields and chemical enrichment history may be relevant.

Different star formation histories within a galaxy may set up a radial stellar population gradient, which can be seen as a difference in line strengths and EWs of absorption lines between nuclear and off-nuclear spectra. In non-active galaxies, EWs usually increase toward the bulge where they remain roughly constant. In the sample considered here, only a few galaxies show any indication of systematic radial variation in the strength of the lines between off-nuclear and nuclear spectra. While these could be due to a stellar population gradient, deeper and higher spatial resolution spectra are needed to confirm the possible gradient.
3.4 Template spectra
The spectra of the inactive spiral galaxies indicate that the NIR emission from these objects is dominated by old red stars that dominate the central bulges of these galaxies. By combining each individual redshift-corrected spectra together, we can create composite quiescent spectra for each Hubble type. These composite spectra can then be treated as templates representing an old red stellar component in the spectra of galaxies where either continuum emission from an AGN, hot dust, emission lines from young stars, or supernovae are present. These spectra therefore find applications as template spectra for the underlying galaxy which can be subtracted from the spectra of composite stellar systems (e.g. AGN host galaxies).
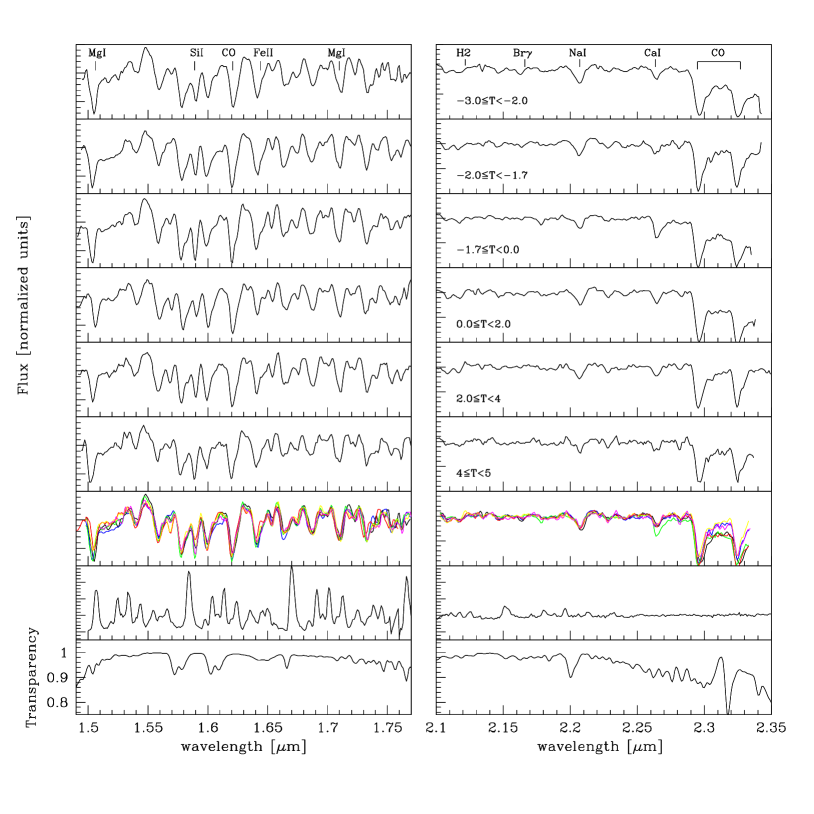
To construct the quiescent template spectra, we divided the sample into six groups according to their Hubble type. We first redshift-corrected all the spectra to the rest frame. Next, we resampled the spectra using splines, normalized the spectra and averaged them using the same method used to normalize and combine the spectra for individual galaxies. The resulting composite quiescent spectra, with the most prominent metal absorption lines and the CO band heads identified, are presented in Fig. 4, where we also show the sky emission and the sky transmission spectra, to give the reader an idea of the reliability of the template spectra.
The differences between the spectra of the galaxies of the same class are due both to observational uncertainties and to intrinsic differences between the observed galaxies. Mannucci et al. (2001) and Bendo & Joseph (2004) found inactive galaxies to show a high degree of uniformity, which we confirm with our higher spatial resolution data.
Fig. 5 shows the average EWs of the main absorption lines as a function of the Hubble type T. We find a slight trend for the EWs of Sii 1.589 m and CO 1.619 m to increase, and the EW of Nai 2.207 m to decrease, with increasing T, but the trends are not statistically significant.

3.5 Spiral galaxies with nuclear and off-nuclear emission lines
The nuclear NIR spectra of three galaxies (all Sb spirals) in our sample (NGC 2566, NGC 2935 and NGC 5612) exhibit the H2 2.122 m emission line. NGC 2935 is an interesting case with red nuclear colour, indicating possible nuclear activity. However, the strength of its absorption lines closely matches the quiescent composite spectra derived above. This implies that any recent star formation activity (or obscured AGN activity) lies deeply buried within an older population of evolved stars.
Weak emission from Br, the strongest hydrogen recombination line in the -bands, was detectable in eight sample galaxies. Although ionized gas may be present, the negligible recombination line flux in the majority of the sample implies relatively few young stars, and therefore relatively little recent star formation activity. Of the eight galaxies with detectable Br, five are classified in RC3 as Sb spirals or later types (T 2), and none are earlier than late S0 galaxies (T -2). This agrees well with earlier results presented in Mannucci et al. (2001) and Bendo & Joseph (2004), and supports the paradigm that the relative strength of star formation increases along the Hubble sequence, probably reflecting the change along the Hubble sequence in the relative dominance of bulge stars to the - and -band emission.
Galaxies IC 4214, NGC 2196, NGC 2775, NGC 3715, NGC 3892 and NGC 5806 exhibit Br line but nondetectable H2 line. The recombination line indicates that young ionizing stars are present, but the lack of shock excitation lines suggests that the stellar population has not evolved to a point where supernovae are generating shocks in the interstellar medium. Therefore, using Starburst99 models (Leitherer et al. 1999), the stellar population must be less than 3.5 Myr old. On the other hand, NGC 5612 exhibits H2 line from shock excitation but very weak or nonexistent Br emission. The absence of strong recombination lines indicates that they have at least evolved past 8 Myr. If the shock excitation lines are interpreted as originating from supernovae, then we conclude that the stellar populations in these galaxies are in the 8 - 36 Myr age range.
4 Conclusions
We have presented medium resolution NIR -band spectra of a sizable sample of low redshift inactive spiral galaxies, to study their stellar populations along the Hubble sequence, based on the diagnostic stellar absorption lines. Our main results are: (i) the EWs of the Sii, CO(1.62) Nai, Cai and CO(2.29) features in the spirals are most consistent with those of giant stars, whereas ellipticals (from literature) show a contribution from main sequence dwarf stars, and on average, EW(CO2.29) of spirals is somewhat greater than that of ellipticals. Most likely, the EWs are not significantly affected by non-stellar dilution. (ii) Overall, evolved red stars completely dominate the NIR spectra, while contribution from hot young stars is virtually nonexistent. (iii) We produce high spatial resolution NIR -band template spectra for spirals along the Hubble sequence, that will form a baseline for comparison to galaxies with more exotic star formation or AGN activity.
Acknowledgments
We thank the anonymous referee for constructive comments and suggestions. We acknowledge financial support from the Academy of Finland, projects 8201017, 8107775 and 2600021611 (JK, TH) and 2600021711 (JR). This research has made use of the NASA/IPAC Extragalactic Database (NED), which is operated by the Jet Propulsion Laboratory, California Institute of Technology, under contract with the National Aeronautics and Space Administration. We are grateful for the ESO staff for their support during the observations.
References
- [Ali et al.(1995)Ali, Carr, DePoy, Frogel, & Sellgren] Ali, B., Carr, J., DePoy, D., Frogel, J., & Sellgren, K. 1995, AJ, 110, 2415
- [Alonso-Herrero et al. (2000)] Alonso-Herrero,A., Rieke,M.J., Rieke,G.H., Shields,J.C., 2000, ApJ 530, 688
- [Bendo & Joseph(2004)] Bendo, G. & Joseph, R. 2004, AJ, 127, 3338
- [Bernardi et al. 1998] Bernardi, M., Renzini, A., da Costa, L. N., et al. 1998, ApJ, 508, L143
- [Bernardi et al. 2002] Bernardi, M., Alonso, M.V., da Costa, L.N., et al. 2002, AJ, 123, 2990
- [Bettoni et al.(1991)Bettoni Galletta & Oosterloo] Bettoni, D., Galletta, G., & Oosterloo, T. 1991, MNRAS,248, 544
- [Beuing et al.(2002)Beuing et al.] Beuing, J., Bender, R., Mendes de Oliveira, C., Thomas, D., & Maraston, C. 2002, A&A, 395, 431
- [Burston et al.(2001)Burston et al.] Burston,A.J., Ward,M.J., Davies,R.I., 2001, MNRAS 326, 403
- [Carollo et al.(1993)Carollo, Danziger & Buson] Carollo, C.M., Danziger, I.J., & Buson, L. 1993, MNRAS, 265, 553
- [Cavallo et al.(1996)Cavallo et al.] Cavallo, R. M., Sweigart, A. V., & Bell, R. A. 1996, ApJ, 464, L79
- [Cesetti et al.(2009)Cesetti, Ivanov, Morelli, Pizzella, Buson, Corsini, Dalla Bonta, Stiavelli, & Bertola] Cesetti, M., Ivanov, V., Morelli, L., et al. 2009, A&A, 497, 41
- [Coziol et al.(2001)Coziol et al.] Coziol,R., Doyon,R., Demers,S., 2001, MNRAS 325, 1081
- [Dalle Ore et al.(1991)Dalle Ore et al.] Dalle Ore, C., Faber, S.M., Jesus, J., Stoughton, R., & Burstein, D. 1991, ApJ, 366, 38
- [Dannerbauer et al. (2005)] Dannerbauer,H., Rigopoulou,D., Lutz,D. et al., 2005, A&A 441, 999
- [Davies et al.(1987)Davies et al.] Davies, R.L., Burstein, D., Dressler, A., et al. 1987, ApJS, 64, 581
- [de Souza et al.(1993)de Souza, Barbuy, & Dos Anjos] de Souza, R.E., Barbuy, B., & Dos Anjos, S. 1993, AJ, 105, 1737
- [Dressler & Sandage(1983)] Dressler, A., & Sandage, A. 1983, ApJ, 265, 664
- [Denisenkov & Ivanov(1987)] Denisenkov, P. A., & Ivanov, V. V. 1987, Soviet Astron. Lett., 13, 214
- [Denissenkov (2005)] Denissenkov, P. A. 2005, ApJ, 622, 1058
- [Engelbracht et al. (1998)] Engelbracht, C.W., Rieke, M.J., Rieke, G.H., Kelly, D.M., & Achtermann, J.M. 1998, ApJ, 505, 639
- [Faber et al.(1989)Faber et al.] Faber, S.M., Wegner, G., Burstein, D.,et al. 1989, ApJS, 69, 763
- [Fremaux et al.(2007)Fremaux, Pelat, Boisson, & Joly] Fremaux, J., Pelat, D., Boisson, C., & Joly, M. 2007, A&A, 473, 377
- [Frogel et al.(2001)Frogel, Stephens, Ramírez, & DePoy] Frogel, J. A., Stephens, A., Ramírez, S., & DePoy, D. L. 2001, AJ, 122, 1896
- [Förster Schreiber(2000)] Förster Schreiber, N. M. 2000, AJ, 120, 377
- [Goldader et al.(1997)] Goldader,J.D., Joseph,R.D., Doyon,R., Sanders,D.B., 1997, ApJ 474, 104
- [Golev & Prugniel(1998)] Golev, V., & Prugniel, Ph., 1998, A&A, 132, 255
- [Hamuy et al.(2000)] Hamuy, M., Trager, S.C., Pinto, P.A. et al. 2000, AJ, 120, 1479
- [Héraudeau et al.(1999Héraudeau] Héraudeau, Ph., Simien, F., Maubon, G., & Prugniel, Ph. 1999, A&AS, 136, 509
- [Hyvönen et al.(2009Hyvönen, Kotilainen, Reunanen & Falomo] Hyvönen, T., Kotilainen, J., Reunanen,J., Falomo, R.. 2009, A&A, 499, 417
- [Idiart et al.(1996)Idiart, de Freitas Pacheco & Costa] Idiart, T.P., de Freitas Pacheco, J.A., & Costa, R.D.D. 1996, AJ, 112, 2541
- [Ivanov et al.(2000)Ivanov et al.] Ivanov,V.D., Rieke, G.H., Groppi, C.E. et al. 2000, ApJ, 545, 190
- [Ivanov et al.(2004)Ivanov et al.] Ivanov,V.D., Rieke, M.J., Engelbracht, C.W. et al. 2004, ApJS, 151, 387
- [Jablonka et al.(1996)Jablonka, Martin & Arimoto] Jablonka, P., Martin, P., & Arimoto, N. 1996, AJ, 112, 1415
- [Kleinmann & Hall(1986)] Kleinmann, S. & Hall, D. 1986, ApJS, 62, 501
- [Lançon et al.(1999)Lançon et al.] Lançon,A., Mouhcine,M., Fioc,M., Silva,D., 1999, A&A 344, L21
- [Langer et al.(1993)Langer et al.] Langer, G. E., Hoffman, R., & Sneden, C. 1993, PASP, 105, 301
- [Larkin et al.(1998)Larkin et al.] Larkin,J.E., Armus,L., Knop,R.A., Soifer,B.T., & Matthews,K., 1998, ApJS 114, 59
- [Leitherer et al.(1999)Leitherer et al.] Leitherer,C., Schaerer,D., Goldader,J.D., et al, 1999, ApJS, 123, 3
- [Mannucci et al.(2001)Mannucci, Basile, Poggianti, Cimatti, Daddi, Pozetti, & Vanzi] Mannucci, F., Basile, F., Poggianti, B., et al. 2001, MNRAS, 326, 745
- [Mannucci et al.(2003)Mannucci et al.] Mannucci, F., Maiolino, R., Cresci, G., et al. 2003, A&A, 401, 519
- [Maraston(2005)] Maraston, C. 2005, MNRAS, 362, 799
- [Mayya(1997)] Mayya, Y. 1997, ApJ, 482, L149
- [Mehlert et al. 2003] Mehlert, D., Thomas, D., Saglia, R. P., Bender, R., Wegner, G. 2003, A&A, 407, 423
- [Merrill & Ridgway(1979)] Merrill, K. & Ridgway, S. 1979, ARA&A, 17, 9
- [Mobasher & James(2000)] Mobasher, B. & James, P. 2000, MNRAS, 316, 507
- [Moorwood et al.(1998)Moorwood et al.] Moorwood, A., Cuby,J.G., Lidman,C., 1998, The Messenger 91, 9
- [Oliva et al.(1995)Oliva, Origlia, Kotilainen, & Moorwood] Oliva, E., Origlia, L., Kotilainen, J., & Moorwood, A. 1995, A&A, 301, 55
- [Origlia et al.(1993)Origlia, Moorwood, & Oliva] Origlia, L., Moorwood, A., & Oliva, E. 1993, A&A, 280, 536
- [Paturel et al.(2003)Paturel et al.] Paturel, G., Petit, C., Prugniel, Ph., et al. 2003, A&A, 412, 45
- [Ramirez et al.(1997)Ramirez, DePoy, Frogel, Sellgren, & Blum] Ramirez, S., DePoy, D., Frogel, J., Sellgren, K., & Blum, R. 1997, AJ, 113, 1411
- [Reunanen et al.(2002)Reunanen et al.] Reunanen,J., Kotilainen,J.K., Prieto,M.A., 2002, MNRAS 331, 154
- [Reunanen et al.(2003)Reunanen et al.] Reunanen,J., Kotilainen,J.K., Prieto,M.A., 2003, MNRAS 343, 192
- [Reunanen et al.(2007)Reunanen et al.] Reunanen, J., Tacconi-Garman, L.E. & Ivanov, V.D. 2007, MNRAS, 382, 951
- [Riffel et al.(2008)Riffel et al.] Riffel,R., Pastoriza,M.G., Rodriguez-Ardila,A., Maraston,C., 2008, MNRAS 388, 803
- [Riffel et al.(2009)Riffel et al.] Riffel,R., Pastoriza,M.G., Rodriguez-Ardila,A., Bonatto,C. 2009, MNRAS 400, 273
- [Schechter (1983)Schechter] Schechter, P.L. 1983, ApJS, 52, 425
- [Silva et al.(2008)Silva, Kuntschner, & Lyubenova] Silva, D. R., Kuntschner, H., & Lyubenova, M. 2008, ApJ, 674, 194
- [Tonry (1984)Tonry] Tonry, J. 1984, unpublished
- [Trager et al.(1998)Trager et al.] Trager, S.C., Worthey, G., Faber, S.M., Burstein, D., Gonzalez, J.J. 1998, ApJS, 116, 1
- [Vanzi & Rieke (1997)Vanzi & Rieke] Vanzi, L., & Rieke, G.H. 1997, ApJ, 479, 694
- [Vázquez et al.(2003)Vázquez, Carigi, & González] Vázquez, G. A., Carigi, L., & González, J. J. 2003, A&A, 400, 31
- [Vega Beltrán et al.(2001)Vega Beltrán et al.] Vega Beltrán, J.C., Pizzella, A., Corsini, E.M., et al. 2001, A&A 374, 394
- [Wallace & Hinkle(1996)] Wallace, L. & Hinkle, K. 1996, ApJS, 107, 312
- [Wallace & Hinkle(1997)] Wallace, L. & Hinkle, K. 1997, ApJS, 111, 445
- [Wallace et al.(2000)] Wallace, L., Meyer, M.R., Hinkle, K., & Edwards, S. 2000, ApJ, 535, 325
- [Wegner et al.(2003)] Wegner, G., Bernardi, M., Willmer, C.N.A., et al. 2003, AJ, 126, 2268
- [Whitmore, & Kirshner(1981)] Whitmore, B.C., & Kirshner, R.P. 1981, ApJ, 250, 43
- [Whitmore, & Malumuth(1984)] Whitmore, B.C., & Malumuth, E. 1984, unpublished
- [Worthey (1994)] Worthey, G. 1994, ApJS, 95, 107
- [Worthey et al.(1992) Worthey, Faber, & Gonzalez] Worthey, G., Faber, S.M., & Gonzalez, J.J. 1992, ApJ, 398, 69
- [Worthey et al.(1994) Worthey, Faber, Gonzalez, & Burstein] Worthey, G., Faber, S. M., Gonzalez, J. J., & Burstein, D. 1994, ApJS, 94, 687
- [Worthey & Ottaviani(1997)] Worthey, G. & Ottaviani, D. 1997, ApJS, 111, 377