A peculiar galaxy appears at redshift 11: properties of a moderate redshift interloper††thanks: Based on observations made with ESO Telescopes at the Paranal Observatory under programme ID 087.A-0118
Abstract
Laporte et al. (2011) reported a very high redshift galaxy candidate: a lensed band dropout (A2667-J1). J1 has a photometric redshift of , the probability density function for which permits no low or intermediate solution. We here report new spectroscopic observations of this galaxy with VLT/XShooter, which show clear [Oiii]Å, Ly, H, and H emission and place the galaxy firmly at . The oxygen lines contribute only % to the band flux, and do not significantly affect the dropout selection of J1. After correcting the broadband fluxes for line emission, we identify two roughly equally plausible natures for A2667-J1: either it is young heavily reddened starburst, or a maximally old system with a very pronounced 4000Å break, upon which a minor secondary burst of star formation is superimposed. Fits show that to make a detection of this object in the band (band), imaging of depth AB=30.2 (29.5) would be required – despite the relatively bright NIR magnitude, we would need optical data of equivalent depth to the Hubble Ultra Deep Field to rule out the mid- solution on purely photometric grounds. Assuming that this stellar population can be scaled to the NIR magnitudes of recent HST/WFC3 IR-selected galaxies, we conclude that infeasibly deep optical data AB would be required for the same level of security. There is a population of galaxies at with continuum colours alone that mimic those of our candidates.
keywords:
galaxies: evolution — galaxies: high-redshift — galaxies: individual: A2667-J1 — galaxies: star formation1 Introduction
Broadband imaging in the near infrared (NIR) has enabled the detection of candidate galaxies at redshifts between and 12, using both recent survey instruments on the Hubble Space Telescope (McLure et al., 2010; Finkelstein et al., 2010; Bouwens et al., 2011b; Trenti et al., 2011; Yan et al., 2011) and wider–but–shallower observations from the ground (E.g. Ouchi et al. 2009; Capak et al. 2011, Pelló et al in prep). With specific astrophysics in mind, these catalogues may be used to infer the cosmic history of star formation, the photon budget available for reionization, and also as an independent test of the re-ionization edge through the prevalence of the Hi Ly emission line (Pentericci et al., 2011; Schenker et al., 2012; Curtis-Lake et al., 2012).
It is vital, therefore, to understand the lower- objects that could contaminate such samples, and the frequency with which they do. At the highest , contamination rates have been estimated using population synthesis methods (Trenti et al., 2011; Bouwens et al., 2011b), and shown to be non-negligible. Empirical studies at have also found a population of galaxies with emission lines strong enough to mimic a strong spectral break, suggesting roughly similar contamination levels (Atek et al., 2011). Yet the empirical interloper rate, measured directly by deep spectroscopy in the samples, remains broadly unknown.
To these ends our group has been carrying out its own multi-wavelength studies, taking advantage of gravitational lensing to search for intrinsically fainter background objects (Laporte et al., 2011, L11) Originally, L11 selected ten lensed galaxies that satisfy criteria for , , and dropout galaxies. With deep optical, near-infrared and Spitzer/IRAC photometry, traditional photometric redshift (phot-) methods placed all galaxies in the range . However two of the L11 sources were found to lie at (Boone et al., 2011), hinting that strong optical lines may have mimicked a Lyman break. In cases where very deep optical imaging is available, this source of contamination is thought to be small, as the line strengths imply lowish masses/metallicities that in turn should exhibit blue continuum colours and remain detectable, particularly when stacked. However other sources of contamination exist, specifically relating to dust attenuation and strong 4000Å breaks: in both of these cases an intrinsically red spectrum in the restframe UV and optical may cause a galaxy to go undetected in all bandpasses bluer than the first dropout band.
In this Letter we present the optical and NIR spectrum of a bright band dropout galaxy (A2667-J1) – phot-, no low- solution and no Herschel detection – obtained with VLT/XShooter. In L11 we were skeptical about the very high- interpretation because of the large implied luminosity, and the detection of a faint source in HST/ imaging (although the colour still exceeds magnitudes). However the spectrum shows several strong emission lines that are consistent only with , implying it is an interloper. In Sect. 2 we present the new observations and measurements of emission lines. In Sect. 3 we discuss inferences we can draw from the emission lines, and explanations for the strong spectral break and selection function, and re-model the stellar continuum. In Sect. 4 we discuss the implications that this galaxy may have upon other very high- surveys. All magnitudes are AB.
2 Observations and Measurements
2.1 X-Shooter observations
A2667-J1 (=23:51:34.9, =–26:3:32.7, J2000) was observed with X-Shooter (D’Odorico et al., 2006; Vernet et al., 2011), mounted at UT2 of ESO/VLT, on the night of 24 August 2011. The total integration time was short, but at s was sufficient to find several strong emission lines. We used the 1″ (0.9″) slit for the UVB channel (VIS and NIR), providing an almost constant aperture between the and bands. More importantly the NIR spectral resolution of is sufficient to resolve the atmospheric OH airglow lines. Between each observation, the object was dithered along the slit by 2.5 ″. The average atmospheric seeing was 0.76 ″. Data were reduced and combined using the EsoRex X-Shooter pipeline version 1.3.7, and one dimensional spectra were extracted from the frames using the apall task in noao/iraf with an aperture width of 1.5 ″.
2.2 Emission lines in the spectrum
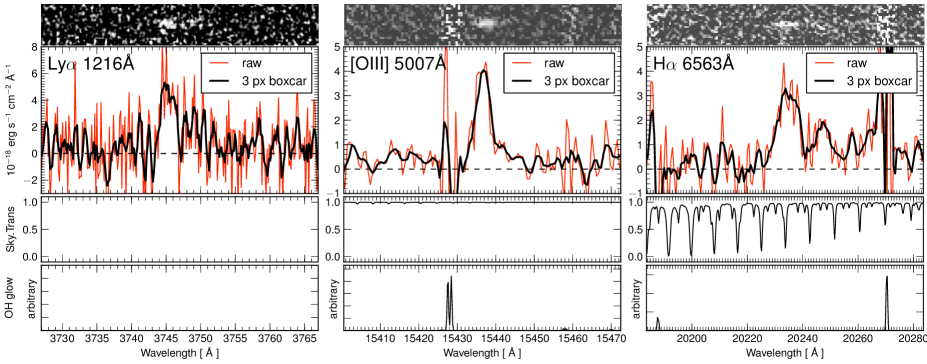
We clearly identified a strong emission line at wavelength Å (Fig. 1) – after masking regions contaminated by a nearby airglow line and fitting a Gaussian profile, we measure a flux of erg s-1 cm-2. The band magnitude is (L11), and assuming the quoted bandpass parameters (µm, FWHM=2890Å), we compute an observer frame equivalent width, , of Å. The wavelength of the observed emission line falls close to the peak transmission so no filter wing corrections are necessary.
This high restricts the possible line identifications - after testing various possibilities, we determine it to be [Oiii]Å and also identify Ly, H, and H. This places the redshift of J1 firmly at . After the removal of a nearby OH line [Oiii]Å is also visible but no HeiiÅ, [Nii]6548,6584, or [Oii]3726,3729Å are visible in either the 1D or 2D spectra. Example spectra are shown in Fig. 1, and the measured line fluxes (or limits) are listed in Table 1.
| Species | Flux | |||
|---|---|---|---|---|
| Å | Å | erg s-1 cm-2 | ||
| Hi Ly | 1215.67 | 3743.0 | 2.079 | |
| Heii | 1640.42 | … | … | |
| [Oii] | 3727.09 | … | … | |
| [Oii] | 3728.79 | … | … | |
| Hi H | 4862.72 | 14998.2 | 2.084 | |
| [Oiii] | 4960.30 | 15288.2 | 2.082 | |
| [Oiii] | 5008.24 | 15436.6 | 2.082 | |
| Hi H | 6564.61 | 20234.6 | 2.082 | |
| [Nii] | 6583.46 | 20290.2 | … |
3 What is A2667-J1?
3.1 Basic inferences from the nebular lines
We first discuss a few line ratios. Both H and H can be measured, although the significance of H is low . The H/H ratio is , consistent with the unobscured value of 2.86 ( K), which corresponds to (, Calzetti et al. 2000). Assuming no obscuration, the star formation rate (SFR) inferred from H is yr-1 (Kennicutt 1998, corrected for a magnification), which is towards the lower end of the envelope of Hayes et al. (2010b) for H-selected galaxies. At the upper limit of dust attenuation the intrinsic SFR will be a factor of 5 higher. Regarding Ly, assuming pure recombination under case B and the permitted range of , Ly escape fractions falls in the range 1–5%, again close to the average (Hayes et al., 2010a).
Neither side of the [Oii] doublet is detected ( erg s-1 cm-2), despite the region being free of both telluric and airglow features. This allows us to put a reasonable limit on the excitation parameter, [=[Oiii]/([Oiii]+[Oii])] of , which is not greatly affected by the range of permitted dust contents. is known to correlate strongly with the ionization parameter, and the hardness of the ionizing spectrum (therefore the temperature of the stellar population, E.g. Pilyugin 2001), and the spectrum suggests that the stellar population of A2667-J1 is still hot enough to keep all the oxygen doubly ionized. We may also calculate the index [([Oii]+[Oiii])/H] which is not particularly high at ; the high value of , the low , and the absence of a clear [Nii] lines surrounding H suggest that we are looking at a relatively low metallicity burst of star formation. From the N2 index, metallicity (, Pettini & Pagel 2004), which would place J1 roughly midway through the distribution of Erb et al. (2006) at . While J1 is very compact, the [Oiii]/H ratio and [Nii]/H limit are fully consistent with a nebula produced by star-formation, not an active nucleus (Kauffmann et al., 2003).
3.2 Line contribution and colour selection
A2667-J1 met the selection criteria for a galaxy in [ vs. ] colour space defined in L11 and optimized for the removal of stars and lower galaxies. It is important to note that every survey has its own combination of wavelength coverage and depth, and therefore the selection criteria will naturally differ. Indeed most comparable studies are based upon HST data, and consequently include no band criteria for their band dropouts. Details aside, it is well known that [Oiii] and H lines may have high enough to dominate broadband fluxes (E.g. Schaerer & de Barros, 2009; Trump et al., 2011) causing mid- galaxies to interlope into very high- samples (Atek et al., 2011). A vital question, therefore, is whether J1 was selected because of this. Combined [Oiii]+H provide Å, and these lines contribute just 25% to the band flux ( Å). If we subtract this nebular contribution, the colour of the spectral break changes from the measured value of magnitudes to , and still easily clears the dropout criterion of . After subtracting H from the band we recompute the colour as 0.50, only slightly redder than the 0.44 measured in L11 and still on the border of the selection box. Therefore even without the strong nebular lines we would still have selected J1 as a very high- candidate.
There is the need to explain a spectral discontinuity with amplitude in between the and bands (restframe 5250 and 4080 Å), and amplitude between (restframe 3310 Å) and . This could result from either heavy dust obscuration or a strong 4000Å break – the former seems inconsistent with H/H, while the latter seems inconsistent with even the presence of strong emission lines.
3.3 (Re-) Modeling the stellar population
Before modeling, we take advantage of new Spitzer data reduction methods and re-perform the IRAC photometry using the latest pipeline processed data. The high-level science data from the Lensing Cluster GTO Survey (Program 83, PI. Rieke) were re-obtained, and photometry performed in 1 arcsec circular apertures paying special attention to the sky properties (level, noise, skewness) in nearby empty apertures. In Table 2 we present updated stellar (i.e. line-subtracted) VLT photometry, updated IRAC photometry, and the original HST photometry from L11. We note that in the optical and NIR colours, A2667-J1 appears rather similar to the unusual infrared object HDFN-JD1 (Dickinson et al., 2000), although it is 0.7 magnitudes bluer in – the nature of that source also remains unclear.
| Telescope | obs | rest | magnitude |
|---|---|---|---|
| & bandpass | [ µm ] | [ µm ] | [ AB ] |
| VLT/FORS2/I | 0.791 | 0.257 | 111as reported in L11 |
| HST/ACS/F850LP | 0.911 | 0.296 | |
| VLT/FORS2/z | 0.914 | 0.297 | |
| VLT/HAWKI/Y | 1.03 | 0.334 | |
| VLT/HAWKI/J | 1.26 | 0.409 | |
| VLT/HAWKI/H | 1.62 | 0.526 | 222emission line subtracted |
| VLT/HAWKI/Ks | 2.15 | 0.698 | |
| Spitzer/IRAC/Ch1 | 3.58 | 1.16 | 333photometry modified from L11 |
| Spitzer/IRAC/Ch2 | 4.53 | 1.47 | |
| Spitzer/IRAC/Ch3 | 5.78 | 1.88 | |
| Spitzer/IRAC/Ch4 | 8.05 | 2.61 |
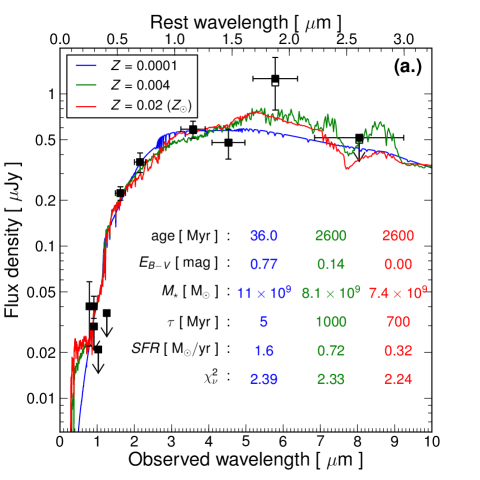
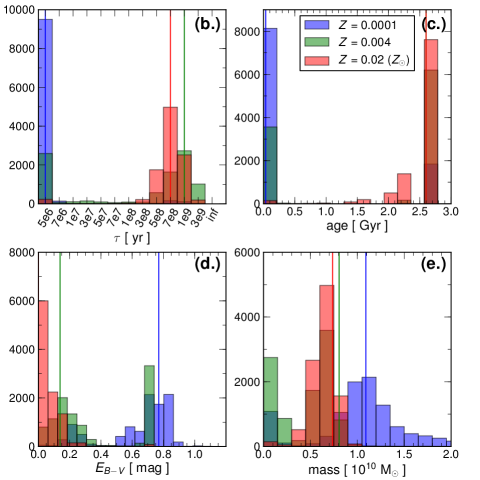
With new stellar (i.e. line-corrected) photometry, we model the stellar population with Hyper-z (Bolzonella et al., 2000), using the CB2007 modification of the Bruzual & Charlot (2003) population synthesis models to generate evolutionary templates. We adopt a Salpeter IMF, lock the redshift , and fit dust attenuation, star formation history (SFH), and time since the onset of star formation. The range of included SFHs include exponentially decaying SFRs with -folding timescales as listed in the abscissa of Fig 2, panel (b). For comparative purposes we perform fits at three different metallicities: , 0.004, and 0.02. We show the results in the left panel of Fig. 2, with histograms of Monte Carlo realizations in the right panel.
Firstly we note that for the three different metallicities, the values of that describe the best fit are effectively consistent, and we do not have the power to distinguish between them. Metallicity does however modulate the frequency with which other results are obtained, and there are two different and entirely degenerate ways of reproducing the break: either with a large dust content or an old population with a strong 4000Å break. The latter scenario would imply a dual stellar population: one evolved enough for a strong break, the other young enough to produce the emission lines. As usual a strong 4000Å break is more frequently seen at higher metallicities, where stellar evolution runs faster. Indeed models at extremely low prefer the young dusty solution in % of cases, models at seem to be rather evenly split between the young/dusty vs. old solutions, and the models almost exclusively prefer ages above 2 Gyr and little dust. The models are rejected by three arguments: (i.) the necessary attenuation is higher than permitted from H/H (Sect 3.1), while usually nebular exceeds that of the stars (Calzetti et al., 2000); (ii.) such metallicities should produce higher [Oiii]/H; and (iii.) a dusty metal-poor galaxy seems an unlikely combination. However the models all seem permissible, and we do not have the information to formally distinguish between the two scenarios.
We note that in the case of the composite population, the recent burst must also have a stellar population that has not been subtracted from the photometry prior to fitting. Indeed its contribution to the band flux is not permitted to be large, otherwise the break would be diminished. To investigate this we take the restframe H EW (280Å) and compute the range of ages at which this EW is exceeded: the star-forming population must have an age below Myr (Leitherer et al., 1999, Starburst99). Over this age range we then compute the range of permitted magnitudes and without reddening the population will remain completely undetected in for ages below 2 Myr. However the H EW is independent of reddening while the colour is not; the limit of allows up to a factor of 3 greater attenuation at than at and ages up to 4 Myr still predict a band non-detection. On the other hand, a rather blue continuum may explain the HST detection. For this range in parameter space, the burst contributes between 0.4 and 4 % of the total stellar mass.
Although the IRAC channels show the largest errors, the 5.8µm channel carries a residual of . We note that the higher metallicity stars show the strongest 1.6µm stellar feature, which is probably the cause of the marginal preference for these models. However the IRAC points also contain the Paschen and Brackett lines, for which we also make a first order attempt to correct (assuming K gas). Since the nebular extinction is not well constrained, we make two corrections, one derived for =0 and the other for =0.5. These modified points are shown in Fig 2 and the largest correction (where Pa falls in 5.8µm) amounts to just 0.06 magnitudes - consequently the corrections in channels 1 and 2 are not visible. We do not re-perform the SED fit, but note that this correction does just bring the channel 3 data point to about of the fit.
Finally we examine the phot- solutions that are allowed by the new line-free photometry, and we repeat the fits with the redshift free. The peak at is still recovered but now represents the tertiary solution. The primary solution lies at which is actually in good agreement with the secondary peak from L11 (), and the secondary grouping prefers . However, more interestingly, only 0.2% of the realizations have phot- within of the spectroscopically measured value, and it is not easy to obtain a good SED fit at the measured redshift when the templates comprise only single stellar populations. This lends support to the scenario of multiple populations, and the hypothesis that the and NIR detections do not see the same stars.
4 Implications for high-z surveys
A2667-J1 can be described in two ways, but regardless of the true population, one salient fact remains: was photometrically selected as a candidate, but actually lies at .
Because of our homogeneous coverage across the NIR, J1 was selected in two colour space: () and (). The selection, therefore, is more similar to lower methods (e.g. and dropouts) and somewhat different from other drop searches (Henry et al., 2007; Bouwens et al., 2011a), which lack comparably deep band data and therefore employ a one-colour selection. The requirement of (a blue UV slope) is specifically intended to fortify the selection against the inclusion of mid- galaxies with strong optical breaks, but a galaxy is precisely what we have found. On the other hand, a non-detection in bandpasses bluewards of the break is also required by typical surveys to reject lower- galaxies and, while J1 is undetected in ground-based , , and imaging, it is detected in HST (albeit with a colour similar to the dropout criterion). For J1, imaging bluer than the band would be effectively useless in evaluating its status as an interloper: from the best-fitting SEDs and Monte Carlo simulations described in Sect. 3.3, we calculate that in the HST F435W and F606W ( and ) we would need to reach depths of AB=30.2 and 29.5 in order to detect the continuum. In other words, this relatively bright detected drop would need imaging with the depth of the Hubble Ultra Deep Field (Beckwith et al., 2006) to be rejected as very high-. A magnitude galaxy of these colours in the HUDF or CANDELS surveys would still remain undetected by in the available HST band imaging, and require imaging reaching in order to detect the bluer continuum. It currently remains unclear how abundant galaxies of this type are, and thus systematic campaigns of spectroscopic followup will remain a vital pursuit, even at the faintest magnitudes.
Acknowledgments
This work received support from Agence Nationale de la recherche bearing the reference ANR-09-BLAN-0234-01. D.S. acknowledges support from the Swiss National Science Foundation.
References
- Atek et al. (2011) Atek H. et al., 2011, ApJ, 743, 121
- Beckwith et al. (2006) Beckwith S. V. W. et al., 2006, AJ, 132, 1729
- Bolzonella et al. (2000) Bolzonella M., Miralles J.-M., Pelló R., 2000, A&A, 363, 476
- Boone et al. (2011) Boone F. et al., 2011, A&A, 534, A124
- Bouwens et al. (2011a) Bouwens R. J. et al., 2011a, Nature, 469, 504
- Bouwens et al. (2011b) Bouwens R. J. et al., 2011b, ApJ, 737, 90
- Bruzual & Charlot (2003) Bruzual G., Charlot S., 2003, MNRAS, 344, 1000
- Calzetti et al. (2000) Calzetti D., Armus L., Bohlin R. C., Kinney A. L., Koornneef J., Storchi-Bergmann T., 2000, ApJ, 533, 682
- Capak et al. (2011) Capak P. et al., 2011, ApJ, 730, 68
- Curtis-Lake et al. (2012) Curtis-Lake E. et al., 2012, MNRAS, 422, 1425
- Dickinson et al. (2000) Dickinson M. et al., 2000, ApJ, 531, 624
- D’Odorico et al. (2006) D’Odorico S. et al., 2006, in Society of Photo-Optical Instrumentation Engineers (SPIE) Conference Series, Vol. 6269, Society of Photo-Optical Instrumentation Engineers (SPIE) Conference Series
- Erb et al. (2006) Erb D. K., Shapley A. E., Pettini M., Steidel C. C., Reddy N. A., Adelberger K. L., 2006, ApJ, 644, 813
- Finkelstein et al. (2010) Finkelstein S. L., Papovich C., Giavalisco M., Reddy N. A., Ferguson H. C., Koekemoer A. M., Dickinson M., 2010, ApJ, 719, 1250
- Hayes et al. (2010a) Hayes M. et al., 2010a, Nature, 464, 562
- Hayes et al. (2010b) Hayes M., Schaerer D., Östlin G., 2010b, A&A, 509, L5
- Henry et al. (2007) Henry A. L., Malkan M. A., Colbert J. W., Siana B., Teplitz H. I., McCarthy P., Yan L., 2007, ApJL, 656, L1
- Kauffmann et al. (2003) Kauffmann G. et al., 2003, MNRAS, 346, 1055
- Kennicutt (1998) Kennicutt, Jr. R. C., 1998, ARA&A, 36, 189
- Laporte et al. (2011) Laporte N. et al., 2011, A&A, 531, A74
- Leitherer et al. (1999) Leitherer C. et al., 1999, ApJS, 123, 3
- McLure et al. (2010) McLure R. J., Dunlop J. S., Cirasuolo M., Koekemoer A. M., Sabbi E., Stark D. P., Targett T. A., Ellis R. S., 2010, MNRAS, 403, 960
- Ouchi et al. (2009) Ouchi M. et al., 2009, ApJ, 706, 1136
- Pentericci et al. (2011) Pentericci L. et al., 2011, ApJ, 743, 132
- Pettini & Pagel (2004) Pettini M., Pagel B. E. J., 2004, MNRAS, 348, L59
- Pilyugin (2001) Pilyugin L. S., 2001, A&A, 369, 594
- Schaerer & de Barros (2009) Schaerer D., de Barros S., 2009, A&A, 502, 423
- Schenker et al. (2012) Schenker M. A., Stark D. P., Ellis R. S., Robertson B. E., Dunlop J. S., McLure R. J., Kneib J.-P., Richard J., 2012, ApJ, 744, 179
- Trenti et al. (2011) Trenti M. et al., 2011, ApJL, 727, L39
- Trump et al. (2011) Trump J. R. et al., 2011, ApJ, 743, 144
- Vernet et al. (2011) Vernet J. et al., 2011, A&A, 536, A105
- Yan et al. (2011) Yan H. et al., 2011, ApJL, 728, L22