The Submm and mm Excess of the SMC:
Magnetic Dipole Emission
from Magnetic Nanoparticles?
Abstract
The Small Magellanic Cloud (SMC) has surprisingly strong submm and mm-wavelength emission that is inconsistent with standard dust models, including those with emission from spinning dust. Here we show that the emission from the SMC may be understood if the interstellar dust mixture includes magnetic nanoparticles, emitting magnetic dipole radiation resulting from thermal fluctuations in the magnetization. The magnetic grains can be metallic iron, magnetite Fe3O4, or maghemite -Fe2O3. The required mass of iron is consistent with elemental abundance constraints. The magnetic dipole emission is predicted to be polarized orthogonally to the normal electric dipole radiation if the nanoparticles are inclusions in larger grains. We speculate that other low-metallicity galaxies may also have a large fraction of the interstellar Fe in magnetic materials.
1 Introduction
Low-metallicity dwarf galaxies often exhibit surprisingly strong emission at submillimeter and mm wavelengths (e.g., Galliano et al. 2003, 2005; Galametz et al. 2009; Grossi et al. 2010; O’Halloran et al. 2010; Galametz et al. 2011), substantially exceeding what is expected based on the observed emission from dust at shorter wavelengths. This “submm excess” could in principle be due to a large mass of cold dust, but in some cases the implied dust masses are too large to be consistent with the observed gas mass and metallicity.
The Small Magellanic Cloud (SMC) is a prime example of this phenomenon. The dust spectral energy distribution (SED) has been measured from near-infrared through cm wavelengths. Both Bot et al. (2010) and Planck Collaboration et al. (2011b) conclude that conventional dust models cannot account for the observed 3 mm – (100 GHz – 500 GHz) emission without invoking unphysically large amounts of very cold dust.
Large submm excesses have also been reported for other low-metallicity dwarf galaxies. NGC 1705 has received particular attention (Galametz et al. 2009; O’Halloran et al. 2010; Galametz et al. 2011) and substantial excesses have also been reported for a number of other systems, including Haro 11, II Zw 40, and NGC 7674 (Galametz et al. 2011).
This excess emission challenges our understanding of interstellar dust. If the submm excess in low-metallicity dwarfs is due to thermal emission from dust, these galaxies either contain surprisingly large masses of very cold dust, or the dust opacity at submm frequencies must substantially exceed that of the dust in normal-metallicity galaxies, such as the Milky Way.
In the Galactic ISM, typically 90% or more of the Fe is missing from the gas phase (Jenkins 2009), locked up in solid grains. Thus Fe accounts for of the dust mass in diffuse interstellar regions, although as yet we know little about the nature of the Fe-containing material. Interstellar dust models based on amorphous silicate and carbonaceous material (e.g., Mathis et al. 1977; Draine & Lee 1984; Weingartner & Draine 2001; Zubko et al. 2004; Draine & Li 2007; Draine & Fraisse 2009) often posit that the Fe missing from the gas is incorporated in amorphous silicate material, but it is entirely possible for much or most of the solid-phase Fe to be in the form of metallic Fe or certain Fe oxides, such as magnetite, that are spontaneously magnetized.
Draine & Lazarian (1999, hereafter DL99) noted that ferromagnetic or ferrimagnetic materials can have large opacities at microwave frequencies. Draine & Hensley (2012) recently re-estimated the absorption cross sections for nanoparticles of ferromagnetic or ferrimagnetic materials. They considered three naturally-occuring magnetic materials – metallic iron, magnetite, and maghemite – and found that the magnetic response implies a large opacity at submm and mm wavelengths.
In this Letter we propose that magnetic nanoparticles may provide the 100–500 opacity needed to account for the strong submm–microwave emission from the SMC. Upper limits on dust masses in the SMC are obtained in Section 2. The observed SED of the SMC, and the emission attributed to dust, is reviewed in Section 3, and in Section 4 we show that models with Milky Way dust opacities cannot reproduce the observed SED. The contribution of spinning dust is discussed in Section 5, where we show that spinning dust cannot account for the observed emission near . In Section 6 we consider dust models for the SMC that include maghemite, magnetite, and metallic iron grains. We find that the submm and mm excess in the SMC can be accounted for by a population of magnetic nanoparticles.
In Section 7 we discuss other evidence for the formation of Fe or Fe-oxide nanoparticles, and speculate on why the dust in low-metallicity galaxies such as the SMC differs from the dust in normal metallicity spirals, such as the Galaxy. We also discuss the predicted polarization of the emission from the SMC. Our results are summarized in Section 8.
2 Mass of the ISM in the SMC
At a distance (Szewczyk et al. 2009), the Small Magellanic Cloud (SMC) provides an opportunity to study the dust in a low-metallicity dwarf galaxy. The present study will concentrate on the radius () region (centered on , ) studied by Planck Collaboration et al. (2011b). The 21 line flux from this region at SMC radial velocities is (mean line intensity over the aperture; J.-P. Bernard 2012, private communication) corresponding to optically-thin emission from . Stanimirovic et al. (1999) estimated that correction for self-absorption would raise the H I mass by (for ). Thus we estimate in the region. Leroy et al. (2007) find . Thus we take (not including He) within the aperture.
Elemental abundances in the SMC are uncertain. Russell & Dopita (1992) estimated , while Kurt & Dufour (1998) estimated . Rolleston et al. (2003) measured the abundances in a main-sequence B star, and found , and . Lee et al. (2005) measured abundances in 3 B-type supergiants in the SMC wing, finding , . Here we adopt an overall metallicity .
An upper limit on the dust mass in the SMC is obtained from the observed gas mass combined with the estimated abundances of elements that could form dust grains. The gas in diffuse H I and in the local interstellar medium is routinely strongly depleted in elements such as Fe and Si, with the missing material presumed to be in the form of dust. An inventory of the well-studied sightline toward Oph allows one to estimate the dust/gas mass ratio based on the amount of C, O, Mg, Si, Fe, and other elements that are missing from the gas (Draine 2011, Table 23.1).111The sightline toward Oph is ice-free. We assume that ices are a negligible fraction of the total dust mass in the SMC. If we assume the relative abundances of heavy elements in a galaxy to be similar to solar composition (Asplund et al. 2009), then
| (1) | |||||
| (2) |
where is the mass of Fe contained in solid material, including ferromagnesian silicates, Fe oxides, and metallic Fe. The mass of Fe in magnetic materials obviously is limited by . The resulting upper limits on and Fe in magnetic form are given in the first line of Table 1.
| Total Dust | Magnetic Fe | ||
| () | () | comment | |
| Abundance limit | 10.7 | 2.3 | |
| Model 1: DL07 dust, | 13. | – | violates abundance limit; poor fit |
| Model 2: DL07 dust, | 9.7 | – | very poor fit |
| Model 3: DL07 dust + Fe | 8.3 | 1.4 | OK |
| Model 4: DL07 dust + Fe | 10.2 | 2.2 | OK |
| Model 5: DL07 dust + -Fe2O3 | 9.4 | 2.2 | OK |
| Model 6: DL07 dust + Fe3O4 | 7.2 | 2.2 | OK |
| Fe mass in magnetic material | |||
| for and | |||
| Fe particles | |||
| DL07 dust with cold component | |||
| Fe particles | |||
3 SED of the SMC
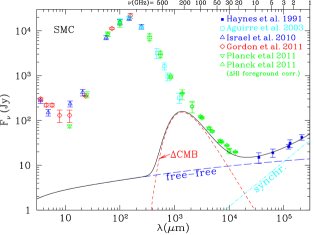
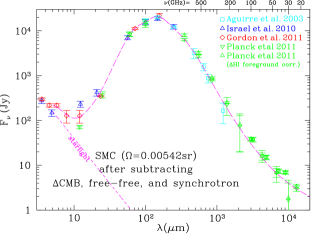
Figure 1 shows the observed global SED of the SMC, after removal of smooth foregrounds and backgrounds, from the following compilations:
Haynes et al. (1991) reported global flux densities measured with the Parkes 64m telescope at 1.4, 2.45 GHz, 4.75, and 8.55GHz; the 1.4 GHz flux density is a revision of the result of Loiseau et al. (1987). Mountfort et al. (1987) measured the 2.3 GHz flux density with the Hartebeesthoeck 26m telescope.
The TopHat balloon experiment (Aguirre et al. 2003) measured the flux in 4 bands (245–630) in a radius region () centered on the SMC. Foreground removal was done by subtracting the mean brightness of adjacent off-source regions. Aguirre et al. (2003) also extracted 100, 140, and 240 fluxes for COBE-DIRBE (Silverberg et al. 1993).
Israel et al. (2010) extracted fluxes for a radius region () centered on the SMC. We show their extractions for the 10 COBE-DIRBE bands (1.27 to 248).
Gordon et al. (2011) extracted fluxes for a radius region () centered on the SMC, measured using the IRAC (Fazio et al. 2004) and MIPS (Rieke et al. 2004) cameras on the Spitzer Space Telescope (Werner et al. 2004). Foreground removal consisted of subtracting the mean brightness of an annulus extending from to .
Planck Collaboration et al. (2011b) extracted fluxes for a radius region () centered on the SMC. Foreground subtraction consisted of subtracting the mean brightness of a annulus around the extraction region. We include their extractions for Planck (9 bands, 30–858 GHz Planck Collaboration et al. 2011a), WMAP (5 bands, 23–94 GHz Bennett et al. 2003), and IRAS (4 bands, 12–100; Miville-Deschênes & Lagache 2005). Planck Collaboration et al. (2011b) further corrected the foreground removal by taking into consideration the difference in H I at Galactic radial velocities between the background annulus and the extraction aperture.222 We do not show the “corrected” Planck fluxes for IRAS12 and IRAS25 because the entries for in Table 2 of Planck Collaboration et al. (2011b) do not appear to be correct.
Figure 1a shows the spectrum of the region centered on the SMC. We assume that the differences in coverage ( ranging from to ) are unimportant, as most of the flux will come from the central regions. Planck Collaboration et al. (2011b) estimate that CMB fluctuations add emission corresponding to a mean CMB temperature excess over the extraction region (relative to the background annulus). The spectrum of this CMB excess
| (3) |
is plotted in Figure 1a.
To isolate the emission from the dust, it is necessary to subtract free-free and synchrotron emission. We find the observations to be consistent with synchrotron and free-free spectra
| (4) | |||||
| (5) |
with . Our estimate for is intermediate between the estimate of Israel et al. (2010) and the estimate of Planck Collaboration et al. (2011b). Our estimates for and are shown in Figure 1a. The Gaunt factor is obtained from eq. (10.9) of Draine (2011). For and , this corresponds to and an H photoionization rate .
The residual after subtraction of , , and is shown in Figure 1b. This residual is presumed to be emission from dust and (at short wavelengths) stars. A smooth curve has been drawn through the points to guide the eye. Subtracting an estimate for the starlight continuum as in Figure 1b, the integrated dust luminosity of the SMC is .
4 Conventional Dust Models
The observed infrared and submm emission from normal-metallicity star-forming spiral galaxies appears to be consistent with physical dust models that were developed to reproduce the observed properties of dust in the diffuse ISM of the local Milky Way, including wavelength-dependent extinction and infrared emission (e.g., Weingartner & Draine 2001; Li & Draine 2001; Zubko et al. 2004; Draine & Li 2007; Draine & Fraisse 2009; Compiegne et al. 2010). The models of Draine & Li (2007, henceforth DL07) consist of amorphous silicate grains plus carbonaceous grains; the carbonaceous grains have the physical properties of graphite when large, and the properties of polycyclic aromatic hydrocarbons (PAHs) when very small. This dust model was able to reproduce the global SEDs of the galaxies in the SINGS sample (Draine et al. 2007), including 17 galaxies with 850 SCUBA photometry. More recently, the same model has been found to be consistent with both global and spatially-resolved SEDs of normal-metallicity (i.e., ) galaxies in the KINGFISH sample (Aniano et al. 2012a, b), including photometry out to 500.
The DL07 dust model is able to reproduce the observed emission from dust in the diffuse ISM of the Galaxy (Finkbeiner et al. 1999) out to wavelengths as long as (see Fig. 14a of Draine & Li 2007). However, a significant emission excess (relative to the model) appears at (); this “anomalous microwave emission” (AME) has been confirmed by numerous observations (Planck Collaboration et al. 2011c, and references therein). The AME in the Galaxy is thought to be mainly rotational emission from the PAH population (Draine & Lazarian 1998a, b).
DL07 propose that the SEDs of entire galaxies, or large regions within a galaxy, can be fit using a dust model consisting of amorphous silicates, graphitic grains, and PAHs, and assuming that the dust heating rate is distributed according to
| (6) |
where is the ratio of the local dust heating rate to the heating rate produced by the solar-neighborhood starlight radiation field, is the mass of amorphous silicate plus carbonaceous dust with heating rates , and is the total dust mass. Eq. (6) is a very simple distribution function, with only 5 parameters (, , , , ), but studies of dust emission using this distribution function for the grain heating have been successful in reproducing the global emission from galaxies, as well as the emission from 500 pc regions within galaxies (e.g., Aniano et al. 2012a). The DL07 models are also characterized by the PAH abundance parameter the fraction of the dust mass contributed by PAH particles containing C atoms.
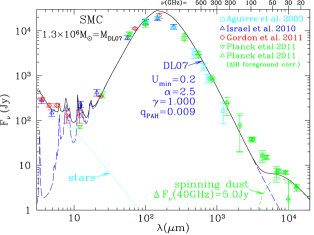
We vary 5 parameters – the total dust mass , the PAH abundance parameter , and the starlight heating parameters , , and ; is kept fixed. Because we do not include a realistic model for the starlight contribution to the SED, the model is fit only to data at , where reddening by dust should be minimal. Because the emission at () may include a substantial contribution from “spinning dust”, the DL07 model + starlight is fit only to data.
If we allow to be as low as , we obtain Model 1, shown in Figure 2. This model has a total dust mass , exceeding the upper limit of (see Table 1). Despite using more dust than is allowed, Model 1 provides insufficient emission at .
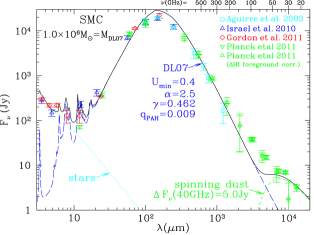
Because Model 1 violates the dust abundance limit, we try fitting the DL07 model to the same data, but now limiting . The resulting Model 2 has a total dust mass that does not violate the upper limit in Table 1, but the quality of the fit to the SED is somewhat worse than for Model 1, with an even larger deficiency at (see Fig. 2b).
5 Spinning Dust
We can add a spinning dust component to raise the emission in the 20–60 range. The spinning dust emission in the diffuse ISM of the Galaxy peaks at about 40 GHz; we expect a similar peak frequency in the SMC. What level of emission is expected for spinning dust in the SMC?
Draine & Lazarian (1998a, b) argued that the anomalous microwave emission in the Galaxy, with an observed emissivity per H nucleon , is primarily rotational emisssion from the PAH population. The PAH abundance is measured by . Dust in the solar neighborhood is thought to have . Li & Draine (2002) found that in the SMC was spatially variable and, on average, much lower than in the Milky Way. Sandstrom et al. (2010) confirmed this, finding a mean . We expect the dust/gas ratio in the SMC to be lower by about a factor . Therefore the PAH abundance per H is down by about a factor . Thus we estimate the spinning dust emission in the SMC to be
| (7) | |||||
| (8) |
In Figure 2 we have added an emission component with a spectrum333This simple form, adequate for the present purposes, approximates the spectra obtained by detailed calculations (e.g., Draine & Lazarian 1998b; Ali-Haïmoud et al. 2009; Hoang et al. 2010, 2011; Silsbee et al. 2011; Ysard et al. 2011).
| (9) |
representative of what is expected for spinning dust. If we set and – consistent with the estimate in Eq. (8) – the 20–50 observations are accounted for, as seen in Figure 2.
While spinning dust appears able to account for the observed 20–50 emission, the emission between 50 and 300 remains much stronger than expected. Bot et al. (2010) suggest that the 50–300 excess could also be due to spinning dust emission. However, theoretical models of rotational emission from small grains (Draine & Lazarian 1998b; Ali-Haïmoud et al. 2009; Hoang et al. 2010, 2011; Silsbee et al. 2011) predict little rotational emission above unless high densities and warm gas temperatures are present in the emitting regions. For example, Draine & Lazarian (1998b, see Fig. 13) calculated the spinning dust emission from a model PDR with , , illuminated by a radiation field . The PDR was assumed to have abundances of small grains relative to big grains reduced by a factor of 5 relative to diffuse clouds in the solar neighborhood, approximating the observed reduction in in the SMC. Viewed face-on, the total IR luminosity/area . The spinning dust emission for this model peaked near , with . Thus .
At , the model in Figure 2b has a deficit , corresponding to . To account for this would require PDRs with a luminosity – completely inconsistent with the observed . It is evident that spinning dust cannot account for the observed 50–200 GHz emission in the SMC. Here we consider magnetic dust grains as an alternative.
6 SMC Dust Models Including Magnetic Dust
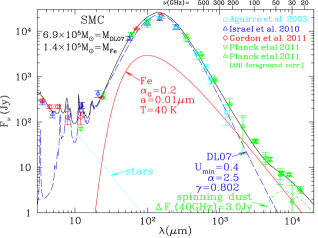
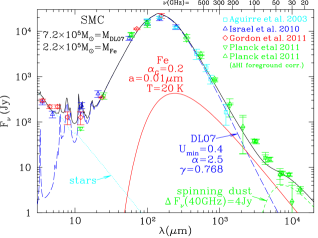
Because magnetic materials have enhanced absorption at microwave and submm frequencies, it is of interest to see whether the mm- and cm-excess seen in the SMC could be due in part to thermal emission from magnetic grain materials. In Figures 3 and 4 we model the observed emission from the SMC as the sum of three components: “normal” dust (the amorphous silicate, graphite, and PAH model of DL07), a population of magnetic grains, and spinning dust. In each case, the spinning dust contribution is assumed to peak at 40, with the peak flux density adjusted to fit the observations in Figure 1a, giving a reasonably good fit in the region.
Metallic iron nanoparticles are introduced in Fig. 3. We consider Fe grain temperatures of 40 (Fig. 3a) and 20 (Fig. 3b). If the Fe nanoparticles are, for the most part, free-fliers heated by typical starlight, then is expected (see Fig. 4 of Draine & Hensley 2012). If, on the other hand, the Fe nanoparticles are inclusions in larger composite grains, then the temperature is appropriate, consistent with the temperature of the “normal” dust. In each case, the Fe grain abundance is adjusted to reproduce most of the observed emission near , then a model using DL07 dust is used to provide the additional emission required to reproduce the observed SED at shorter wavelengths, and finally a spinning dust component peaking at 40 GHz is added to bring the model into agreement with the 20–50 GHz observations.
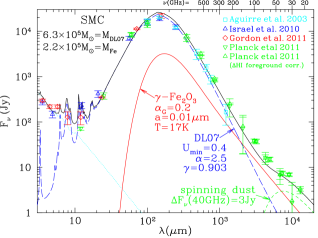
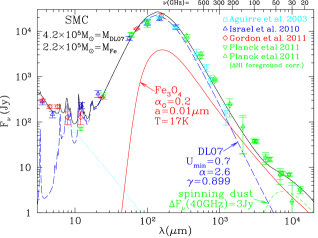
We also consider nanoparticles of maghemite (Fig. 4a) and magnetite (Fig. 4b). For these we assumed temperatures consistent with being inclusions within nonmagnetic dust grains.
The model with maghemite (Fig. 4a) has of Fe in maghemite (total maghemite mass ) and the model with magnetite (Fig. 4b) has of Fe in magnetite (total magnetite mass ). The Fe mass, and total dust mass, does not violate the mass budget (see Table 1). We conclude that the observed mm-wave emission from the SMC can be accounted for by models with reasonable abundances of normal dust plus metallic Fe, maghemite, magnetite, or some combination of these three materials.
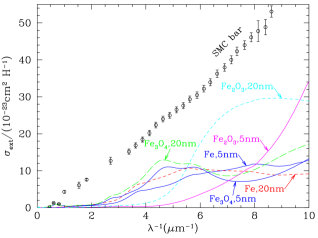
If the nanoparticles are present as inclusions in larger grains, it is clear that the size distribution of the larger particles can be adjusted to be compatible with the observed wavelength-dependent extinction in the SMC. But is it possible for the bulk of the interstellar Fe to be in free-flying nanoparticles? We have calculated the extinction contribution in the optical and UV, assuming that 100% of the Fe is in particles of a single type, and using dielectric functions for Fe, Fe3O4, and -Fe2O3 from Draine & Hensley (2012). Figure 5 shows the calculated extinction per H, together with the observed extinction in the SMC Bar (Gordon et al. 2003). In no case does the calculated extinction/H exceed the observed extinction. Therefore, the observed extinction is not incompatible with the possibility that much of the Fe is in free-flying nanoparticles.
Nevertheless, we consider it most likely that the bulk of the magnetic nanoparticles would be present as inclusions in larger grains, since we know that most of the grain mass is in grains with radii
7 Discussion
7.1 Solid-Phase Iron in Low Metallicity Galaxies
At submm - mm frequencies, the SED of the SMC is significantly less steep than the SED of normal-metallicity spiral galaxies, including the Galaxy. If the enhanced emission of the SMC at mm-wavelengths is due to Fe or Fe oxide grains, then such grains must account for a larger fraction of the dust mass in the SMC than in normal-metallicity spirals: conditions in the SMC must be in some way more favorable for their production or survival than in normal star-forming galaxies.
Spitzer Space Telescope observations of globular clusters have detected excess infrared emission from the most luminous giant stars, indicative of dusty winds. In many cases, the IR spectrum of the infrared excess is dominated by a featureless continuum at . Globular clusters where such featureless spectra have been seen include 47 Tuc (McDonald et al. 2011a), NGC 362 (Boyer et al. 2009), and Omega Cen (McDonald et al. 2011b); these three clusters have metallicities [Fe/H], , and , respectively (Harris 1996, 2010 edition)444 The updated Harris cluster catalogue can be found at http://www.physics.mcmaster.ca/$∼$harris.mwgc.dat. The featureless emission might be attributed to hot amorphous carbon grains, but carbon solids are not expected to form in these oxygen-rich outflows. The featureless continuum has therefore instead been attributed to thermal emission from metallic Fe grains (McDonald et al. 2010, 2011a, 2011b). Thus, low-metallicity AGB stars provide a possible source for metallic iron or Fe oxide grains in low-metallicity galaxies such as the SMC.
The iron-rich ejecta of Type Ia supernovae constitute a second potential source of iron grains (Dwek 1998). However, to date there is no evidence of dust formation in SN Ia ejecta, despite sensitive searches toward the Tycho and Kepler SNRs (Gomez et al. 2012).
Type II supernovae are known to form dust in the ejecta in at least some cases (Sugerman et al. 2006; Matsuura et al. 2011), and it is conceivable that Fe-rich portions of the ejecta might condense metallic Fe or Fe oxides. Rho et al. (2008) made models to reproduce the 5–38 spectra of the Cas A ejecta; their global model had of dust, of which 37% was metallic Fe.
Baron et al. (1977) observed that lunar soil grains have an increase in the concentration of Fe near the surface, with some of the Fe in metallic form. These surface layers (“rims”) reflect exposure of the grains to cosmic rays and the solar wind. “Inclusion-rich rims” consist of an amorphous silica-rich matrix with abundant metallic Fe inclusions, typically in diameter (Keller & McKay 1997). Inclusion-rich rims are compositionally distinct from the host grain, and are thought to have formed by deposition of atoms from vapors produced by nearby sputtering or impact events. In the laboratory, irradiation of olivine by 4 keV He ions is observed to lead to alteration of the surface layers, with formation of metallic Fe nanoparticles (Dukes et al. 1999; Carrez et al. 2002; Loeffler et al. 2009). Metallic Fe nanoparticles are found as inclusions in interplanetary dust particles known as GEMS (“Glasses with Embedded Metals and Sulfides”; Bradley 1994). Thus, it is reasonable to consider that some of the Fe in interstellar grains may be in metallic Fe inclusions.
Fe-rich grain material is injected into the ISM from stellar sources; as seen above, this may include metallic Fe. Additional conversion of gas-phase Fe to solids must take place in the ISM to account for observed low gas-phase abundance of Fe, particularly in view of the likely importance of grain destruction by sputtering in supernova blastwaves (Draine & Salpeter 1979a; Jones et al. 1994; Draine 2009): it has been estimated that “stardust” (material condensed in stellar outflows) accounts for only a small fraction – perhaps 10% – of the interstellar grain mass in the Galaxy (Draine 1990, 2009), and this is likely the case for all galaxies where a substantial fraction of the refractory elements (Mg, Si, Fe) is in grains. In such galaxies, including the SMC, the bulk of the grain material must have undergone conversion from gas to solid in the ISM. The character of the interstellar dust will therefore be largely determined by interstellar processing.
Sputtering by energetic H and He can alter the composition of interstellar dust. Sputtering yields have been discussed by a number of authors (e.g., Draine & Salpeter 1979b; Tielens et al. 1994). For a composite material, sputtering yields for H and He will be larger for the lighter elements in the target, and sputtering will therefore leave the surface layers enriched in heavy elements (such as Fe). The grain material that survives sputtering will therefore become Fe-rich, perhaps even metallic Fe. Studies of elemental depletions in the solar neighborhood indeed suggest that Fe is concentrated in grain cores (Fitzpatrick & Spitzer 1997; Jenkins 2009). Based on the observed depletion patter toward Sk 155 in the SMC, Welty et al. (2001) suggested that much of the interstellar Fe in the SMC (at least on the sightline to Sk 155) is in the form of metallic Fe or Fe oxides.
Rates for grain growth by accretion are proportional to the metallicity, while rates for grain destruction by H and He sputtering are not. The balance between grain growth and destruction, and the composition of the extant material, will therefore depend on the metallicity of the ISM. Hence, the apparent difference in grain composition between normal-metallicity spirals (like the Milky Way) and low-metallicity dwarf galaxies such as the SMC.
7.2 High-Frequency Magnetism and the Gilbert Equation
The models presented here use absorption cross sections for magnetic grains calculated following Draine & Hensley (2012), who used the Gilbert equation (Gilbert 2004) to model the frequency-dependent magnetic response of Fe, maghemite, and magnetite. The Gilbert equation uses an adjustable dimensionless parameter to characterize the dissipation. We have adopted for purposes of discussion, but the existing experimental literature employs a range of values of . If were to be smaller than , the opacity would be reduced, and the mass of Fe required to reproduce the observed emission of the SMC would correspondingly increase. If , magnetic grain models to explain the emission would be ruled out by abundance constraints.
Quite aside from the question of what value to use for , it is also important to recognize that the prescription for dissipation in the Gilbert equation, while mathematically convenient, is not based on an underlying physical model. Empirical evidence for the accuracy of the Gilbert equation at high frequencies is scant. Laboratory measurements of electromagnetic absorption in Fe and Fe oxide nanoparticles at frequencies up to 500 GHz are needed to validate use of the Gilbert equation at these frequencies.
7.3 Polarization
Based on starlight polarization studies, the magnetic field in the SMC appears to lie primarily in the plane of the sky, with substantial large-scale coherence (Mao et al. 2008, 2012). While our understanding of the physics of grain alignment remains incomplete, dust grains in the SMC are expected to be partially aligned with long axes tending to be perpendicular to the local magnetic field . Electric-dipole emission, which dominates for , will be polarized with .
As seen above, magnetic dipole emission from magnetic nanoparticles may become important for . The polarization of the magnetic dipole emission has been discussed by Draine & Hensley (2012). If the magnetic nanoparticles are free-fliers, and are aligned by a Davis-Greenstein-like mechanism, the magnetic dipole emission will be polarized in the same sense as the FIR emission, but the fractional polarization may be even larger than that of the FIR emission (see Fig. 9 of Draine & Hensley (2012)). Alternatively, if the magnetic nanoparticles are present as randomly-oriented inclusions within larger aligned grains, the magnetic dipole emission will be polarized with . As a result the fractional polarization may decrease by a factor as the frequency decreases from to , and for magnetite, maghemite, or Fe spheroids, the net polarization undergoes a reversal (i.e, changes from to ) near (see Fig. 10 of Draine & Hensley 2012).
Planck will measure the polarization at , , , , , and . Unfortunately, there are two additional factors that will complicate interpretation of the dependence of polarization fraction on frequency:
-
•
Emission from spinning dust becomes increasingly important with decreasing frequency, peaking near . If this emission component is minimally polarized, as predicted (Lazarian & Draine 2000), it will cause the fractional polarization to decrease with decreasing frequency in the 60– region.
-
•
There may be more than one grain type contributing to the normal “electric dipole” emission at long wavelengths, as in the mixtures of silicate and carbonaceous grains considered by Draine & Fraisse (2009). In this case, even the “normal” electric dipole emission alone may have the fractional polarization depending significantly on frequency. In the models of Draine & Fraisse (2009), the fractional polarization is predicted to increase with decreasing frequency.
Actual reversal of the polarization below would be an unambigous indication of magnetic dipole emission from magnetic inclusions, but this may be overwhelmed by the increasing importance of synchrotron emission (polarized with ) as the frequency falls below .
8 Summary
The principal conclusions of this paper are as follows:
-
1.
We show (see Figs. 3 and 4) that the SED of the SMC can be approximately reproduced by a mixture of “normal” dust (illuminated by a plausible range of radiation intensities) plus emission from a population of small () magnetic nanoparticles. We consider three magnetic materials: metallic Fe, magnetite Fe3O4, and maghemite -Fe2O3. It appears that any of these 3 materials, or a combination of them, can provide enough emission at so that a combination of “normal dust”, spinning dust, and magnetic dust can acount for the observed SED of the SMC.
-
2.
If conditions in the SMC are conducive to a large fraction of the interstellar Fe being in magnetic nanoparticles, other low metallicity galaxies may also have mm-wave emission dominated by magnetic dipole emission.
-
3.
While it seems natural for the magnetic nanoparticles to be inclusions in larger grains, the observed extinction does not rule out the possibility that the magnetic nanoparticles might be independent free-fliers.
-
4.
If the magnetic nanoparticles are present as randomly-oriented inclusions in larger silicate grains, the polarization is expected to fall as the frequency decreases below . It may be possible to test this prediction with measurements by Planck of the polarized emission from the SMC.
-
5.
Our models are based on high-frequency magnetic properties as estimated by Draine & Hensley (2012) using the Gilbert equation. Laboratory studies of the high-frequency () magnetic properties of metallic Fe and Fe oxides are needed to improve our understanding of magnetism at high frequencies.
References
- Aguirre et al. (2003) Aguirre, J. E., Bezaire, J. J., Cheng, E. S., et al. 2003, ApJ, 596, 273
- Ali-Haïmoud et al. (2009) Ali-Haïmoud, Y., Hirata, C. M., & Dickinson, C. 2009, MNRAS, 395, 1055
- Aniano et al. (2012a) Aniano, G., Draine, B. T., Calzetti, D., et al. 2012a, ApJ, submitted
- Aniano et al. (2012b) Aniano, G., Draine, B. T., Calzetti, D., et al. 2012b, in preparation
- Asplund et al. (2009) Asplund, M., Grevesse, N., Sauval, A. J., & Scott, P. 2009, ARA&A, 47, 481
- Baron et al. (1977) Baron, R. L., Bilson, E., Gold, T., et al. 1977, Earth. Plan. Sci. Lett., 37, 263
- Bennett et al. (2003) Bennett, C. L., Hill, R. S., Hinshaw, G., et al. 2003, ApJS, 148, 97
- Bot et al. (2010) Bot, C., Ysard, N., Paradis, D., et al. 2010, A&A, 523, A20
- Boyer et al. (2009) Boyer, M. L., McDonald, I., van Loon, J. T., et al. 2009, ApJ, 705, 746
- Bradley (1994) Bradley, J. P. 1994, Science, 265, 925
- Carrez et al. (2002) Carrez, P., Demyk, K., Cordier, P., et al. 2002, Meteoritics Plan. Sci., 37, 1599
- Compiegne et al. (2010) Compiegne, M., Verstraete, L., Jones, A., et al. 2010, ArXiv 1010.2769v1, 1010.2769
- Draine (1990) Draine, B. T. 1990, in Astr. Soc. Pac. Conf. Ser. 12, The Evolution of the Interstellar Medium, ed. L. Blitz, Vol. 12, 193
- Draine (2009) Draine, B. T. 2009, in Astr. Soc. Pac. Conf. Ser. 414, Cosmic Dust – Near and Far, ed. T. Henning, E. Grün, & J. Steinacker, 453
- Draine (2011) Draine, B. T. 2011, Physics of the Interstellar and Intergalactic Medium (Princeton, NJ: Princeton Univ. Press)
- Draine et al. (2007) Draine, B. T., Dale, D. A., Bendo, G., et al. 2007, ApJ, 663, 866
- Draine & Fraisse (2009) Draine, B. T., & Fraisse, A. A. 2009, ApJ, 696, 1
- Draine & Hensley (2012) Draine, B. T., & Hensley, B. 2012, submitted to ApJ, arXiv:1206.xxxx
- Draine & Lazarian (1998a) Draine, B. T., & Lazarian, A. 1998a, ApJ, 494, L19
- Draine & Lazarian (1998b) Draine, B. T., & Lazarian, A. 1998b, ApJ, 508, 157
- Draine & Lazarian (1999) Draine, B. T., & Lazarian, A. 1999, ApJ, 512, 740
- Draine & Lee (1984) Draine, B. T., & Lee, H. M. 1984, ApJ, 285, 89
- Draine & Li (2007) Draine, B. T., & Li, A. 2007, ApJ, 657, 810
- Draine & Salpeter (1979a) Draine, B. T., & Salpeter, E. E. 1979a, ApJ, 231, 438
- Draine & Salpeter (1979b) Draine, B. T., & Salpeter, E. E. 1979b, ApJ, 231, 77
- Dukes et al. (1999) Dukes, C. A., Baragiola, R. A., & McFadden, L. A. 1999, J. Geophys. Res., 104, 1865
- Dwek (1998) Dwek, E. 1998, ApJ, 501, 643
- Fazio et al. (2004) Fazio, G. G., Hora, J. L., Allen, L. E., et al. 2004, ApJS, 154, 10
- Finkbeiner et al. (1999) Finkbeiner, D. P., Davis, M., & Schlegel, D. J. 1999, ApJ, 524, 867
- Fitzpatrick & Spitzer (1997) Fitzpatrick, E. L., & Spitzer, L., Jr. 1997, ApJ, 475, 623
- Galametz et al. (2009) Galametz, M., Madden, S., Galliano, F., et al. 2009, A&A, 508, 645
- Galametz et al. (2011) Galametz, M., Madden, S. C., Galliano, F., et al. 2011, A&A, 532, A56
- Galliano et al. (2005) Galliano, F., Madden, S. C., Jones, A. P., Wilson, C. D., & Bernard, J.-P. 2005, A&A, 434, 867
- Galliano et al. (2003) Galliano, F., Madden, S. C., Jones, A. P., et al. 2003, A&A, 407, 159
- Gilbert (2004) Gilbert, T. L. 2004, IEEE Transactions on Magnetics, 40, 3443
- Gomez et al. (2012) Gomez, H. L., Clark, C. J. R., Nozawa, T., et al. 2012, MNRAS, 420, 3557
- Gordon et al. (2003) Gordon, K. D., Clayton, G. C., Misselt, K. A., Landolt, A. U., & Wolff, M. J. 2003, ApJ, 594, 279
- Gordon et al. (2011) Gordon, K. D., Meixner, M., Meade, M. R., et al. 2011, AJ, 142, 102
- Grossi et al. (2010) Grossi, M., Hunt, L. K., Madden, S., et al. 2010, A&A, 518, L52
- Harris (1996) Harris, W. E. 1996, AJ, 112, 1487
- Haynes et al. (1991) Haynes, R. F., Klein, U., Wayte, S. R., et al. 1991, A&A, 252, 475
- Hoang et al. (2010) Hoang, T., Draine, B. T., & Lazarian, A. 2010, ApJ, 715, 1462
- Hoang et al. (2011) Hoang, T., Lazarian, A., & Draine, B. T. 2011, ApJ, 741, 87
- Israel et al. (2010) Israel, F. P., Wall, W. F., Raban, D., et al. 2010, A&A, 519, A67
- Jenkins (2009) Jenkins, E. B. 2009, ApJ, 700, 1299
- Jones et al. (1994) Jones, A. P., Tielens, A. G. G. M., Hollenbach, D. J., & McKee, C. F. 1994, ApJ, 433, 797
- Keller & McKay (1997) Keller, L. P., & McKay, D. S. 1997, Geochim. Cosmochim. Acta, 61, 2331
- Kurt & Dufour (1998) Kurt, C. M., & Dufour, R. J. 1998, in Revista Mexicana de Astronomia y Astrofisica Conference Series, 202
- Lazarian & Draine (2000) Lazarian, A., & Draine, B. T. 2000, ApJ, 536, L15
- Lee et al. (2005) Lee, J.-K., Rolleston, W. R. J., Dufton, P. L., & Ryans, R. S. I. 2005, A&A, 429, 1025
- Leroy et al. (2007) Leroy, A., Bolatto, A., Stanimirovic, S., et al. 2007, ApJ, 658, 1027
- Li & Draine (2001) Li, A., & Draine, B. T. 2001, ApJ, 554, 778
- Li & Draine (2002) Li, A., & Draine, B. T. 2002, ApJ, 576, 762
- Loeffler et al. (2009) Loeffler, M. J., Dukes, C. A., & Baragiola, R. A. 2009, Journal of Geophysical Research (Planets), 114, 3003
- Loiseau et al. (1987) Loiseau, N., Klein, U., Greybe, A., Wielebinski, R., & Haynes, R. F. 1987, A&A, 178, 62
- Mao et al. (2008) Mao, S. A., Gaensler, B. M., Stanimirović, S., et al. 2008, ApJ, 688, 1029
- Mao et al. (2012) Mao, S. A., Gaensler, B. M., Stanimirović, S., et al. 2012, ApJ, 745, 199
- Mathis et al. (1977) Mathis, J. S., Rumpl, W., & Nordsieck, K. H. 1977, ApJ, 217, 425
- Matsuura et al. (2011) Matsuura, M., Dwek, E., Meixner, M., et al. 2011, Science, 333, 1258
- McDonald et al. (2011a) McDonald, I., Boyer, M. L., van Loon, J. T., & Zijlstra, A. A. 2011a, ApJ, 730, 71
- McDonald et al. (2010) McDonald, I., Sloan, G. C., Zijlstra, A. A., et al. 2010, ApJ, 717, L92
- McDonald et al. (2011b) McDonald, I., van Loon, J. T., Sloan, G. C., et al. 2011b, MNRAS, 417, 20
- Miville-Deschênes & Lagache (2005) Miville-Deschênes, M.-A., & Lagache, G. 2005, ApJS, 157, 302
- Mountfort et al. (1987) Mountfort, P. I., Jonas, J. L., de Jager, G., & Baart, E. E. 1987, MNRAS, 226, 917
- O’Halloran et al. (2010) O’Halloran, B., Galametz, M., Madden, S. C., et al. 2010, A&A, 518, L58
- Planck Collaboration et al. (2011a) Planck Collaboration, Ade, P. A. R., Aghanim, N., et al. 2011a, A&A, 536, A1
- Planck Collaboration et al. (2011b) Planck Collaboration, Ade, P. A. R., Aghanim, N., et al. 2011b, A&A, 536, A17
- Planck Collaboration et al. (2011c) Planck Collaboration, Ade, P. A. R., Aghanim, N., et al. 2011c, A&A, 536, A20
- Rho et al. (2008) Rho, J., Kozasa, T., Reach, W. T., et al. 2008, ApJ, 673, 271
- Rieke et al. (2004) Rieke, G. H., Young, E. T., Engelbracht, C. W., et al. 2004, ApJS, 154, 25
- Rolleston et al. (2003) Rolleston, W. R. J., Venn, K., Tolstoy, E., & Dufton, P. L. 2003, A&A, 400, 21
- Russell & Dopita (1992) Russell, S. C., & Dopita, M. A. 1992, ApJ, 384, 508
- Sandstrom et al. (2010) Sandstrom, K. M., Bolatto, A. D., Draine, B. T., Bot, C., & Stanimirovic, S. 2010, ApJ, 715, 701
- Silsbee et al. (2011) Silsbee, K., Ali-Haïmoud, Y., & Hirata, C. M. 2011, MNRAS, 411, 2750
- Silverberg et al. (1993) Silverberg, R. F., Hauser, M. G., Boggess, N. W., et al. 1993, SPIE, 2019, 180
- Stanimirovic et al. (1999) Stanimirovic, S., Staveley-Smith, L., Dickey, J. M., Sault, R. J., & Snowden, S. L. 1999, MNRAS, 302, 417
- Sugerman et al. (2006) Sugerman, B. E. K., Ercolano, B., Barlow, M. J., et al. 2006, Science, 313, 196
- Szewczyk et al. (2009) Szewczyk, O., Pietrzyński, G., Gieren, W., et al. 2009, AJ, 138, 1661
- Tielens et al. (1994) Tielens, A. G. G. M., McKee, C. F., Seab, C. G., & Hollenbach, D. J. 1994, ApJ, 431, 321
- Weingartner & Draine (2001) Weingartner, J. C., & Draine, B. T. 2001, ApJ, 548, 296
- Welty et al. (2001) Welty, D. E., Lauroesch, J. T., Blades, J. C., Hobbs, L. M., & York, D. G. 2001, ApJ, 554, L75
- Werner et al. (2004) Werner, M. W., Roellig, T. L., Low, F. J., et al. 2004, ApJS, 154, 1
- Ysard et al. (2011) Ysard, N., Juvela, M., & Verstraete, L. 2011, A&A, 535, A89
- Zubko et al. (2004) Zubko, V., Dwek, E., & Arendt, R. G. 2004, ApJS, 152, 211