Limits on dust emission from z5 LBGs and their local environments
Abstract
We present 1.2 mm MAMBO-2 observations of a field which is over-dense in Lyman Break Galaxies (LBGs) at . The field includes seven spectroscopically-confirmed LBGs contained within a narrow () redshift range and an eighth at . We do not detect any individual source to a limit of 1.6 mJy/beam (2 rms). When stacking the flux from the positions of all eight galaxies, we obtain a limit to the average 1.2 mm flux of these sources of 0.6 mJy/beam. This limit is consistent with FIR imaging in other fields which are over-dense in UV-bright galaxies at . Independently and combined, these limits constrain the FIR luminosity (8-1000m) to a typical LBG of L L⊙, implying a dust mass of M M⊙ (both assuming a grey body at 30K). This LFIR limit is an order of magnitude fainter than the LFIR of lower redshift sub-mm sources (). We see no emission from any other sources within the field at the above level. While this is not unexpected given millimetre source counts, the clustered LBGs trace significantly over-dense large scale structure in the field at . The lack of any such detection in either this or the previous work, implies that massive, obscured star-forming galaxies may not always trace the same structures as over-densities of LBGs, at least on the length scale probed here. We briefly discuss the implications of these results for future observations with ALMA.
keywords:
galaxies: high-redshift - galaxies: starburst - galaxies: star-formation - radio continuum: galaxies1 Introduction
Lyman Break Galaxies (LBGs) form a substantial fraction of the observed galaxy population (e.g Vanzella et al., 2009; Douglas et al., 2009, 2010), with a comoving number density of Mpc-3 (at , Bouwens et al., 2007). They are identified via their bright UV continuum emission arising from hot, young stars in unobscured starburst regions. Considerable work has been carried out to investigate LBG properties which can be discerned from their rest-frame UV spectra and UV/optical spectral energy distributions (e.g Verma et al., 2007; Stark et al., 2009). However, until now little work has been carried out to explore their cooler dust and interstellar gas components necessary for a clearer and fuller picture of these important probes of early galaxy evolution. In order to fully understand star-formation activity at high redshift and the subsequent evolution of early star-forming galaxies, we need to observe their complete baryonic budget. By comparing the stellar, molecular gas and dust fractions of these systems we can infer their star-formation history and potential fate, therefore understanding the importance of this population to galaxy evolution in general.
Until recently, studies of the dust content of the highest redshift galaxies () have been limited to massive and rare systems in comparison to more typical and numerous star-forming galaxies at . These studies have primarily targeted quasar host galaxies (e.g Wang et al., 2008; Carilli et al., 2010) and the highest redshift luminous submillimetre galaxies (SMGs, e.g Coppin et al., 2010; Riechers et al., 2010), a small subset of the SMG population which is dominated by galaxies at (Blain et al., 2002; Chapman et al., 2005; Smail et al., 2002). Dust emission has been observed in more typical galaxies at significant redshifts () but usually only in lensed objects (e.g Baker et al., 2001; Negrello et al., 2010; Conley et al., 2011), or from rare LBGs with exceptionally high star-formation rates (Chapman & Casey, 2009). Given their comparatively high source density, LBGs are likely to be better tracers of more typical high redshift star-formation than such rare and highly luminous sources, even given the star-formation rates of 10-100 M⊙yr-1 determined from the UV emission of L∗ LBGs ( Verma et al., 2007).
Given that these star-formation rates are typically an order of magnitude less than those of high redshift SMGs, and that the surface densities of SMGs are lower than those of LBGs, unless there is substantial obscured star-formation associated with typical LBGs, they will not be detected at the levels usually reached by submillimeter surveys (several mJy at 850m-1.2mm). To detect or constrain dust emission from LBGs, the average source needs to be probed to sub-mJy levels. In addition, a large-enough number of these sources need to be sampled to search for any rare LBG that has significant sub-mm flux. Until recently there were no published predictions of the expected sub-mm flux of distant LBGs based on any self-consistent modelling of the star-formation within the population. Recently Gonzalez et al. (2011) derived predicted submm fluxes for high redshift LBGs based upon the GALFORM semi-analytic model (see Cole et al., 2000). These predicted fluxes are approaching the observational limits of Stanway et al. (2010) (see later), indicating that such observations are starting to challenge theoretical predictions for early galaxy evolution.
While studies of typical unlensed star-forming galaxies at lower redshifts ( LBGs) have yet to yield an individual detection in the FIR, we cannot necessarily extrapolate these results to infer the properties of the population. Many of the properties of the sources are different from those of typical LBGs at (Verma et al., 2007). The higher redshift LBGs are also likely to be the progenitors of different current-day galaxy populations than the LBGs. While the bulk of stars in present-day galaxies are formed at ( Sobral et al., 2012), ellipticals found in the cores of galaxy clusters appear to rapidly form a significant fraction of their stars at ( Thomas et al., 2010). Consequently, the mm/submm characteristics of the LBGs could differ from those of LBGs, requiring that they are directly measured rather than extrapolated from the existing work at lower redshifts ( Webb et al., 2003).
In order to further explore the LBG population in the mm-submm regime, we present the results of 1.2mm MAMBO-2 imaging of a field selected for a high density of spectroscopically-confirmed LBGs which trace an apparently highly over-dense structure in the young Universe. The field is drawn from the ESO Remote Galaxy Survey (ERGS, Douglas et al., 2007, 2009, 2010), which identified a sample of 70 spectroscopically confirmed LBGs over 10 widely spaced arcmin2 fields.
Two of these fields display highly significant 3-dimensional over-densities of spectroscopically-confirmed UV-bright sources over narrow redshift ranges (). The two structures occupy no more than 4 per cent of the effective survey volume, while containing per cent of the spectroscopically-confirmed LBGs. Hence, the LBGs in these fields are likely to trace significant large scale structures in an early stage of their evolution, and may themselves contain other sub-mm luminous galaxies ( Capak et al., 2011).
The redshift and spatial clustering of sources in these fields fortuitously make them ideal testbeds for simultaneous observations of many LBGs and additionally probe significant early mass over-densities. The first of these fields was studied by Stanway et al. (2010) at 870m using the Large Apex BOlometer CAmera (LABOCA) resulting in a limit of mJy for the average emission from nine LBGs. The MAMBO-2 observations presented here are of the second highly-over-dense field in ERGS which cover a further eight LBGs and the over-dense structure that seven of these inhabit. By doubling the sample size of spectroscopically-confirmed LBGs targeted for their mm/sub-mm dust emission, using a field spatially unrelated from the first, we aim to both confirm the limit on the emission from a typical LBG and to search for or limit the number of potential mm/sub-mm luminous outliers in the population.
These observations also allow the exploration of the nature of LBGs beyond what is possible with the standard optical/near-IR analysis (e.g. Douglas et al., 2010). The galaxies identified through the Lyman Break technique are selected for their rest-frame (presumably unobscured) UV emission which itself implies a minimum star-formation rate (and therefore, via a set of assumptions, a minimum FIR luminosity). However, it is entirely possible that some of these either contain obscured stellar populations or have neighbours/companions that have similarly obscured stellar populations (which may be more significant that the UV-emitting population). These observations directly target the source of any obscuration independent of the UV emission.
Throughout this paper all optical magnitudes are quoted in the AB system (Oke & Gunn, 1983), and the cosmology used is 100h/H0 = 70kms-1 Mpc-1, = 0.7 and = 0.3.
2 Observations
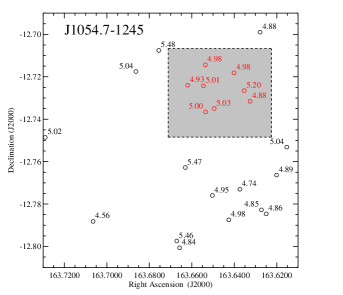
Observations were undertaken using the MAMBO-2 array (Kreysa et al., 1998) on the IRAM 30m telescope in the Spanish Sierra Nevada. MAMBO-2 is 117 channel bolometer with individual channels arranged in a circular pattern. It has a bandwidth centre of 250 GHz (1.2 mm) and half power spectral range of 210 to 290 GHz. The effective beam size is 10.7′′ ( kpc at ) and it has an undersampled field of view of 4′. Field J1054.7-1245 was observed on two separate occasions using On-the-Fly mapping for a total integration time of 2.2 hrs on 2009 March-15/16 th and 5.5 hours during 2011 January-March. Each map was comprised of 18 azimuthal subscans of 66 s each, scanning at 5′′s-1, with 8′′ steps in elevation between subscans. Primary pointing, focus and flux calibrations were carried out on Saturn and secondary pointing calibrations on nearby source J1058+016. Sky dip observations were taken to correct for atmospheric opacity and Precipitable Water Vapour (PWV) at the site was typically 0.35-0.7mm (Tau CSO at 225GHz 0.1-0.4). The map was centred on the most densely clustered region of the field for which 7mm and 12mm observations are already in hand (see Davies et al., 2010). A total area of arcmin2 was surveyed to 75% of the best total coverage encompassing eight LBGs (Figure 1). Data were reduced using the dedicated MAMBO-2 reduction package MOPSIC (Version 19.01.2010, written by R. Zylka at IRAM) utilising an algorithm designed to identify weak sources. Individual channels are corrected for opacity and instrumental noise, and flux calibrated using data obtained during the observations. A Correlated Signal Filter (CSF) was used to reduce sky noise, a process designed specifically for the detection of compact ( the beam size), weak ( rms) sources and which removes diffuse background sources of flux. In the resultant map, a root mean square (rms) noise of 0.82 mJy/beam is obtained over the central arcmin2 region.
3 Results
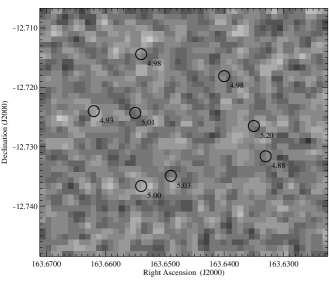

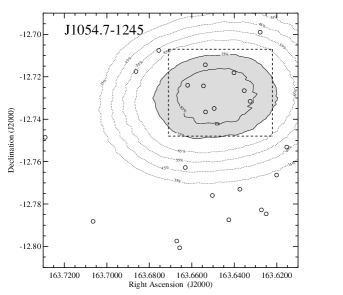
Eight spectroscopically-confirmed LBGs fall within the central arcmin2 of the MAMBO-2 observations (Figure 2); seven lie within a narrow range while the eighth is at . Other spectroscopically-confirmed LBGs that fall outside of this central region were excluded due to the increased noise in the MAMBO-2 image at larger radii (more than twice the rms achieved at the centre of the field), Figure 1. No individual LBG is detected at rms (see figure 2). There are only 4 potential detections at twice the rms in this central region, and none at rms, broadly consistent with expected statistical fluctuations. The immediate fields of each of the four potential detections and the eight LBGs were examined using our optical, near-IR and SPITZER/IRAC imaging of the larger fields (Douglas et al., 2009, 2010) in order to search for optical counterparts and assess the potential for source confusion. Only one of the four potential detections showed a possible counterpart that could account for the signal in the MAMBO-2 data. One of the LBGs had a source within 5′′ of its position detected in all bands from through to 8 m which could have confused the interpretation had that LBG been detected in the MAMBO-2 data.
The typical half-light radii of a UV-luminous stellar component of an LBGs in our sample is 0.2′′ (Douglas et al., 2009), while the MAMBO-2 beam has a FWHM of 10.7′′ and so covers not just the UV-luminous regions of any LBG, but the immediate projected kpc around it. It is therefore expected that any emission from sources will be unresolved in the MAMBO-2 maps even if it is extended beyond the UV-emission region, and a 2 rms upper limit on the flux from an individual source can be constrained at mJy.
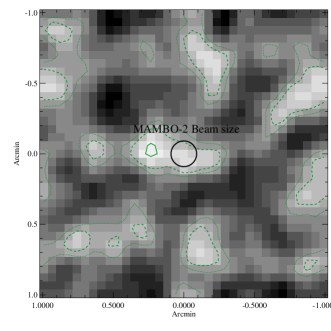
In order to better constrain the flux from a typical LBG and its immediate surroundings (within the beam FWHM), data were combined from the positions of the eight LBGs. A pixel ( beam size) region centred on each LBG is extracted from the map. These pixel images are then combined into an average image taking the mean of the eight images at every pixel position. The resultant image was then convolved with a Gaussian matching the MAMBO-2 beam size. The resultant composite image is shown in Figure 3. Although there is a region of positive flux at the centre of this composite image, it is extended by at least two beam widths in one direction, with the peak not centred on the position of the objects (beyond the expected pointing accuracy of the telescope). Given the limited number of independent points in this image (of order 100), the significance of this region is not high. We confirm this by repeating the stacking analysis using 8 random positions on the full MAMBO-2 image. The central arcmin2 region of this map contains only 255 independent MAMBO-2 beam size regions. If 1000 realisations of a similar combined image made from random combinations of the 248 positions that do not contain a LBG are produced, it is found that of the realisations contain a 0.6 mJy/beam peak in the central position (the flux in the central pixel of Figure 3 is 0.6 mJy/beam). Consequently, we treat this flux as an upper limit to the mean emission of these LBGS, so mJy, times lower than the RMS limit on individual sources.
The MAMBO-2 beam size (10.7′′) means that this limit not only applies to the FIR flux arising from the rest-frame UV-bright regions, but also includes any other emission within or kpc (and certainly within ) of the sources. This flux may arise from either neighbours at the same redshift without significant UV emission, or any underlying system within which individual LBGs are embedded as UV-bright star forming regions (see discussion).
Although the MAMBO-2 field also encompasses the positions of several spectroscopically-unconfirmed LBGs candidates, we do not include these in our composite analysis as if only a small number of these sources are actually at (which can show similar photometric colours to LBGs, see Stanway et al., 2008), they could bias an estimate for any FIR flux from true sources. For completeness we also produced a composite image including the LBGs which were excluded as having more than twice the rms achieved at the centre of the field. This composite image did not improve upon the depth obtained using the eight central LBGs - hence we do not discuss it in any further analysis.
3.1 Joint constraints on LFIR, Tdust and
In the absence of a detection, we can only jointly constrain the FIR luminosity and dust temperature of a typical LBG, and therefore can only explore a limit on one if we make a reasonable assumption about the other. In order to relate the limiting flux to a joint constraint, we assume that any FIR emission has a grey-body spectrum arising from emission by dust heated by starlight. Accordingly we follow the procedure used in Aravena et al. (2008) and Stanway et al. (2010). We calculate the integrated FIR luminosity (LFIR) between 8-1000m by integrating the grey body spectrum assuming an absorption coefficient of , as this provides the best fit to dust absorption in the spectra of high redshift quasars (Priddey & McMahon, 2001). We normalise this assuming cm2 g-1 at 250 GHz (See Kruegel & Siebenmorgen, 1994). In Figure 4, the integrated FIR luminosity as a function of dust temperature is displayed for the flux limit obtained in the composite image.

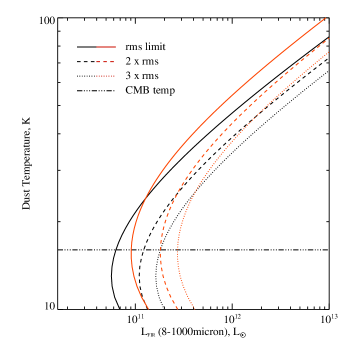
Given the lack of previous study and detections of high redshift LBGs in the mm/sub-mm, little is known about the appropriate dust temperatures for such sources. Baker et al. (2001) use SED fitting of a single, highly lensed LBG at to obtain a dust temperature of T = 33 K, and the mean dust temperature of submillimeter selected galaxies at is K (Chapman et al., 2005). We note that lower redshift () ULIRGS are found to have higher temperatures (K, Rieke et al., 2009). Although such sources have very different redshifts and luminosities to the LBGs considered here, they demonstrate that higher temperatures are possible.
In the absence of an exact dust temperature for these sources, we assume 30 K as this is close to the temperature derived for the LBG - likely to be the most appropriate of the temperatures noted above. Using this, the FIR flux limit derived from the composite analysis of a typical z = 5 LBG in this work gives a formal 2 rms limit to the FIR luminosity of L L⊙. This limit is several times fainter than the FIR luminosities of galaxies detected in the sub-mm (Chapman et al., 2005; Chapman & Casey, 2009; Negrello et al., 2010; Conley et al., 2011), which generally have L L⊙. With the caveat that the temperature is assumed rather than determined, the flux limit implies that typical LBGs have FIR luminosities below those of ULIRGS and intermediate redshift BzKs ( see Daddi et al., 2010).
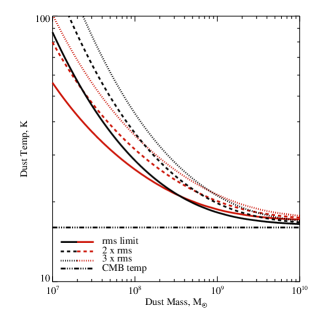
While assuming a higher temperatures will lead to a higher FIR luminosity, it better constrains the associated dust mass, which varies inversely with temperature for a given flux limit. In order to place a temperature-dependent limit on the dust mass, we use the relationship between redshift-dependent flux density and dust mass outlined in equations 1 and 2 of Weiß et al. (2007). This includes the effect of the increased Cosmic Microwave Background (CMB) temperature at high redshift, whereas the temperature of a source approaches that of the CMB, the mass required to distinguish it from CMB fluctuation increases dramatically. In this we assume a source size of 5 kpc, though the result does not change significantly for sizes between 2-5kpc (typical sizes of LBGs, Douglas et al., 2009).
In Figure 5, the dust mass as a function of dust temperature is displayed for the flux limit obtained in the composite image. To constrain the dust mass of a typical source in our field, an assumption about the dust temperature must once again be made. A dust temperature of 30 K gives a formal 2 rms limit to the dust mass of M M⊙. At a higher temperatures of 40 K, approaching that found for lower redshift ULIRGS, the mass limit is M M⊙. Dropping the temperature to 20 K leads to a far weaker mass limit, M M⊙. However this temperature is approaching that of the CMB at . Given that there is clearly vigorous star-formation in the LBGs, it seems unlikely the dust would remain unheated by it or be close to equilibrium with the CMB. Hence, the naive expectation is that the dust temperature will be higher than this.
3.2 Obscured star-formation rates
Star-formation rates (SFRs) in typical LBGs have routinely been determined through SED fitting to their rest-frame UV-optical emission (sampling star-formation which is subject to little dust obscuration), giving typical values of M⊙ yr-1 Verma et al. (2007). While our non-detection in the composite image is consistent with a significant proportion of star-formation within LBGs being relatively free of dust extinction, it is nonetheless interesting to consider the limit to the dust obscured SFR imposed by our non-detection. Using the Kennicutt relation for local starburst galaxies (Kennicutt et al., 1998) and our LFIR limit we obtain an obscured SFR limit of M⊙ yr-1. This suggests that at least 40 of the total star-formation in LBGs is unobscured.
3.3 Combining with LABOCA data
In addition to investigating the limits derived from this study, we can also combine our 1.2 mm observations with LABOCA(870 m) imaging of a similar, LBG over-density from Stanway et al. (2010) in an attempt to obtain a limit to or detect the combined emission from the 17 spectroscopically-confirmed LBGs across the two data sets. We do this by combining the average stacked 1.2mm image with a similar average stacked 870 m image obtained by Stanway et al. (2010). We take into account the different beam sizes and pixel scales, scaling the 870 m limit to that at 1.2mm by assuming a temperature and spectrum of 30K grey body for the average source and accounting for different mean redshifts of the two LBG samples. No source is identified at the central position in this combined image at a 2 rms limit of 0.44 mJy/beam at 1.2mm, representing a limit on the average flux of the 17 LBGs.
4 Discussion
4.1 Non-detection in the composite image and implications for sources
4.1.1 Model predictions for FIR emission LBGs
Until recently, there have been no self-consistent model-based predictions for the expected fluxes of sources such as these. After these observations were carried out, Gonzalez et al. (2011) made predictions for the 850m flux of distant LBGs as a function of their UV luminosities, based on the GALFORM semi-analytic model of galaxy evolution. Although they concentrate on redshifts and , the small variation in prediction at around at rest-frame UV absolute magnitude, M5log(h) (the typical value for the Å absolute magnitude of the ERGS sources, where h is the dimensionless Hubble parameter) indicates we can use these predictions at . Looking at their figure 11, the median flux predicted is around 0.4 mJy at 850 m, which we calculate to be equivalent to 0.2 - 0.25 mJy at 1.2 mm (for grey body temperatures in the range 30 - 50 K).
We also infer from their figure 11 that about ten per cent of their sources should be brighter than mJy at 850 m. The limits determined in both this and the earlier work of Stanway et al. (2010) for the typical source, are roughly double the median value predicted by Gonzalez et al. (2011). While our non-detections are compatible with the model, it is clear from our attempt at combining both the current and Stanway et al. (2010) data sets that a sample size double that of the current one (observed to similar depths or deeper) will start to challenge or validate these model predictions. Of course, this is just one model with one set of assumptions and prescriptions; having the ability to test more models which use different methodologies would increase the utility of such observations. Interestingly an alternate model by Finkelstein et al. (2009), based on the assumption that sub-mm emission in these sources is powered by the UV-luminous component, gives predictions that span a range covering both the predictions of Gonzalez et al. (2011) and our limits on the typical LBG.
4.1.2 The nature and baryonic content of LBGs
As noted earlier, we obviously cannot know the dust temperature for any material within these galaxies in the absence of detections at multiple frequencies. However, by assuming a temperature we are able to explore how the limit to the dust mass relates to the mass in stars for these sources. For temperatures of 30 K or above, a dust mass limit for LBGs at is found to be roughly to of the typical mass of their stellar component (depending on study, for a typical LBG similar to those observed here, M few M⊙ at least, Verma et al., 2007; McLure et al., 2009). In addition, the molecular gas content of a typical LBGs in this field has been found to be comparable to this typical stellar mass, at most (MH2 a few M⊙, assuming a CO flux to H2 mass conversion ‘X-factor’ = 0.8 M⊙(K km s-1 pc2)-1 for consistency with earlier work, see Solomon & Vanden Bout, 2005; Davies et al., 2010, and references therein). Hence, assuming a dust temperature of K, no more than of the total baryonic mass of LBGs at is in their dust and molecular gas component - to the current limits and given the assumptions above. Clearly, using a larger CO flux to H2 mass conversion factor will increase the upper limit to the molecular gas content. Using an X-factor more typical of low redshift spirals, 4.5 M⊙ (K km s-1 pc2)-1, with these limits, allows up to of the baryonic mass of LBGs to be in the form of molecular gas and dust if a typical source has a stellar mass of M⊙. For sources with stellar masses closer to M⊙, even with this X-factor, the gas would account for less than of the baryonic mass. As we know little of the correct CO flux to H2 mass conversion factor for these sources we can not constrain this fraction further and must consider this limitation in any conclusions drawn from such an analysis.
By determining limits to the total baryonic content of LBGs we can explore the nature of the LBG phenomenon at these redshifts. A substantial fraction of these objects show distorted or multiple UV components on sub-arcsecond scales, corresponding to a few kpc (e.g. Conselice & Arnold, 2009; Douglas et al., 2010). There has been detailed discussion in the literature as to what these morphologies tell us about the nature of LBGs. Through a comparison to low redshift LBG analogues, Overzier et al. (2009) show that such morphologies can be explained as the result of gas rich mergers of low mass systems triggering starbursts, while Law et al. (2007) explore the possibility that the UV components are relatively unobscured regions of star-formation in a larger underlying galaxy which is either intrinsically less UV-luminous or is extincted.
Given the separation between components (typically , a few kpc), any encompassing or underlying galaxies clearly have to be larger and more massive than the sizes and masses attributed to the UV-luminous regions (so with a total stellar mass M⊙ and possibly considerably larger). Both a gas rich merger or a larger underlying system could easily lead to appreciable far infra-red (FIR) luminosities, through significant rapid dust production in the case of the merger or simply by the amount of obscuring material/total mass in the case of the underlying system. However, it is perhaps easier to explain a lower FIR luminosity in the case of a merger, as it could be argued that in these LBGs the UV emission traces the majority of the material in the system.
The apparent lack of large quantities of material that could be detected in the millimetre and sub-millimetre (dust and molecular gas) in these systems weakens the case for LBGs being unobscured super starburst regions embedded in much larger systems, (see discussion in Davies et al., 2010). While this also argues against very gas-rich mergers that promptly produce large amounts of dust, it poses no constraint on mergers where most of the baryonic material is traced by the UV emission and is in the form of stars.
4.2 Comparisons to lower redshift populations and implications for future observations
Given the lack of detections in the current data it is worthwhile exploring how much deeper further observations may need to probe before the population is detected in emission from dust. We can do this by investigating the properties of lower redshift () sources which, while not ideal, may have use as analogues for LBGs.
The limit on the stellar mass to cold dust ratio obtained here ( 10) is similar those observed in some local starbursts. In a study of metal poor blue compact dwarf galaxies, Hunt et al. (2005) derive stellar to dust mass ratios of 7.5 and 13 for two sources. Both stellar and dust masses in Hunt et al. (2005) are derived from SED fitting and no errors are given, hence these are only best-fit values. Although these sources are less massive than LBGs at , they have comparable specific star-formation rates and metallicity (0.14 Z⊙ and 0.2 Z⊙ compared to 0.1 - 0.2 Z⊙ obtained for LBGs from SED fitting, Verma et al. 2007, and rest-frame UV spectral slope analysis, Douglas et al. 2010). In addition, these local starbursts have emission dominated by small-grain, Type-II SNe formed dust as is present in high- sources (Maiolino et al., 2004) and therefore, they should display similar dust characteristics.
If these systems are good models for LBGs, observations not much deeper than those presented here should start to detect the typical LBG at FIR wavelengths. For example, using a stellar mass of M M⊙ and dust temperature of K, a stellar to dust mass ratio of predicts a dust mass of M M⊙. Assuming the same grey body model outlined above, an rms of mJy is required for a 2 detection of such a source. For a similar MAMBO-2 observation and stacking the 8 LBG in the field a h of integration time are required to reach this limit. In comparison, for a similar integration time to that in this study, a composite image of LBGs would be required to obtain a detection.
A more direct comparison can be made with UV-selected galaxies at lower redshift. LBGs at are identified via bright rest-frame UV continuum emission using a similar method to those at . Their UV/optical properties indicate they have comparable star-formation rates, but with higher metallicities, slightly larger dust extinctions in the rest-frame UV and have typically older and more massive detectable stellar population (by close to an order of magnitude) than LBGs (see Verma et al., 2007), so their use as analogues is limited.
Rigopoulou et al. (2010) detect the average emission from IR-luminous LBGs at 250m with Herschel-SPIRE and calculate LL⊙ for TK. Looking at figure 4, we note that if we assumed this temperature, our flux limit already probes this luminosity at . However, for sources not selected to be IR-luminous, the picture is different. Thermal dust emission has been detected in several strongly lensed LBGs at giving typical dust masses of few M⊙ (e.g. Baker et al., 2001; Coppin et al., 2007). Stanway et al. (2010) calculate a similar limit to the dust mass of typical LBGs from the flux limit obtained by Webb et al. (2003) from observations of such sources in the Canada-UK Deep Submillimeter Survey (again assuming K). If these values are also appropriate at higher redshift, then significantly deeper observations will be required to detect the dust emission from LBGs at , observations which may run into the confusion limit of single-dish observations.
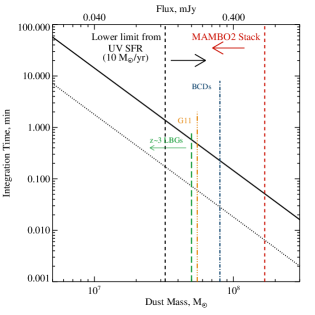
However, the required depth will be straightforwardly achievable with ALMA when it reaches full science mode. Figure 6 displays the dust mass limit as a function of integration time for ALMA in full science mode assuming a grey body at 30 K. These values are calculated using the ALMA exposure time calculator observing a field at a declination of -12 deg at 250 GHz, with 7.5 GHz bandwidth, Tsky=44.3 K and Tsys=132.5 K. Clearly ALMA will make the detection of FIR emission from such sources routine, obtaining the same limit as our MAMBO-2 observations in seconds and detecting M M⊙ sources at z in just tens of minutes. While this represents a relatively short exposure for ALMA, it does mean that these sources will have to be targeted individually rather than as part of anything other than a deep blind survey. The source density of spectroscopically-confirmed ERGS LBGs is approximately one per 6 arcmin2, or one source per ALMA primary beams at 250 GHz. While fainter LBGs are more numerous, they are also likely to be fainter in the mm/sub-mm ( Gonzalez et al., 2011).
4.3 Overlap between LBG and SMG populations at
Several spectroscopically-confirmed SMGs have been identified in the past three years (e.g. see the list in Kohno, 2011). While the optical photometry of these sources is incomplete in the literature, of the seven sources in Kohno (2011), five would have been selected in a survey using the Lyman break technique (see Schinnerer et al., 2008; Coppin et al., 2009; Daddi et al., 2009a, b; Riechers et al., 2010; Knudsen et al., 2010). Given that a large fraction of distant SMGs are potentially detectable in LBG surveys (even if for some of them the UV-light is contaminated by AGN emission, unlike most LBGs, e.g. Coppin et al., 2009), it is informative to quantify the overlap between the population of typical LBGs and the more extreme (as far as star-formation rates are concerned) SMGs at this redshift.
We have shown that the typical LBG is not a strong FIR source. By combining our results with those of Stanway et al. (2010) we can place a limit on the fraction of LBGs that could be mJy sources at mm. None of the 17 spectroscopically-confirmed sources probed are detected individually at 1-3 mJy and together have an average flux of less than 1 mJy implying that less than 10% of these confirmed LBGs have submillimeter flux at the milli-Jansky level. In addition to these sources, both clustered fields contain multiple photometrically-selected LBG candidates without spectroscopic confirmation, either because they were not targeted by spectroscopy due to observational constraints, or because spectroscopy was inconclusive (Douglas et al., 2009, 2010). None of these were detected at 870 m or 1.2 mm. Accounting for the fraction of these candidates that will be at (Douglas et al., 2009), this almost doubles the number of LBGs covered in the deep regions of the two fields, indicating that less than 5 % of LBGs have flux at 2 - 3 mJy.
In order to place an upper limit on the fraction of FIR bright sources in the LBG population, we can extrapolate further. Given the volume probed and the lack of detections in both this and the Stanway et al. (2010) work, if the typical source is detected at just below our limits (this does not have to be true but will maximise the fraction of bright sources) and if at this flux level we probe the exponential (bright) end of the LBG FIR luminosity function, we expect less than 1 % of the spectroscopically confirmed LBG population to give a mJy detection. If the typical source is considerably fainter, then an even smaller fraction will be this bright.
Furthermore, it should be remembered that these sources are selected from the two most over-dense fields of the ten similarly sized ERGS pointings. If there is any bias towards more massive starburst galaxies being preferentially found in the regions with the most evolved large scale structure at high redshift (the most massive systems at any epoch are likely to be found in the most over-dense environments, see Mo & White, 2002; Blain et al., 2004), the lack of a detection in these fields may indicate an even lower limit on the fraction of potential FIR bright LBGs in this and in any unbiased LBG survey as a whole.
4.4 The lack of other detections in the field
Given the expected typical sub-mm flux of LBGs and known sub-mm number counts, it is perhaps unsurprising that no sub-mm bright sources were detected within this field to our limiting flux (at sources/deg2, we would expect source in a randomly chosen field this size, based on the numbers in Hatsukade et al., 2011). However, this field was selected because of its unusual clustering of LBGs, indicating that it contains a significantly over-dense, and therefore evolved, structure at this redshift.
It has been argued that luminous SMGs require significant early hierarchical evolution of their environments to exist and hence should be found in high density peaks of the matter distribution at high redshift (e.g. Blain et al., 2004). Recently, a SMG was discovered within an over-density of photometrically-selected LBGs at the same redshift (Capak et al., 2011), supporting this picture. The LBG over-densities in the currently studied field and in that studied by Stanway et al. (2010) are comparably dense. All three fields could potentially be the progenitors of low redshift massive clusters, or at least go on to form very massive galaxies by the present-day. Therefore, they are equally plausible regions in which to search for massive (UV-obscured) submillimeter galaxies.
Despite the LBG clustering indicating a high density environment, we do not detect any sources within either field with fluxes above a few mJy (with FIR luminosities of more than a few L⊙ and therefore, dust masses of above a few M⊙ assuming K, and inferred star formation rates above a few M⊙ yr-1). A possible explanation for this is that the FIR luminous stage giving rise to SMGs is expected to be short (100 Myr). Therefore, it is entirely possible that at least one such system, which is at an evolutionary stage when it is not FIR luminous, will be in the extended structure rendering it undetectable in our observations. The typical timescale of the LBG phase at these redshifts is comparable or less ( Myr, Verma et al., 2007; McLure et al., 2009). However, as discussed in Stanway et al. (2008) and Douglas et al. (2010), given the relatively high volume density of such sources, as some LBGs fade in the UV, others “switch on”. This allows the large-scale structure to be continually traced by LBGs, albeit different LBGs at different times. Given the lower volume density of SMGs it is possible that we have simply observed the structure at a time when none of the possible SMG systems are FIR luminous.
These MAMBO-2 observations have not probed the entire spatial extent of the over-density identified in the optical data (see Figure 1) and it is possible that an SMG similar to that identified in Capak et al. (2011) could lie beyond the high sensitivity region in Figure 1. However, the observations are centred on the most over-dense region in the field, perhaps the most likely position for such an object. Obviously the sensitivity of these observations is such that an object with a FIR luminosity (and star-formation rate, dust mass etc) a few times lower than the known SMGs would not have been detected. Given that the known objects represent the extreme of the population, we cannot rule out this possibility.
5 Conclusions
Constraining the thermal dust component of LBGs at is an important step in developing a picture of star-formation and galaxy evolution at high redshift. We have carried out 1.2mm MAMBO-2 observations of a field over-dense in LBGs at , allowing the simultaneous observation of eight LBGs. No individual source is detected at a 1.6 mJy/beam (2 rms) limit. When stacking the flux from the positions of all eight galaxies we obtain a limit of 0.6 mJy/beam for the average emission from the objects. Assuming a dust temperature of K this corresponds to a FIR luminosity and dust mass limit for a typical LBG at of L L⊙ and M M⊙, less than ten per cent of the stellar mass ( M⊙). However, this dust mass limit is dependant on dust temperature, which is yet to be constrained in high redshift galaxies. We estimate a limit to the total star-formation rate in a typical LBG of M⊙ yr-1 using the Kennicutt relation. This compares to minimum star-formation rates of a few M⊙ yr-1 determined from the rest-frame UV emission of typical LBGs. When combined with our previous results on a similarly clustered field (Stanway et al., 2010), we have observed 17 spectroscopically-confirmed LBGs with uniform results, ensuring that these studies robustly characterise this population.
No other objects are identified in the field, ruling out any source similar to the known SMGs lying in the same, highly over-dense structure as the observed LBGs.
The limits on the dust mass within the LBGs and their immediate (kpc) environments weakens the possibility that these objects are relatively unobscured super starburst regions embedded in dust-obscured more massive, larger systems, especially when combined with the limit on the molecular gas emission from our earlier work.
Between this and our previous work we have characterised the molecular gas and dust properties of the typical population of LBGs to the limit of the available instrumentation. With the advent of ALMA we should be able to straightforwardly detect both the cool gas and dust phases of these LBGs and their environments (in targeted observations), even if they prove to have a baryon content towards the lower end of the predicted expectations.
Acknowledgements
LJMD, EM and ERS acknowledge funding from the UK Science and Technology Facilities Council (STFC).
References
- Aravena et al. (2008) Aravena, M., Bertoldi, F., Schinnerer, E., et al. 2008, A&A, 491, 173
- Baker et al. (2001) Baker, A. J., Lutz, D., Genzel, R., Tacconi, L. J., & Lehnert, M. D. 2001, A&A, 372, L37
- Blain et al. (2002) Blain A. W., Smail I., Ivison R. J., Kneib J.-P., Frayer D. T., 2002, PhR, 369, 111
- Blain et al. (2004) Blain A. W., Chapman S. C., Smail I., Ivison R., 2004, ApJ, 611, 725
- Bouwens et al. (2007) Bouwens, R. J., Illingworth, G. D., Franx, M., & Ford, H. 2007, ApJ, 670, 928
- Capak et al. (2011) Capak P. L., et al., 2011, Nature, 470, 233
- Carilli et al. (2010) Carilli, C. L., et al. 2010, ApJ, 714, 1407
- Cazaux & Spaans (2004) Cazaux, S., & Spaans, M. 2004, ApJ, 611, 40
- Chapman et al. (2005) Chapman, S. C., Blain, A. W., Smail, I., & Ivison, R. J. 2005, ApJ, 622, 772
- Chapman & Casey (2009) Chapman, S. C., & Casey, C. M. 2009, MNRAS, 398, 1615
- Cole et al. (2000) Cole, S., Lacey, C. G., Baugh, C. M., & Frenk, C. S. 2000, MNRAS, 319, 168
- Conselice & Arnold (2009) Conselice C. J., Arnold J., 2009, MNRAS, 397, 208
- Conley et al. (2011) Conley, A., et al. 2011, ApJ, 732, L35
- Coppin et al. (2007) Coppin, K. E. K., et al. 2007, ApJ, 665, 936
- Coppin et al. (2009) Coppin K. E. K., et al., 2009, MNRAS, 395, 1905
- Coppin et al. (2010) Coppin, K. E. K., et al. 2010, MNRAS, 407, L103
- Daddi et al. (2009a) Daddi, E., Dannerbauer, H., Stern, D., et al. 2009a, ApJ, 694, 1517
- Daddi et al. (2009b) Daddi, E., Dannerbauer, H., Krips, M., et al. 2009b, ApJ, 695, L176
- Daddi et al. (2010) Daddi, E., Elbaz, D., Walter, F., et al. 2010, ApJ, 714, L118
- Davies et al. (2010) Davies, L. J. M., Bremer, M. N., Stanway, E. R., Birkinshaw, M., & Lehnert, M. D. 2010, MNRAS, 408, L31
- Douglas et al. (2007) Douglas, L. S., Bremer, M. N., Stanway, E. R., Lehnert, M. D. 2007, MNRAS, 376, 1393
- Douglas et al. (2009) Douglas, L. S., Bremer, M. N., Stanway, E. R., Lehnert, M. D., Clowe, D. 2009, MNRAS, 400, 561
- Douglas et al. (2010) Douglas, L. S., Bremer, M. N., Lehnert, M. D., Stanway, E. R., & Milvang-Jensen, B. 2010, MNRAS, 409, 1155
- Finkelstein et al. (2009) Finkelstein, S. L., Rhoads, J. E., Malhotra, S., & Grogin, N. 2009, ApJ, 691, 465
- Gonzalez et al. (2011) Gonzalez, J. E., Lacey, C. G., Baugh, C. M., Frenk, C. S., & Benson, A. J. 2011, arXiv:1105.3731
- Hatsukade et al. (2011) Hatsukade, B., et al. 2011, MNRAS, 411, 102
- Hunt et al. (2005) Hunt, L., Bianchi, S., & Maiolino, R. 2005, A&A, 434, 849
- Kennicutt et al. (1998) Kennicutt, R. C., Jr., Stetson, P. B., Saha, A., et al. 1998, ApJ, 498, 181
- Knudsen et al. (2010) Knudsen, K. K., Kneib, J.-P., Richard, J., Petitpas, G., & Egami, E. 2010, ApJ, 709, 210
- Kohno (2011) Kohno K., 2011, EAS, 52, 23
- Kreysa et al. (1998) Kreysa, E., et al. 1998, Proc. SPIE, 3357, 319
- Kruegel & Siebenmorgen (1994) Kruegel, E., & Siebenmorgen, R. 1994, A&A, 288, 929
- Law et al. (2007) Law, D. R., Steidel, C. C., Erb, D. K., et al. 2007, ApJ, 656, 1
- Maiolino et al. (2004) Maiolino, R., Schneider, R., Oliva, E., Bianchi, S., Ferrara, A., Mannucci, F., Pedani, M., & Roca Sogorb, M. 2004, Nature, 431, 533
- McLure et al. (2009) McLure, R. J., Cirasuolo, M., Dunlop, J. S., Foucaud, S., & Almaini, O. 2009, MNRAS, 395, 2196
- Mo & White (2002) Mo, H. J., & White, S. D. M. 2002, MNRAS, 336, 112
- Negrello et al. (2010) Negrello, M., et al. 2010, Science, 330, 800
- Nilsson et al. (2007) Nilsson, K. K., et al. 2007, A&A, 471, 71
- Oke & Gunn (1983) Oke, J. B. & Gunn, J. E. 1983, ApJ, 266, 713
- Overzier et al. (2009) Overzier, R. A., Guo, Q., Kauffmann, G., De Lucia, G., Bouwens, R., & Lemson, G. 2009, MNRAS, 394, 577
- Priddey & McMahon (2001) Priddey, R. S., & McMahon, R. G. 2001, MNRAS, 324, L17
- Riechers et al. (2010) Riechers, D. A., et al. 2010, ApJ, 720, L131
- Rieke et al. (2009) Rieke, G. H., Alonso-Herrero, A., Weiner, B. J., et al. 2009, ApJ, 692, 556
- Rigopoulou et al. (2010) Rigopoulou, D., Magdis, G., Ivison, R. J., et al. 2010, MNRAS, 409, L7
- Schinnerer et al. (2008) Schinnerer, E., Carilli, C. L., Capak, P., et al. 2008, ApJ, 689, L5
- Smail et al. (2002) Smail I., Ivison R.J., Blain A.W., Kneib J.-P. MNRAS, 331, 495
- Solomon & Vanden Bout (2005) Solomon P. M., Vanden Bout P. A., 2005, ARA&A, 43, 677
- Sobral et al. (2012) Sobral, D., Smail, I., Best, P. N., et al. 2012, arXiv:1202.3436
- Stanway et al. (2008) Stanway, E. R., Bremer, M. N., & Lehnert, M. D. 2008, MNRAS, 385, 493
- Stanway et al. (2008) Stanway E. R., Bremer M. N., Davies L. J. M., Birkinshaw M., Douglas L. S., Lehnert M. D., 2008, ApJ, 687, L1
- Stanway et al. (2010) Stanway, E. R., Bremer, M. N., Davies, L. J. M., & Lehnert, M. D. 2010, MNRAS, 407, L94
- Stark et al. (2009) Stark D. P., Ellis R. S., Bunker A., Bundy K., Targett T., Benson A., Lacy M., 2009, ApJ, 697, 1493
- Thomas et al. (2010) Thomas, D., Maraston, C., Schawinski, K., Sarzi, M., & Silk, J. 2010, MNRAS, 404, 1775
- Vanzella et al. (2009) Vanzella E., Giavalisco M., Dickinson M., Cristiani S., Nonino M., Kuntschner H., Popesso P., Rosati P., Renzini A., Stern D., Cesarsky C., Ferguson H. C., Fosbury R. A. E., 2009, ApJ, 695, 1163
- Verma et al. (2007) Verma A., Lehnert M. D., Förster Schreiber N. M., Bremer M. N., Douglas L., 2007, MNRAS, 377, 1024
- Wang et al. (2008) Wang, R., et al. 2008, ApJ, 687, 848
- Webb et al. (2003) Webb, T. M., et al. 2003, ApJ, 582, 6
- Weiß et al. (2007) Weiß, A., Downes, D., Neri, R., Walter, F., Henkel, C., Wilner, D. J., Wagg, J., & Wiklind, T. 2007, A&A, 467, 955