The size, luminosity and motion of the extreme carbon star IRC+10216 (CW Leonis)
Very Large Array observations of the extreme carbon star IRC+10216 at 7 mm wavelength with 40 milli-arcsecond resolution resolve the object’s radio emission, which forms an almost round uniform disk of 83 milli arcseconds diameter, corresponding to 11 AU (for an assumed distance of 130 pc). We find a brightness temperature of 1630 K for the radio photosphere. Since the emission is optically thick, we can directly estimate IRC+10216’s average luminosity, which is 8600 . This value is in excellent agreement with what is predicted from the period-luminosity relation for carbon-rich Miras. Assuming an effective temperature of 2750 K for IRC+10216, it implies an optical photospheric diameter of 3.8 AU. Our precise determination of IRC+10216’s proper motion fits the picture presented by far-ultraviolet and far-infrared wavelength observations of its interaction region with the interstellar medium (its “astrosphere”): the star moves roughly in the direction expected from the morphology of the termination shock and its astrotail structures. Calculation of its three dimensional velocity and an analysis of the kinematics of its surrounding interstellar medium (ISM) suggest an appreciable relative velocity of 42 km s-1, which is about half the value discussed in recent studies. This suggests a lower (time-averaged) mass loss rate and/or a higher ISM density than previously assumed.
Key Words.:
ISM: molecules – Stars: circumstellar matter1 Introduction
The carbon-rich evolved star IRC+10216 (also known as CW Leonis) is one of the most prominent and best-studied near-infrared (NIR) sources in the sky (Becklin et al. 1969). IRC+10216 is probably a typical carbon star (Herbig & Zappala 1970; Miller 1970) near the end of its lifetime on the asymptotic giant branch (AGB), which is characterized by extreme mass-loss (Habing & Olofsson 2003). This and its proximity, make IRC+10216 a unique object of interest, allowing studies that would be very difficult or impossible for any other source of its kind. Estimated distances, , inferred from modeling the CO emission in its envelope, range from 110–150 pc (Crosas & Menten 1997; Groenewegen et al. 1998); we shall adopt a median value of 130 pc.
IRC+10216’s high mass-loss rate of yr-1 (Crosas & Menten 1997, scaled to 130 pc) results in a dense circumstellar envelope (CSE) whose exceedingly rich chemistry can be easily studied at infrared through submillimeter to radio wavelengths (see, e.g. Cernicharo et al. 1996, 2000; Patel et al. 2011). The innermost part of the envelope, i.e., within 50 AU or 20 stellar radii, and the star itself is hardly observable at visual wavelengths, due to the high extinction of the dust that is abundantly produced in this region. In the infrared (IR) regime, however, IRC+10216 presents a complex and dynamical picture. High spatial resolution imaging obtained with speckle interferometry and/or adaptive optics shows several distinct features on subarcsecond scales that vary over time-scales of years, not only in position but also in luminosity (Osterbart et al. 2000; Weigelt et al. 2002; Leão et al. 2006). Combined data taken in the near/mid-IR , , , , and bands, together with far-IR data, have been used to find a self-consistent model of the star and its envelope (Men’shchikov et al. 2001).
All modeling efforts are hampered, however, by the inability to tell which (or if any) of the observed compact features actually corresponds to the stellar photosphere, with different approaches yielding widely differing conclusions (see above references and Tuthill et al. 2005). Moreover, adaptive optics -band imaging polarimetry by Murakawa et al. (2005) implies that the position of the illumination source (the central star) is different from any of the previously postulated positions. Needless to say, all radiative transfer modeling efforts of this keystone envelope, sophisticated as they may be (see, e.g. Ivezić & Elitzur 1996; Groenewegen 1997; Men’shchikov et al. 2001) severely suffer from the uncertainty of not knowing the position from which the luminosity originates.
Clearly, a direct detection of the star that could unambiguously determine the stellar position would be superior to any of the above indirect methods. One of the objectives of the present study is to determine IRC+10216’s position at short radio wavelengths (7 mm) with an accuracy of a few milli arcseconds (mas) using the NRAO111The National Radio Astronomy Observatory (NRAO) is operated by Associated Universities, Inc., under a cooperative agreement with the National Science Foundation. Very Large Array. In a related project we seek to achieve absolute infrared astrometry to match our accurate radio astrometry. Since the radio position marks the bona fide location of the star, it will thus eventually be possible to unambiguously determine its IR counterpart.
Radio emission from IRC+10216 has been studied at wavelengths of 2 and 1.5 cm (Sahai et al. 1989; Drake et al. 1991). Menten et al. (2006) presented Very Large Array observations at 3.6, 2, and 1.3 cm, which revealed an unresolved source mas and established that the emission is optically thick, i.e., its spectral index, , is ; where flux density, , is . This allows us to address a second goal of the present higher resolution ( mas) study, which is to determine the size and shape of IRC+10216’s radio emission distribution and, using its implied brightness temperature, its luminosity.
Our highly accurate position, combined with published data allow a high quality determination of IRC+10216’s proper motion on the sky. This is an important quantity, given recent ultraviolet and far-infrared (FIR) observations of the interaction region between the star’s expanding circumstellar envelope and the ambient interstellar medium.
This paper has the following structure: In §2 we give an account of our VLA observations. The determination of IRC+10216’s size, accurate position, and proper motion are described in §3. The nature of its radio emission, the luminosity it implies, and its motion through the interstellar medium are discussed in §4.
2 Observations and data processing
2.1 VLA observations
Our VLA observations took place on 2006 February 26 (JD 2453793) with 23 antennas in operation. We used the maximum bandwidth setting provided by the VLA correlator. This comprises 2 intermediate frequency (IF) bands, each with 43 MHz effective bandwidth. We recorded, both, right and left circular polarization in each IF. One IF was centered at 43.3149 GHz, the other at a 50 MHz higher frequency.
In order to ensure optimal calibration for our high frequency data, we employed the “fast switching” technique first described by Lim et al. (1998). Over 7.5 h, we switched between IRC+10216 and one of the two nearby calibrators, J0943+170 or J0954+177. We used a cycle with 60 seconds on IRC+10216 and 40 seconds on one of the calibrators, which we repeated for 1–1.5 h segments. In order to check the effectiveness of our observing mode, between segments we switched between the two calibrator sources for min.
We improved the VLA antennas’ pointing accuracy by updating pointing offsets once an hour, by observing J0954+177 in “interferometer pointing mode”. For higher sensitivity these pointing scans were taken in X-band (8.4 GHz). The corrections to the pointing model were applied real time.
While processing the data we found that the position of J0943+170 as listed in the VLA calibrator database was insufficiently accurate, given the precision warranted by our data. We adopted better positions for both calibrator sources from the VLBI Global Solution 2008b Astro Catalog maintained at the NASA Goddard Space Flight Center222http://lacerta.gsfc.nasa.gov/vlbi/solutions/; see Petrov et al. (2008). We used the task CLCOR within NRAO’s Astronomical Image Processing System (AIPS) to correct our data for the improved positions. The adopted calibrator positions, as well as the position of IRC+10216 determined as described in §3, are listed in Table 1.
| Source | |||||
| (∘) | (∘) | (Jy) | |||
| IRC+10216 (CW Leo) | s | ′′ | – | – | 0.013 |
| J0943+170 | 09 43 17.22396(2) | +17 02 18.9628(12) | 0.106 | ||
| J0954+177 | 09 54 56.82362(5) | +17 43 31.2222(2) | 0.234 | ||
| 3C286 (J1331+3030) | 13 31 08.28806(2) | +30 30 32.9592(5) | – | – | 1.455 |
Notes. Measured position for IRC+10216 (epoch 2006.16) and the adopted positions for the calibrator sources are given in columns two and three in J2000 coordinates. Calibrator positions are taken from the VLBI Global Solution 2008b Astro Catalogue available on the NASA Goddard Spaceflight Center Geodetic VLBI group’s website; see also Petrov et al. (2008). Numbers in parentheses give the error in the last quoted digit(s). For the complex-gain calibrators J0943+170 and J0954+177, column four lists their angular separations from IRC+10216. The separation between these two calibrators is . Column six lists the measured flux densities based on the assumed value for 3C286. We estimate the flux density scale is accurate to %.
2.2 Calibration and initial -plane and image analysis
Calibration and image processing was performed with AIPS. While loading the data into AIPS (using the task FILLM), corrections for the elevation-dependent gain curve and atmospheric transmission were applied. Visual inspection of the measured visibilities revealed a minimal amount of flawed data. The absolute flux density, , scale was established by an observation of 3C286, which has Jy at 43.317 GHz. Since this source is slightly resolved at our observing frequency, we used a clean-component model downloaded from the VLA website to determine amplitude and phase solutions using the AIPS task CALIB. Then we used CALIB to determine amplitude and phase solutions for J0954+177 and J0943+170, for which we bootstrapped flux densities of 0.234 and 0.106 Jy, respectively, by comparing with the solutions found for 3C286. Using CLCAL, we applied the amplitude and phase corrections to the IRC+10216 data.
Using IMAGR we produced an image of IRC+10216 and found the star offset in right ascension and declination direction, , by ′′ ′′ relative to our phase-center position. To enable subsequent -domain analysis, we used UVFIX to shift the visibility data to the center of the uv-plane. We then used IMAGR to produce images of the shifted uv-dataset, both with uniform and natural weighting (see §3.1)
3 Results
3.1 Imaging of IRC+10216
| Restoring beam | Deconvolved source | |||||||
| M | P.A.(B) | P.A.(S) | ||||||
| (mas) | (mas) | (∘, E of N) | (mas) | (mas) | (∘, E of N) | (mJy beam-1) | (mJy) | |
| Imaging with natural weighting – Gaussian model | ||||||||
| J | 61 | 49 | ||||||
| 2630 | ||||||||
| Imaging with uniform weighting – Gaussian model | ||||||||
| J | 44 | 39 | ||||||
| 2450 | ||||||||
| Visibility versus -distance – Gaussian modeling | ||||||||
| O | – | – | – | 3 | – | |||
| L | – | – | – | – | – | – | ||
| Visibility versus -distance – uniform disk modeling | ||||||||
| O | – | – | – | – | ||||
| L | – | – | – | – | – | – | ||
Notes. The first four lines give results of Gaussian fitting, line 1 and 2 to a naturally weighted image and a uniformly weighted image, line 3 and 4 to visibility domain data. Lines 5 and 6 give the results for fits with a uniform disk model. The first column denotes the method (M) used: J for JMFIT and O for OMFIT (AIPS tasks). L stand for our independent least-squares program. For the first two lines, the second to forth columns give the FWHM major and minor axes and the position angle of the restoring beam determined by IMAGR, while the fifth to seventh columns list the same quantities for IRC+10216’s brightness distribution and the eighth column gives fitted peak brightness. For all fits, the ninth gives the integrated flux density (the ”zero spacing” flux). JMFIT and OMFIT fitted elliptical brightness models, whereas our least squares program used a circular model.

3.1.1 The size and brightness temperature of the radio emission
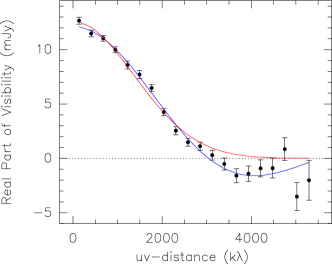
Table 2 shows the result of fits to IRC+10216’s observed brightness distribution at 43.3 GHz. Fits were made to the image (using JMFIT) as well as to its corresponding -plane data (using OMFIT). We solved for the peak brightness and source size using elliptical models. Our results, represented in Table 2 and Fig. 2, indicate an almost circular source. Given this, we also performed fits with our independently developed least-squares fitting program, which assumes circular symmetry. This has the advantage that it delivers useful statistical quantities. An inspection of Fig. 2 indicates that the uniform disk model (blue line) matches the data much better than the Gaussian (red line). This is verified by a comparison of the reduced values, which are 1.35 for the disk and 3.07 for the Gaussian model. The best fit uniform disk has a diameter, , of mas, corresponding to AU ( pc) and a brightness temperature, , of K. The uncertainty in is dominated by the 5% estimated uncertainty of our absolute calibration.
3.2 Position and proper motion of IRC+10216
3.2.1 Position
Using JMFIT, we determined the best-fit position for IRC+10216 listed in Table 1. The formal precision returned by JMFIT in the eastward, , and northward, , directions are 0.4 mas, much smaller than the values quoted in the table. To arrive at the listed, more realistic values for these quantities, we performed several tests. First, we only allowed phase and amplitude corrections determined for J0943+170 (in the following the “weak” calibrator) to be used to calibrate the IRC+10216 data. About half of the data, those taken while switching between IRC+10216 and the ”strong” calibrator, J0954+177, were discarded. Second, vice verse, we calibrated IRC+10216 only with the strong calibrator, discarding the data taken while switching with the weak calibrator. We then imaged both calibrated datasets and again used JMFIT to determine the resultant positions. We find position centroids with offsets, (), relative to the position in Table 1 of ( mas, mas) and (+2.8 mas, +5.9 mas), respectively. IRC+10216’s best fit flux density determined from both of these sub-datasets agreed with that determined from the whole dataset to within 2%.
To get a further estimate of the accuracy of our position determination, we calibrated the -data of the weak calibrator with the phase and amplitude corrections determined for the strong calibrator. Imaging of the former retrieved J09433+170’s position with an offset of () = ( mas, mas) relative to its nominal value quoted above. Calibrating, vice versa, strong with weak calibrator retrieved J0954+177’s position at an offset of (+6.5 mas, +9.1 mas). In this exercise, both calibrator sources appeared unresolved and JMFIT returned formal upper limits of 7 and 10 mas for sizes of the weak and the strong calibrator, respectively. The flux densities of both were found to within a few percent of the bootstrapped value quoted above. We note that the weak and strong calibrator databases only contained 20% and 14% of the number of visibilities of the IRC+10216 database.
As listed in Table 1, the separation on the sky between IRC+10216 and J0943+170 and J0954+177 is and , respectively, and thus are 1.4 and 3.1 times larger than the arc between the two calibrators. Thus, it seems prudent to scale the position errors resulting from the calibrator-calibrator experiment by the ratio of the and differences. This would result in an absolute position uncertainty of mas in each coordinate. We conservatively increase this to 10 mas, because of the fact that our calibrators are both offset in declination and astrometric accuracy is expected to be worse for target-calibrator separations that are mostly in the north-south direction.
3.2.2 Proper motion
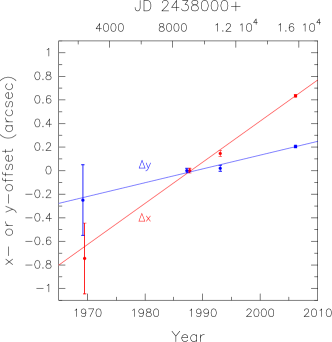
Becklin et al. (1969), in the very first publication on IRC+10216, placed an upper limit of 30 mas yr-1 on its proper motion. These authors compared a position measured on a plate from 1969 with the position from an E-plate of the Palomar Sky Survey taken in 1954. Menten et al. (2006) used positions determined from VLA observations in 1987 and 1993 (with uncertainties of mas) to determine IRC+10216’s proper motion in - and -direction, (), of ) mas yr-1. Combining these data with our more accurate position from 2006 (Table 1), we calculate a proper motion of () mas yr-1 (see Fig. 3). For a distance of 130 pc, these angular motions correspond to linear speeds of 21.6 km s-1 eastward and 7.4 km s-1 northward. This proper motion is a heliocentric value and needs to be corrected for the solar motion. The resulting values are 36.3 km s-1 eastward and 13.2 km s-1 northward, implying a speed in the plane of the sky of 38.6 km s-1 along a position angle of 70∘ (E of N). We note that the motion we determine is in the opposite direction of that implied by the binary model for IRC+10216, which Guelin et al. (1993) propose to explain an offset they find between the star and the centroid of the C4H emission imaged with the IRAM Plateau de Bure interferometer.
Roeser et al. (2010) combine data from the optical USNO-B1.0 all sky survey and the Two Micron All Sky Survey (2MASS) to calculate astrometric parameters for common sources, IRC+10216 amongst them. In the resulting PPMXL catalog, IRC+10216’s proper motion is listed as () = () mas yr-1. Their eastward motion is in agreement with ours, while their northward motion is discrepant by . Given the complex structure of IRC+10216’s innermost CSE and the significant variation of its morphology with wavelength, combined with the uncertainty of whether or not the stellar photosphere is observed at optical and IR wavelengths (see Sect. 1), one might question the reliability of the PPMXL proper motion determination.
4 Discussion
4.1 Properties and nature of the radio emission
4.1.1 Size and luminosity
Our measured radio brightness temperature of 1660 K is definitely lower than IRC+10216’s optical effective temperature, . After critically evaluating models of AGB stars and a wide range of data (their Table 4) Men’shchikov et al. (2001) conclude that lies between between 2500 and 2800 K. Thus, our radio size and temperature are in line with what Reid & Menten (1997, 2007) find for the “radio photosphere,” which surrounds the optical photospheres of M-type (oxygen-rich) AGB stars. They find that the radius of the radio photosphere is about twice the stellar radius and the temperatures is about lower than at the stellar surface. Modeling the ionization balance and opacity sources in these regions (mainly H- free-free interactions), Reid & Menten (1997) predict a spectral index, , for the radio emission of 1.86.
From measurements taken between 8 and 680 GHz, Menten et al. (2006) determined the radio-to-submillimeter spectral index of IRC+10216’s radio emission to be , which is steeper than the value predicted for radio photospheres by Reid & Menten (1997) and consistent with optically-thick blackbody emission in the Rayleigh-Jeans regime (). Since we are observing emission consistent with a blackbody, our measured diameter, and brightness temperature, , directly deliver IRC+10216’s bolometric luminosity, , via the Stefan-Boltzmann law: , where is the Stefan-Boltzmann constant. With K and = AU (83 mas at pc), we calculate , or . The last uncertainty does not include a contribution from the distance uncertainty.
Although IRC+10216’s bolometric luminosity varies by a factor of 2.5 over a light cycle, model calculations predict that its radio flux varies by no more than % between minimum and maximum (Men’shchikov et al. 2001, and pers. comm.). This is in excellent agreement with IRC+10216’s m light curve derived from data taken with the James-Clerk-Maxwell-Telescope333http://www.jach.hawaii.edu/JCMT/continuum/ and within their errors consistent with the radio data discussed by Menten et al. (2006). Given this, a luminosity derived from radio data at any time is close to the star’s average luminosity. Our estimate gains in reliability since we were able to determine IRC+10216’s long-wavelength (infrared) phase, 444Conventionally, the phase, , quoted for an AGB star is the time, measured as a fraction of its period, that has passed since optical maximum. Due to molecule formation, for most AGB stars, the IR maximum lags periods behind the optical maximum. This is well-established for oxygen-rich Miras, but less so for carbon-rich ones (Smith et al. 2006)., at the time of our VLA observations. As described in Appendix A, we acquired data to determine a reliable value for , of 0.75. This means the luminosity we have determined is very close to the average value indeed.
The (average) luminosity we determine, 8640 (for pc), is lower than the value of 14000 that Groenewegen et al. (1998) find consistent with their multi-transition modeling of the CO emission from IRC+10216’s CSE, while Crosas & Menten (1997) and De Beck et al. (2012) find 11000 and 8500 , respectively, in similar analyses (all for pc).
If we assume K for IRC+10216’s effective temperature, i.e., the median value considered by Men’shchikov et al. (2001) for their modeling, we calculate a diameter of 3.8 AU for the star’s photosphere. This corresponds to times the major axis of Mars’ orbit.
The derived luminosity is comparable to the value one derives from the revised period–luminosity relation for carbon-rich Miras established by Groenewegen & Whitelock (1996). For our best fit period, 630 d (see Appendix A), this relation predicts a luminosity of 9830 . Finally, we note that, remarkably, Becklin et al. (1969) in the very first publication on IRC+10216 derive W for its luminosity (assuming pc), which corresponds to 11000 for pc.
4.1.2 Shape of the radio photosphere
Performing VLA observations with angular resolution and wavelength similar to ours, Reid & Menten (2007) determined the shapes and sizes of the radio photospheres of three M-type AGB stars ( Ceti, R Leo and W Hya); the latter were all close to 6 AU. While Ceti’s radio photosphere has, like IRC+10216’s, an almost circular shape, those of R Leo and W Hya appear to be significantly elongated. Formally, we find a flattening, of for IRC+10216 (where and are the major and minor axis sizes, respectively). From Table 2 of Reid & Menten (1997) we calculate and for Ceti, R Leo and W Hya, respectively
IRC+10216’s radio photosphere is almost perfectly round, comparable to that of the much lower mass-loss star Ceti. Given its high mass-loss rate, IRC+10216 has been conjectured to be on the verge of developing into a protoplanetary nebula (PPN) and asymmetries in its circumstellar material have been interpreted as signs for the onset of bipolarity (Osterbart et al. 2000). Here we emphasize that the radio emission is consistent with an extended photospheric origin and does not show the characteristics of a developing ultracompact HII region as observed in the more evolved PPN CRL 618. For this object, which has a times higher mass loss rate than IRC+10216 (Young et al. 1992), VLA observations show an enhanced radio flux associated with an extended ionized region that is elongated along the PPN’s bipolar outflow axis (Kwok & Bignell 1984; Martin-Pintado et al. 1993)
4.2 Motion through the interstellar medium
Recent observations at ultraviolet, FIR and submillimeter wavelengths provide evidence for an interaction of IRC+10216’s outflowing envelope and the ambient interstellar medium (ISM). Knowledge of the star’s motion is an important parameter in any modeling of this phenomenon.
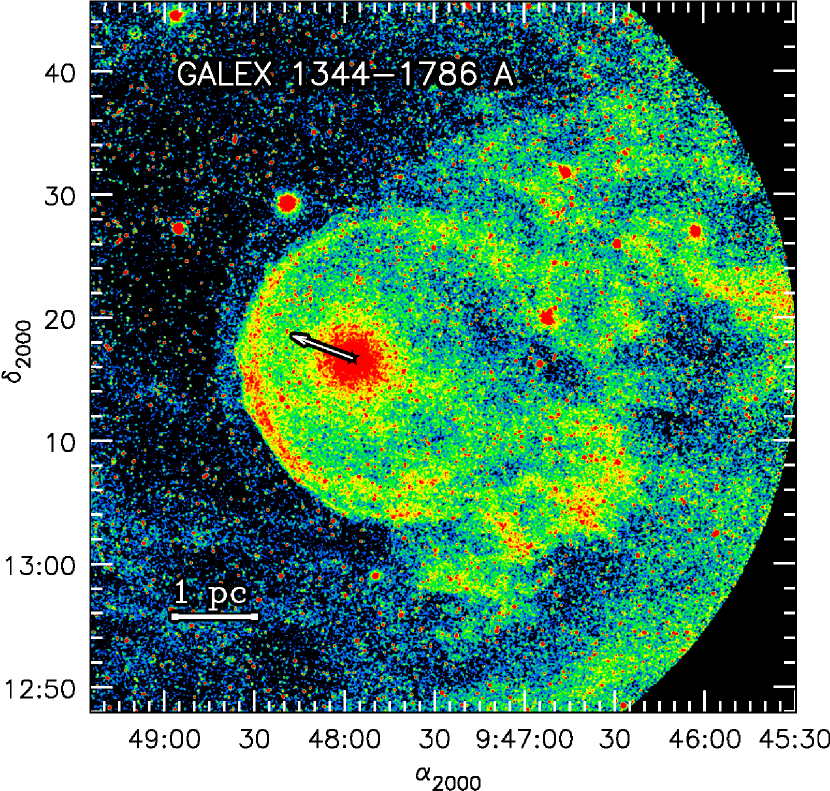
Sahai & Chronopoulos (2010) present near and far ultraviolet (NUV and FUV) imagery obtained with the Galaxy Evolution Explorer (GALEX) of an area of degree diameter centered on IRC+10216, which shows the object’s “astrosphere” (Fig. 4). It exhibits a textbook picture of phenomena expected from the interaction of a circumstellar outflow with the ambient interstellar medium: an astrosheath, astropause, a termination shock, and an astrotail (see Fig. 2 of Ueta 2008, for an illustration of these terms). An arc-like segment of the termination shock is also detected. The arrow in (Fig. 4) shows the direction of IRC+10216’s proper motion (corrected for the Solar motion) and the distance traveled by the star in 5 000 yr.
Remarkably, the termination shock also manifests itself as a dust shell that has been imaged with Herschel at 160 and 250 m with the Photodetector Array Camera and Spectrometer (PACS) and the SPectral and Photometric Imaging REceiver (SPIRE) (Ladjal et al. 2010). Moreover, Decin et al. (2011), using PACS at 70, 100, and 160 m, find multiple concentric dust shells with the outermost one reaching almost to the termination shock.
For modeling such interactions between stellar winds and the interstellar medium (ISM), one critical parameter is the velocity of the star relative to the ISM, v∗, which we can estimate from the proper motion we have derived in Sect. 3.2.2; see Fig. 4. In the FUV image the astrosheath forms an incomplete edge brightened shell (the termination shock) around the stellar position. However, this shell is broken up toward the WSW–SW, in which direction (most of) the structures making up the astrotail extend beyond its boundaries. We note that this is the direction expected for the astrotail for the proper motion vector we determine, which has a position angle of 70∘ (E of N).
Theoretical studies (van Buren & McCray 1988; Wilkin 1996) have yielded a formula for the scale, , at which the ram pressure of the freely flowing wind from a moving star equals that of the interstellar medium. This is measured as the distance between the termination shock and the star along the astropause’s symmetry axis and is a function of mass loss rate, , terminal wind velocity, vw, mean molecular mass per atom, , ISM number density, , and v∗. Solving for the stellar velocity, we have
Using the determined by Sahai & Chronopoulos (2010), adopting of yr-1 (see 1), and vw = 14 km s-1), and assuming a low density atomic ISM ( and and cm-3), respectively, Sahai & Chronopoulos (2010) derive a stellar velocity of 91 km s-1. Ladjal et al. (2010) obtain a slightly higher value of km s-1 (for cm-3). These values assume that the astropause’s symmetry axis lies in the sky plane.
To compare the above velocities with our proper motion, we must transform our heliocentric value into the galactic reference (LSR) frame and correct for the solar motion. Following the instructions of Johnson & Soderblom (1987), we transform our heliocentric proper motions and radial velocity, 555We calculate this heliocentric velocity for IRC+10216 assuming an LSR radial velocity, , of km s-1, using the solar motion vector km s-1, derived from Hipparchos data by Dehnen & Binney (1998). Note that our value of differs from the often quoted km s-1 (as, e.g., given in the catalog compiled by Loup et al. 1993). The latter value is derived from low- CO line profiles that over estimate the LSR velocity because of self absorption in their blue wings., of km s-1 to a velocity vector in the galactic frame of reference, , which has to be corrected for the solar motion, to, finally, obtain in the LSR frame. Here, the components , , and are positive in the directions of the Galactic center, Galactic rotation and the North Galactic pole. If we do this transformation, we obtain = (+34,+23,+10) km s-1 for IRC+10216, which has an absolute value of 42 km s-1 with an estimated uncertainty of less than 10 km s-1.
We now have determined the three dimensional motion vector for IRC+10126 in the LSR frame. What we do not know is the motion of the ISM in that frame. For the radial component of this motion, we can get some insight into this question by examining our knowledge of the ISM around the star. As discussed in Appendix B, the radial component of IRC+10216’s motion is between and km s-1 lower than that to its ambient ISM.
Having no other constraints, we assume that this ISM is partaking in Galactic rotation with no peculiar velocity contribution, i.e., = (0,0,0) km s-1. Then, our best estimate value of the motion of IRC+10216 relative to its ambient ISM, 42 km s-1, is a factor of –3 smaller than the values quoted by Ladjal et al. (2010) and Sahai & Chronopoulos (2010).
We note that several assumptions made by the above authors could have led to significant uncertainties in their estimate of . For one, mass loss rates of the order of IRC+10216’s, yr-1, (or even higher) are characteristic with the latest stages of a star’s AGB lifetime (Volk et al. 2000; Perinotto et al. 2004). It is thus very unlikely, that IRC+10216’s mass loss rate had its present very high value over the several times yr time scale it took the astrosphere to be established. In fact, concentric shells in CSEs as observed around IRC+10216 by Decin et al. (2011), have been interpreted as evidence for variable mass loss and are possibly the result of multiple thermal pulses (Olofsson et al. 1990; Zijlstra et al. 1992).
Second, the ambient ISM’s density, for which Sahai & Chronopoulos (2010) assume 1 cm-3, is poorly constrained. In the case of Mira ( Ceti), which also excites FUV emission while moving through the ISM (Martin et al. 2007), modeling suggests a 50 times smaller value (Wareing et al. 2007; Ueta 2008). Excitation of molecular hydrogen (H2) by hot electrons is considered the best candidate mechanism for the FUV emission from IRC+10216’s astrosphere (Martin et al. 2007; Sahai & Chronopoulos 2010). The presence of molecular hydrogen would imply that IRC+10216 is moving within a diffuse molecular cloud. Diffuse molecular clouds, however, have hydrogen number densities of 100–500 cm-1 (Snow & McCall 2006), significantly larger than the 1 cm-1 assumed by Sahai & Chronopoulos (2010) (and ). As a caveat, we point out that Mira’s FUV emission distribution looks distinctly different from IRC+10216’s. It has a very long, much more turbulent tail with an elongated cometary shape and, while it has a pronounced bow shock, it lacks the thin ring making up more than a semi circle that marks the boundary of IRC+10216’s astropause. For the latter, hopefully, further modeling will result in a more meaningful estimate of the ISM density and other quantities. At present, the above facts, plus the unknown inclination angle, prohibit a meaningful estimate of from the UV observations. Vice versa, we note that even if we assumed that were equal to our estimated speed (42 km s-1) the uncertainties addressed above would make any conclusions based on the UV emission of IRC+10216 and its envelope, e.g., on the duration of the AGB phase, extremely uncertain.
5 Conclusions
Using the VLA we have imaged the radio emission from the archetypical high mass loss carbon-rich AGB star IRC+10216. We obtain a precise measure of the size of its radio emission (83 mas) and its brightness temperature (1660 K). Since the emission is consistent with arising from a black body, these quantities, together with the assumed distance of 130 pc, determine the average stellar luminosity to be 8640 . This value is in excellent agreement with what is predicted from the period-luminosity relation for carbon Miras.
Our position determination, with milli arcsecond accuracy, together with older data, allow a determination of IRC+10216’ s proper motion. After correcting for the solar motion, we find that the star moves with a velocity of 39 km s-1 in the plane of the sky in east-northeastern direction (position angle 70∘) and has a velocity of 42 km s-1 with respect to the LSR. The direction of this motion is roughly consistent with FUV and FIR images that show an extended astrosphere around IRC+10216, which has a broken shell and tail-like features in the opposite direction. Our calculation of the star’s three dimensional velocity and an analysis of the kinematics of its surrounding ISM suggest a lower relative velocity than derived in recent studies. This suggests a lower (time-averaged) mass loss rate and/or a higher ISM density than previously assumed.
Acknowledgements.
We thank the group of V. I. Shenavrin for making their IR data publicly available and O. Taranova for explanatory remarks concerning the light curves. We are grateful to Alexander Men‘shchikov for providing information on his model calculations, Bo Zhang and Andreas Brunthaler for independent model fitting, Bryan Butler for help with OMFIT and Martin Groenewegen for a clarifying remark.Appendix A Phase determination for the epoch of the VLA observations
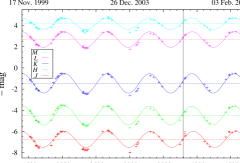
In order to derive the phase of IRC+10216’s light curve at the epoch of our VLA observations (2006 February 23), we used infrared photometry from Shenavrin et al. (2011). This compilation consists of 310 measurements in the bands obtained between 1999 December 10 and 2008 November 11 (see Fig. 5). Each of the light curves was interpolated by a cosine fit using an implementation of the nonlinear least-squares Marquardt-Levenberg algorithm in gnuplot666http://www.gnuplot.info. The period (), the epoch of the chosen maximum (JDmax), the average magnitude, and the amplitude of variations were treated as free parameters. For the bands, this procedure resulted in periods between 628 and 632 days with typical uncertainty of 1 day, and the moment of maximum between 2454550 and 2454560 with typical uncertainty of 4 days. The light curve has slightly poorer quality data and the fit gave results slightly different than for the other bands (=638.5 and JDmax=2454585.0) and was discarded from the further analysis. The combined values for the light curves, in terms of weighed-mean and rms, are =630.02.9 days and JDmax=2454554.07.4. This is consistent with the range of values Le Bertre (1992) determined for from monitoring in different IR bands, 635–670 d (with an average of 649 d). His data were taken in the mid 1980s over a time range of duration less than half than that of our dataset. We next used these values to compute the phase of our VLA observations, which gave =0.790.06 (where =0 corresponds to the maximum brightness). This result agrees very well with the value of =0.72 computed from the stellar luminosity variations given in Men’shchikov et al. (2001) (their Eq. 1), which was based on IR variability of the source between 1965 and 1998.
Appendix B On the radial component of the motion of IRC+10216 relative to its local ISM
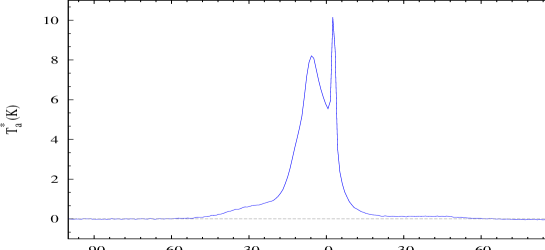
Insight into the interstellar vicinity of IRC+10216 can be gained from H I observations toward the source and around it. For this purpose we extracted a data cube from the GALFA survey (Peek et al. 2011), which covers the full astropause of IRC+10216 and a large region around it at a resolution of 4′. The H I emission, although inhomogeneous on angular scales comparable to the size of the astropause, is well represented by the profile shown in Fig. 6. It is dominated by two components centered around –5 km s-1 and +3 km s-1 and with FWHM line widths of 11 and 1.5 km s-1, respectively. The broader component has very extended wings seen from –60 to 60 km s-1. At some positions around the astropause, a weaker component can be seen centered at about –25 km s-1. There are no morphological arguments for any connection of the observed emission with the astrosphere of IRC+10216. The H I data itself do not allow to distinguish which components can be physically collocated with the star, if any.
Much has been learned about the ISM toward IRC+10216 by studies of absorption lines seen in optical spectra of nearby field stars. Kendall et al. (2002) identified two stars at angular distances of 37″ and 137″ from the position of IRC+10216, which are located behind its circumstellar envelope (at spectro/photometric distances of 0.5 kpc and 1.4 kpc). The resonance lines of Na I and K I show clear signatures of the CSE material but do not show any extra component that could be identified with the ISM. It cannot be ruled out, however, that some atomic absorption is hiding within the strong profiles of the circumstellar absorption. The same authors find the diffuse interstellar band (DIB) at 6284 Å in the spectra of the background stars at km s-1 (corresponding to km s-1) which they interpret as an ISM feature. They find the same velocity component in the profile of the Na I lines of a star which is seen outside the astrosphere of IRC+10216 (25 away from the the stellar position) and is located at a distance of 55 pc. This suggests that the DIB originates in a nearby, foreground cloud. In another approach to the same observational material, Mauron & Huggins (2010) found absorption features of Ca II centered at the expected velocity of the circumstellar material but broader than the K I lines. One interpretation is that interstellar material is partially responsible for those features, but a fully circumstellar origin cannot be excluded and is actually suggested by the symmetric broadening of the profiles.
These optical studies indicate that the H I emission at positive LSR velocities most likely arises in far, background clouds, while the component at –10 km s-1 is probably related to a foreground cloud. Given the monotonic character of Galactic rotation, it is very unlikely that gas at even more negative velocities is situated between these two mentioned components, so it is reasonable to conclude that also clouds at velocities lower than –10 km s-1 are foreground objects. The monotonicity of Galactic rotation and our results for IRC+10216’s motion discussed above also imply that the star is moving though a medium which has an LSR velocity somewhere between km s-1 and 3 km s-1. Given that IRC+10216’s LSR velocity is km s-1, the radial component of its motion is between and km s-1 smaller than that to its ambient ISM.
References
- Becklin et al. (1969) Becklin, E. E., Frogel, J. A., Hyland, A. R., Kristian, J., & Neugebauer, G. 1969, ApJ, 158, L133
- Cernicharo et al. (1996) Cernicharo, J., Barlow, M. J., Gonzalez-Alfonso, E., et al. 1996, A&A, 315, L201
- Cernicharo et al. (2000) Cernicharo, J., Guélin, M., & Kahane, C. 2000, A&AS, 142, 181
- Crosas & Menten (1997) Crosas, M. & Menten, K. M. 1997, ApJ, 483, 913
- De Beck et al. (2012) De Beck, E., Lombaert, R., Agúndez, M., et al. 2012, A&A, 539, A108
- Decin et al. (2011) Decin, L., Royer, P., Cox, N. L. J., et al. 2011, A&A, 534, A1
- Dehnen & Binney (1998) Dehnen, W. & Binney, J. J. 1998, MNRAS, 298, 387
- Drake et al. (1991) Drake, S. A., Linsky, J. L., Judge, P. G., & Elitzur, M. 1991, AJ, 101, 230
- Groenewegen (1997) Groenewegen, M. A. T. 1997, A&A, 317, 503
- Groenewegen et al. (1998) Groenewegen, M. A. T., van der Veen, W. E. C. J., & Matthews, H. E. 1998, A&A, 338, 491
- Groenewegen & Whitelock (1996) Groenewegen, M. A. T. & Whitelock, P. A. 1996, MNRAS, 281, 1347
- Guelin et al. (1993) Guelin, M., Lucas, R., & Cernicharo, J. 1993, A&A, 280, L19
- Habing & Olofsson (2003) Habing, H. J. & Olofsson, H., eds. 2003, Asymptotic giant branch stars
- Herbig & Zappala (1970) Herbig, G. H. & Zappala, R. R. 1970, ApJ, 162, L15
- Ivezić & Elitzur (1996) Ivezić, Z. & Elitzur, M. 1996, MNRAS, 279, 1019
- Johnson & Soderblom (1987) Johnson, D. R. H. & Soderblom, D. R. 1987, AJ, 93, 864
- Kendall et al. (2002) Kendall, T. R., Mauron, N., McCombie, J., & Sarre, P. J. 2002, A&A, 387, 624
- Kwok & Bignell (1984) Kwok, S. & Bignell, R. C. 1984, ApJ, 276, 544
- Ladjal et al. (2010) Ladjal, D., Barlow, M. J., Groenewegen, M. A. T., et al. 2010, A&A, 518, L141
- Leão et al. (2006) Leão, I. C., de Laverny, P., Mékarnia, D., de Medeiros, J. R., & Vandame, B. 2006, A&A, 455, 187
- Le Bertre (1992) Le Bertre, T. 1992, A&AS, 94, 377
- Lim et al. (1998) Lim, J., Carilli, C. L., White, S. M., Beasley, A. J., & Marson, R. G. 1998, Nature, 392, 575
- Loup et al. (1993) Loup, C., Forveille, T., Omont, A., & Paul, J. F. 1993, A&AS, 99, 291
- Martin et al. (2007) Martin, D. C., Seibert, M., Neill, J. D., et al. 2007, Nature, 448, 780
- Martin-Pintado et al. (1993) Martin-Pintado, J., Gaume, R., Bachiller, R., & Johnson, K. 1993, ApJ, 419, 725
- Mauron & Huggins (2010) Mauron, N. & Huggins, P. J. 2010, A&A, 513, A31
- Men’shchikov et al. (2001) Men’shchikov, A. B., Balega, Y., Blöcker, T., Osterbart, R., & Weigelt, G. 2001, A&A, 368, 497
- Menten et al. (2006) Menten, K. M., Reid, M. J., Krügel, E., Claussen, M. J., & Sahai, R. 2006, A&A, 453, 301
- Miller (1970) Miller, J. S. 1970, ApJ, 161, L95
- Murakawa et al. (2005) Murakawa, K., Suto, H., Oya, S., et al. 2005, A&A, 436, 601
- Olofsson et al. (1990) Olofsson, H., Carlstrom, U., Eriksson, K., Gustafsson, B., & Willson, L. A. 1990, A&A, 230, L13
- Osterbart et al. (2000) Osterbart, R., Balega, Y. Y., Blöcker, T., Men’shchikov, A. B., & Weigelt, G. 2000, A&A, 357, 169
- Patel et al. (2011) Patel, N. A., Young, K. H., Gottlieb, C. A., et al. 2011, ApJS, 193, 17
- Peek et al. (2011) Peek, J. E. G., Heiles, C., Douglas, K. A., et al. 2011, ApJS, 194, 20
- Perinotto et al. (2004) Perinotto, M., Schönberner, D., Steffen, M., & Calonaci, C. 2004, A&A, 414, 993
- Petrov et al. (2008) Petrov, L., Kovalev, Y. Y., Fomalont, E. B., & Gordon, D. 2008, AJ, 136, 580
- Reid & Menten (1997) Reid, M. J. & Menten, K. M. 1997, ApJ, 476, 327
- Reid & Menten (2007) Reid, M. J. & Menten, K. M. 2007, ApJ, 671, 2068
- Roeser et al. (2010) Roeser, S., Demleitner, M., & Schilbach, E. 2010, AJ, 139, 2440
- Sahai & Chronopoulos (2010) Sahai, R. & Chronopoulos, C. K. 2010, ApJ, 711, L53
- Sahai et al. (1989) Sahai, R., Claussen, M. J., & Masson, C. R. 1989, A&A, 220, 92
- Shenavrin et al. (2011) Shenavrin, V. I., Taranova, O. G., & Nadzhip, A. E. 2011, Astronomy Reports, 55, 31
- Smith et al. (2006) Smith, B. J., Price, S. D., & Moffett, A. J. 2006, AJ, 131, 612
- Snow & McCall (2006) Snow, T. P. & McCall, B. J. 2006, ARA&A, 44, 367
- Tuthill et al. (2005) Tuthill, P. G., Monnier, J. D., & Danchi, W. C. 2005, ApJ, 624, 352
- Ueta (2008) Ueta, T. 2008, ApJ, 687, L33
- van Buren & McCray (1988) van Buren, D. & McCray, R. 1988, ApJ, 329, L93
- Volk et al. (2000) Volk, K., Xiong, G.-Z., & Kwok, S. 2000, ApJ, 530, 408
- Wareing et al. (2007) Wareing, C. J., Zijlstra, A. A., O’Brien, T. J., & Seibert, M. 2007, ApJ, 670, L125
- Weigelt et al. (2002) Weigelt, G., Balega, Y. Y., Blöcker, T., et al. 2002, A&A, 392, 131
- Wilkin (1996) Wilkin, F. P. 1996, ApJ, 459, L31
- Young et al. (1992) Young, K., Serabyn, G., Phillips, T. G., et al. 1992, ApJ, 385, 265
- Zijlstra et al. (1992) Zijlstra, A. A., Loup, C., Waters, L. B. F. M., & de Jong, T. 1992, A&A, 265, L5