A Central Excess of Stripped-Envelope Supernovae within Disturbed Galaxies
Abstract
This paper presents an analysis of core-collapse supernova distributions in isolated and interacting host galaxies, paying close attention to the selection effects involved in conducting host galaxy supernova studies. When taking into account all of the selection effects within our host galaxy sample, we draw the following conclusions:
-
1.
Within interacting, or ‘disturbed’, systems there is a real, and statistically significant, increase in the fraction of stripped-envelope supernovae in the central regions. A discussion into what may cause this increased fraction, compared to the more common type IIP supernovae, and type II supernovae without sub-classifications, is presented. Selection effects are shown not to drive this result, and so we propose that this study provides direct evidence for a high-mass weighted initial mass function within the central regions of disturbed galaxies.
-
2.
Within ‘undisturbed’ spiral galaxies the radial distribution of type Ib and type Ic supernovae is statistically very different, with the latter showing a more centrally concentrated distribution. This could be driven by metallicity gradients in these undisturbed galaxies, or radial variations in other properties (binarity or stellar rotation) driving envelope loss in progenitor stars. This result is not found in ‘disturbed’ systems, where the distributions of type Ib and Ic supernovae are consistent.
keywords:
Galaxies : interactions – galaxies : fundamental parameters - galaxies : starburst – supernovae : general1 Introduction
The host galaxies of core-collapse supernovae (CCSNe) give crucial information when trying to determine the progenitors of these explosions, and have led to some important breakthroughs in the study of CCSNe. These include the almost exclusive presence of CCSNe in late-type galaxies (e.g. van den Bergh, Li & Filippenko, 2005) implying progenitors which only occur in young stellar populations. More recently, host properties played an important role in the discovery of a new classification of supernovae termed ‘calcium-rich’, and showing spectroscopic characteristics of CCSNe yet originating in regions devoid of star-formation (Perets et al., 2010).
Even more information can be gathered on the possible supernova progenitors of the various subtypes of CCSNe, by looking at the specific site of the SN explosion within the host galaxy. The CCSNe group divides broadly into type II (SNII) and types Ib and Ic (SNIbc), distinguished by the presence or lack of hydrogen in their spectra respectively (Minkowski, 1941). The SNII subclass can be further divided into IIP, IIL, IIn, IIb which will be discussed later; for a review of supernova classifications see Filippenko (1997). Many studies have investigated the association of these CCSNe subtypes with spiral arms or HII regions (e.g. Bartunov, Tsvetkov, & Filimonova, 1994; Van Dyk, 1992; Van Dyk, Hamuy & Filippenko, 1996; Petrosian et al., 2005), with more recent studies benefiting from increased statistics (e.g. James & Anderson, 2006; Anderson & James, 2008, 2009; Hakobyan et al., 2009). These analyses indicated that SNIbc are both more strongly associated with HII regions implying higher mass progenitors, and more centrally concentrated within galaxies, when compared to type II SNe, indicating a metallicity dependence with observed SN-type. Both interpretations can be explained theoretically by mass-loss via radiatively-driven stellar winds whose effectiveness increases with progenitor mass (Heger et al., 2003), or high metallicity environments (e.g. Puls et al., 1996; Heger et al., 2003).
In Habergham, Anderson, & James (2010), henceforth HAJ10, the current authors carried out a study on the distributions of CCSNe types in both ‘undisturbed’ and ‘disturbed’ host galaxies. This study concluded that within the disturbed systems an excess of SNIbc existed within the central regions when compared to those of type II. A case study on Arp 299, a so-called ‘supernova-factory’ (Neff, Ulvestad & Teng, 2004; Pérez-Torres et al., 2009), also carried out by the authors (Anderson, Habergham, & James 2011 henceforth A11), found the same unusual central excess of stripped-envelope supernovae (SE-SNe). These results have ignited a discussion into the role selection effects can play within host galaxy studies.
The analysis within this paper will concentrate on SE-SNe against SNII+IIP (consistent with A11); where SNII are all type II supernovae without sub-classifications, and SE-SNe include all type Ib, Ic, Ib/c, IIb and IIL. Any type IIn supernovae (SNIIn) within the sample have been omitted from the analysis and discussion due to uncertainties in their progenitor stars, and often in their classification (e.g. Anderson et al., 2012; Kiewe et al., 2012; Kelly & Kirshner, 2011; Van Dyk et al., 2000).
The accumulation of subtypes into the SE-SNe group, rather than the SNIbc and SNII groups of HAJ10, comes as a result of recent studies into the progenitors of CCSNe and the emergence of a sequence of progenitor envelope-stripping (Dessart et al., 2011), or mass loss (Heger et al., 2003; Crowther, 2007; Georgy et al., 2009). The sequence has type IIP retaining their entire stellar envelope, followed by an increasing loss of stellar envelope material from IIL, to IIb, Ib and Ic, which have lost both their hydrogen and helium layers. The interpretation for this increased envelope stripping has been debated. Theoretical studies suggest that it could be due to an increase in the progenitor mass (e.g. Heger et al., 2003), the metallicity of the environment (e.g. Heger et al., 2003), the presence of a binary companion (e.g. Podsiadlowski, Joss, & Hsu, 1992), or stellar rotation (e.g. Meynet & Maeder, 2003). Observational evidence for any one particular theory is difficult to determine, though there is evidence for both metallicity (Anderson & James 2009 hereafter AJ09, Modjaz et al. 2011; Leloudas et al. 2011), and progenitor mass (Anderson & James, 2008) playing a substantial role in the stripping of stellar envelopes prior to explosion. The best observational constraints would come from direct detections of CCSNe progenitors on pre-explosion images. Although this technique has had great success in a number of cases (e.g. Elias-Rosa et al. 2011; Maund et al. 2011, see Smartt 2009 for a review on the topic), the need for very nearby events severely limits the statistics available from these studies, which thus far have only had success with the much more common type II subclasses. In reality the cause is likely to be a combination of all of these effects.
The nature of all CCSNe, having high-mass, short-lived progenitors, provides a direct probe of recent or on-going star-formation within their host galaxies. The differences between the different subtypes also allows constraints to be placed on this star-formation. So investigations into the host galaxies of CCSNe provide insights both ways: into the possible progenitors of the supernovae themselves, and, into the mode of star formation in the host.
Our previous papers, culminating in Anderson et al. (2012), have established a probable mass sequence for CCSNe progenitors. Building on this the aim of this paper is to test the robustness of the authors’ previous study into the variation of CCSNe distributions with environment (HAJ10). We will present the data and host galaxy study sample in Section 2, followed by a new analysis of the radial distribution of CCSNe within their hosts in Section 3. A rigorous investigation into possible selection effects present within the sample will be discussed in Section 4. Section 5 will explore possible interpretations of the results, namely the effects of SNe environment metallicity, and the overall metallicity gradients of the hosts; the contribution of stellar rotation and binarity to the possible progenitor population; and the possibility of a modified initial mass function (IMF) preferentially producing the most massive stars in the central regions of ‘disturbed’ host galaxies. Finally, in Section 6 we will summarise the results and present our preferred interpretation and any possible implications.
2 Data Sample
Our data are drawn from observations of host galaxies indicated by SN discoveries contained within the Padova-Asiago SN catalogue111http://web.pd.astro.it/supern and IAU222http://www.cfa.harvard.edu/iau/lists/Supernovae.html SN catalogues. Such catalogues inherently contain biases with some resulting from initial SNe studies which targeted bright star-forming galaxies, rather than the ‘blind’ searches many groups are currently pursuing (e.g. Palomar Transient Factory (PTF), Rau et al. 2009; Law et al. 2009; Pan-STARRS, Kaiser et al. 2010). Our analysis contains 218 host galaxies containing 280 CCSNe of all subtypes, and although biases still persist within this sample, until such sufficiently large samples are accumulated through ‘blind’ searches, this is the best analysis possible. The large sample within this study also enables us to cover more of the rarer subtypes of SNe, but given the selection effects contained in the sample we do not claim that the relative numbers found here are representative of the Universe as a whole, and the conclusions drawn from the data are not dependent upon statistical completeness.
These host galaxies have been observed over 15 years of observations in both SNe-related and H galaxy studies. This provides us with a heterogeneous and randomly sampled selection of the to-date, observed local (median host recession velocity 1918 kms-1) CCSNe.
All galaxies have H narrow-band and R-broad band imaging, and come from the following facilities: the MPG/ESO 2.2m telescope at La Silla, Chile; and the Liverpool Telescope (LT), Jacobus Kapteyn Telescope (JKT) and Isaac Newton Telescope (INT) all on La Palma, the Canary Islands. The data were reduced in a standard manner using routines in Starlink and IRAF333IRAF is distributed by the National Optical Astronomy Observatory, which is operated by the Association of Universities for Research in Astronomy (AURA) under cooperative agreement with the National Science Foundation.. For more detailed information on the observations and data reduction process refer to AJ08 and Anderson et al. 2012 (submitted).
When analysing host galaxies by a characteristic such as disturbance, classification errors can become problematic. In HAJ10 the classification of galaxy disturbance was carried out by two independent visual inspections of the host galaxy images. Although more quantitative methods exist for classifying galaxy disturbance, namely through the degree of asymmetry (Conselice, Bershady, & Jangren, 2000; Lotz, Primack & Madau, 2004), the classification within this study assesses such a wide range of parameters that it is better done via an eye-ball study than any one quantitative single measure. The visual classification schemes described in Surace (1998) and Veilleux, Kim & Sanders (2002) have been widely used (e.g. Miralles-Caballero et al., 2011; Zamojski et al., 2011), and in this paper we adopt a similar technique, attributing galaxy characteristics to levels of disturbance. Although the most disturbed galaxy systems often also show signs of merger-triggered starbursts in the nuclei, there are undoubtedly some galaxies which show signs of interaction without displaying such energetic star-formation. For the reanalysis presented in this paper the authors themselves reclassified each galaxy within the sample as ‘disturbed’ or ‘undisturbed’ based on a number of characteristics. An ‘extreme’ sample of disturbed galaxies was chosen, which contained hosts undergoing a major interaction with another galaxy, or a which had large degree of asymmetry indicating a recent tidal interaction with another system. A larger sample of ‘disturbed’ galaxies (including the ‘extreme’ systems above) included those displaying at least two signs of minor interactions. These signs were; presence in a group with minor interaction, minor degrees of asymmetry, shells, tails, irregular structure (small irregular systems are not included in this analysis - this irregular structure is within a larger star-forming galaxy), a double nucleus, extreme or irregular dust patterns or a clumpy morphology.
A full list of classifications for each galaxy in our sample is presented in Table 1. The full table is available online through the supplementary material. 444Where starbursts have been indicated these come from the presence of the galaxy within the GOALS sample (Armus et al., 2009) as either a LIRG or ULIRG, or where the system is noted as a starburst on the NASA/IPAC Extragalactic Database (NED).
|
Galaxy |
Isolated |
Group - no interaction |
Group- minor interaction |
Group - major interaction |
Asymmetry - minor |
Asymmetry - major |
Shells |
Tails |
Irregular structure |
Peculiar dust lanes |
Clumpy morphology |
Double |
Starburst |
|---|---|---|---|---|---|---|---|---|---|---|---|---|---|
| IC 391 | X | X | |||||||||||
| MCG-02-14-03 | X | X | X | ||||||||||
| NGC1821 | X | X | X | ||||||||||
| NGC1832 | X | X | |||||||||||
| NGC1961 | X | X | X | X | |||||||||
| IC 438 | X | X | |||||||||||
| IC2152 | X | ||||||||||||
| NGC2207 | X | X | |||||||||||
| NGC2146 | X | X | X | X | X | ||||||||
| ESO121-G26 | X |
3 Results
We begin this section by testing whether the ratio of SE-SNe to SNII
differs with galaxy disturbance. The absolute rates of each SNe
sub-type would be subject to bias within our sample regarding host
galaxy selection. However, between the different galaxy samples no
such bias is present and so the relative frequencies of each CCSNe
type give us useful information. Below we list the ratio of SE-SNe to
SNII in each sample, with the numbers of SNe in each group presented
in brackets.
SE-SNe : SNII+IIP
-
Undisturbed: 0.766 (59 : 77)
-
Disturbed: 1.14 (65 : 57)
-
Extreme: 1.85 (26 : 14)
It is clear that the disturbed galaxies have a higher fraction of SE-SNe, by more than a factor of two, when compared to undisturbed galaxies.
We now present the analysis of the radial distribution of 258 CCSNe (the 22 type IIn SNe within this sample will be the subject of a future paper), in both ‘undisturbed’ (136 SNe in 114 hosts) and ‘disturbed’ hosts (123 SNe in 89 hosts). The radial distribution is defined in terms of the fraction of R-band light Fr(R) which lies within the circle or ellipse which contains the SN. This means that an Fr(R) value of 0.0 corresponds to a supernova at the central R-band peak of the galaxy emission, while a value of 1.0 implies an extreme outlying SN. A full description of this analysis is given in AJ09.
3.1 Radial Distribution Analysis
In Figure 1 we present the CCSNe distribution in the isolated or ‘undisturbed’ galaxy sample, and in Fig. 2 in the ‘disturbed’ sample. The radial distributions are presented as histograms of the Fr(R) value in which the top panel presents all CCSNe, SNII (type IIP and SNII without a sub-classification) in the middle panel and all SE-SNe (Ib, Ic, Ibc, IIL and IIb) in the bottom panel. The combination of SNIIP with SNII without sub-classifications is based on the assumption that 70% of these SNe would be SNIIP based on Lick Observatory Supernova Search (LOSS) observed fractions (Li et al., 2011). Indeed a Kolmogorov-Smirnov (KS) test of SNII+SNIIP against SNIIP within the whole sample gives a probability that they are drawn from the same parent distribution of 86%.


As discussed in Section 2, the classification criteria used to define these samples mean that within the ‘disturbed’ sample are galaxies in all stages of interaction. This may be a galaxy within a group with signs of minor asymmetry, to merging galaxy pairs. A subset of the ‘extreme’ galaxy sample can be seen in Fig. 3, and the results of the radial analysis of the CCSNe in these systems in Fig. 4 with the same panels as Figs. 1 and 2.

The distributions of SNII+IIP and SE-SNe within each of the samples
appear markedly different. We present tests on the statistical
significance of these differences using a KS test. The KS test takes
two parameters to calculate the probability; the ‘distance’ (the
largest difference between the distributions on a cumulative
distribution plot) between the distributions, and the number of events
within each distribution. Due to the decreased number of events in the
‘extreme’ sub-sample throughout the analysis of these results we will
present both the probability (P) and the distance (D) of the
distributions, in order to establish whether a reduced significance in
‘P’ is due to either a smaller sample size or a change in the
distribution.
The results of the KS tests carried out in this study are presented in
Table 2, and will be discussed throughout the rest of this
section.
Within the ‘disturbed’ galaxy sample there exists a
statistically significant (P6 per cent) difference between the
distributions of SE- and IIP- supernovae; a result which becomes more
exaggerated within the ‘extreme’ sample. This is a result that stands
from HAJ10 despite the addition of all SE-SNe into the same class.
| SN II+IIP vs SE-SNe | SN IIP vs SN Ibc | SN II+IIP vs SN Ibc | SN Ib vs SN Ic | |||||
|---|---|---|---|---|---|---|---|---|
| P | D | P | D | P | D | P | D | |
| Undisturbed | 0.106 | 0.2047 | 0.103 | 0.2566 | 0.086 | 0.2248 | 0.004 | 0.5052 |
| Disturbed | 0.060 | 0.2337 | 0.042 | 0.3171 | 0.014 | 0.2740 | 0.208 | 0.2963 |
| Extreme | 0.054 | 0.4231 | 0.035 | 0.4737 | ||||
In Figs. 5 and 6 we present the same data as in Figs. 1 and 2, but without the intermediate SE-SNII classes (IIL and IIb), and without type II SNe without sub-classifications, for ‘undisturbed’ and ‘disturbed’ galaxies respectively. In both figures the top panel shows the overall distribution of all CCSNe in the systems, the middle panel the SNIIP and the bottom panel the SNIbc. The distributions shown therefore represent the most extreme within our sample, where only SNe which have lost their entire hydrogen envelope are plotted, and the uncertainties in the SNII unclassified sample are removed.
Although the statistics are clearly reduced in these examples, the
central excess of SNIbc becomes even more apparent in the ‘disturbed’
galaxies. Despite the small statistics a Kolmogorov-Smirnov test
places the probability that SNIIP and SNIbc are drawn from the same
parent population within disturbed systems at 4 per cent. The
results of the KS tests are shown in Table 2.


Combining the statistically consistent SNII population with the SNIIP
the results become more dramatic. Within the ‘disturbed’ galaxies
there is only a 1 per cent probability that the SNII+SNIIP and
SNIbc populations have the same parent source. The reduced statistics
in the ‘extreme’ sample raises this probability to 3.5 per cent,
although the large ‘D’ value indicates that the distributions of these
populations are significantly different (Table 2).
3.2 Distribution of SNIb and SNIc in undisturbed galaxies
Where the statistics allowed we explored the distributions of all CCSNe types, and in doing so another significant result has emerged. Our samples are now large enough so that the SNIbc class can be broken down into SNIb and SNIc individually. Within the ‘undisturbed’ sample we have 21 SNIb and 23 SNIc, and in the ‘disturbed’ sample, 21 SNIb and 27 SNIc. Figures 7 and 8 display the histograms of the distributions of each population, where the top panel is again the overall distribution of CCSNe, the middle panel SNIb and the lower panel SNIc.
The principal result here is that following a KS test, although the
distributions of SNIbc within the ‘disturbed’ sample are completely
consistent (P20 per cent), within the ‘undisturbed’ sample
the two distributions are very different.
This places a probability that SNIb and SNIc, within ‘normal’ spiral galaxies, are drawn from the same parent population of only 0.4 per cent (Table 2). Although the statistics here are small this is an astonishing result, and not one which can be easily explained in terms of selection effects.
The result seems to be driven in part by the lack of SNIb in the central regions of these systems, and in part by the lack of SNIc in the outer regions of ‘undisturbed’ galaxies. The probability of ‘missing’ SNIc explosions in the outer regions of galaxies, where the host extinction is low, seems unlikely. Correspondingly, the similar peak absolute magnitudes of SNIb and SNIc (Li et al., 2011), mean that it is unlikely SNIb are being missed in the central regions, where SNIc are still observed.
The most likely explanation for the different distributions of SNIb and SNIc in ‘normal’ host galaxies is that the metallicity gradient within the host plays a major role in evolving the progenitor star prior to explosion. Envelope-stripping through radiatively driven, metallicity-dependent, winds has been discussed in Section 1. We believe the results presented here, showing that the distributions of SNIb and SNIc within ‘undisturbed’ galaxies are statistically very different, provides direct evidence for this.
One interesting aspect of our results is the apparent lack of SNIc in the outer regions of our ‘disturbed’ galaxies, where we would expect some of the lowest metallicity regions. This echoes the findings of Arcavi et al. (2010) who find a lack of SNIc in intrinsically low metallicity dwarf galaxies.
The contribution of metallicity within ‘disturbed’ host galaxies does not appear to have as strong an effect as we will demonstrate in Section 5.1.


4 Selection Effects
Within any host galaxy supernova study, selection effects and biases can enter data from two possible sources: the supernova selection, and the host galaxy selection. We shall explore the different effects arising from each in this section.
4.1 Supernovae
A range of selection effects can contribute to biases within a CCSNe study. The first of these is that different CCSNe types have different magnitude ranges, both in peak magnitude and the duration of the light curve, and so within any study, one is likely to lose intrinsically fainter SNe subtypes, which are never discovered due to the brightness of their host galaxy, or the extinction within it. It is often accepted that SNIIP are most likely to be unaccounted for in large volume galaxy studies (Pastorello et al., 2004; Smartt et al., 2009), due to their fainter peak magnitudes during outburst. This effect could be exaggerated within ‘disturbed’ host systems due to the increased dust content, and warped morphology. However, careful analysis of the SN luminosity function from LOSS (Li et al., 2011), found no indication that SNIIP have intrinsically fainter explosions. Although SNIIP have a faint tail (not unlike SNIc), the absolute magnitudes of each CCSNe subclass have enough overlap that missing SNIIP are unlikely to explain the results presented in this paper.
The Shaw Effect (Shaw, 1979), that it is more difficult to detect supernovae in the inner regions of distant galaxies, also affects all supernovae searches and hence all host galaxy sample analysis. Although the Shaw effect was much more applicable to photographic plate searches, where the centres of galaxies were often over-exposed, it is still a source of bias in today’s SN searches. Studies have been carried out into the number of SNe estimated to be lost through the Shaw effect. Cappellaro et al. (1993) found that out to host galaxy recession velocities of 6000 kms-1 approximately 35 per cent of all CCSNe types may be lost in photographic plate searches in the inner regions of host galaxies. This compares to 22 per cent of all SNe out to 4000 kms-1 in some of the first visual (Evans, van den Bergh & McClure, 1989) and CCD based automated searches (Muller et al., 1992). Within this range of host galaxy redshifts there is no preferential bias to any particular type of SNe though statistics at this time were poor. Studies into the Shaw effect on modern SNe samples, assembled using modern CCDs and both targeted and ‘blind’ searches are lacking, and so for the purpose of this investigation the results drawn from Cappellaro et al. (1993) are the best estimates of bias available in the literature.
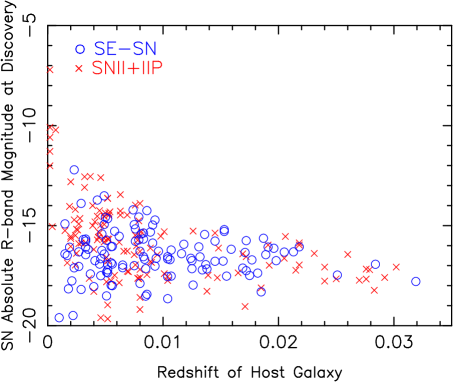
To test further for selection biases, we analysed the distribution of discovery magnitudes (taken from Lennarz, Altmann & Wiebusch 2012 and the Padova-Asiago SN catalogue 555 http://web.pd.astro.it/supern/) for our sample of SNIIP+II and SE-SNe. All SNe with available discovery magnitudes were colour-corrected to the -band, due to this being closest to unfiltered light (a large proportion of the discovery magnitudes). Our corrections were based upon available CCSNe-subtype multi-band photometry on the SUSPECT database (the online Supernova Spectrum Archive).
For this analysis we used the discovery magnitude of each SN rather than a peak magnitude. In the context of exploring selection effects within our sample, specifically whether we are missing ‘faint’ SNe, the discovery magnitude is the most important. Figure 9 shows the absolute -band magnitude at discovery of every CCSNe within our sample, plotted against redshift. Here SE-SNe are represented by the blue open circles, and SNII+IIP the red crosses. As expected, there is a much larger range of discovery magnitudes within our sample at low redshift. However, it is interesting to note that the brightest events are found at all redshifts, and not just in the most distant galaxies.
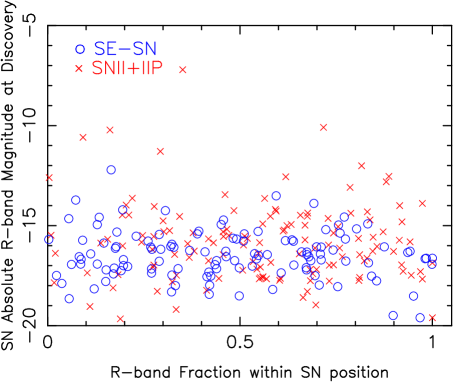
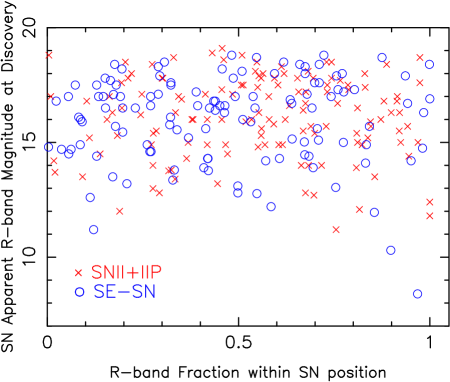
The importance of analysing the discovery magnitude of each SNe against the Fr(R) value used in this paper is paramount in establishing any possible selection effects. If we were to lose ‘faint’ SNe, we would do so in the central, dusty and high surface brightness regions, defined in this paper as within 20 per cent of the -band light (Fr()0.2). Figures 10 and 11 display the distribution of absolute and apparent discovery magnitudes, respectively, of each SN in our sample against their Fr() value. Again, SE-SNe are represented by blue, open circles, and SNII+IIP by red crosses.
Both Figs. 10 and 11 show no correlation between the discovery
magnitude (absolute or apparent) and the Fr() value, for either the
SE-SNe or the SNII+IIP. Within the central regions we observe all
CCSNe types, over a similar range of magnitudes.
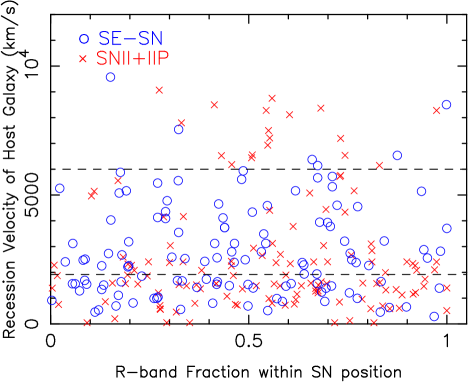
Further to this, it is important to analyse whether all of the central SNe within our sample are present at the lowest redshifts. It may be possible that the central SNe we detect are all in the most local galaxies, and hence a selection effect could still affect the result. In order to analyse this we have plotted the recession velocity of each host galaxy and the Fr() values of the SNe within it. This is displayed in Fig. 12, where again SE-SNe are the blue open circles and SNII+IIP are the red crosses. The dashed black lines represent the median recession velocity of our sample and 6000 kms-1, which was the limit of the HAJ10 study, and the limit to which we would claim our results are reliable, due to the small number statistics above this range.
Figure 12 again shows that there is no correlation between the Fr()
value of the SNe and its host galaxy recession velocity. Certainly out
to 6000 kms-1 there is no indication of losing any II+IIP
within the central regions, or at higher distances from the centre. A
KS test between low and middle redshift bins shows that the
distribution of SNII+IIP are completely consistent (P=0.990,
D=0.0814). The overall distributions of CCSNe within the 3 redshift
bins (zmedian; medianz6000 kms-1; and z6000
kms-1) are all consistent with being drawn from the same parent
population.
We next test the radial distributions of CCSNe of all types within the
different redshift bins.
KS test:
-
low z bin vs middle z bin: P=0.947 D=0.0647
-
middle z bin vs high z bin: P=0.193 D=0.2353
This shows that these Fr() distributions are statistically completely consistent and that the main result presented in this paper, of an excess of SE-SNe within the central regions of ‘disturbed’ hosts, is not due to a failure to detect SNIIP within these regions.
Despite the small number of events in our sample above 6000 kms-1, all of the histograms provided in Section 3, and all of the KS tests given, include these events. Although the sample at this redshift range is far from complete, the inclusion of such objects within the results have no effect on the outcome, as the distribution of events at all redshifts is essentially flat and therefore cannot drive the results found.
In a very conservative test of possible distance dependent selection effects, we now minimise these by analysing only those within 2000 kms-1. This reduces the sample size in both ‘undisturbed’ (67 CCSNe) and ‘disturbed’ (56 CCSNe) samples. Even in this sample, a central excess of SE-SNe is still visible, providing 11 of the 17 events within Fr()=0.2 (compared to 3 out of 7 in the ‘undisturbed’ systems). However, at this level the result is no longer statistically significant.
Our radial analysis can also be carried out on the H emission within a galaxy, which traces star formation rather than the old stellar light (traced by the -band). Here an Fr(H) value of 0.0 means the supernova is closer to the central R-band peak of the galaxy than any H emission, and again a value of 1.0 indicates an outlying SN.
Figure 13 shows the histogram of Fr(H) in our ‘disturbed’ galaxy sample. This figure shows that the central distribution of SE-SNe is apparent, even with respect to the H emission within the host galaxy. This suggests that it is not due to a selection effect.
All of the investigations carried out in this section suggest that the results found in Section 3 cannot be by any selection effect. We find in our data an excess of stripped-envelope SNe within the central regions of ‘disturbed’ galaxies, even with respect to the star formation as traced by H.

4.2 Host Galaxy Sample
It is well documented that galaxy disturbance is linked to rapid bursts of star formation (Larson & Tinsley, 1978; Joseph et al., 1984; Kennicutt & Keel, 1984; Kennicutt et al., 1987) which are frequently concentrated in the central regions of the disturbed or merging systems (Joseph & Wright, 1985; Keel et al., 1985), probably linked to the central gas concentrations seen in merger simulations (Barnes & Hernquist, 1991; Mihos & Hernquist, 1996). Thus, a possible reason for the excess of central stripped-envelope SNe in disturbed galaxies is that these regions are dominated by starbursts of such extreme youth that they have not yet started to produce SNIIP (under the assumption that CCSN type is driven primarily by progenitor masses, and hence correlate strongly with stellar lifetimes).
In extremely young star formation regions, such as some observed in Arp 299 (Alonso-Herrero et al., 2000), it is to be expected that current supernovae should have high mass progenitors, regardless of the form of the IMF. However, this requires the galaxies to have been caught at just the right age after an extremely short epoch of starburst activity, which requires some fine tuning.
The degree of fine tuning required depends on the ranges of initial mass of progenitors resulting in different types of supernovae, and in particular the initial mass corresponding to the transition between SNIIP and the stripped-envelope types. This is a very uncertain value, and depends on other factors, e.g. metallicity and rotation. Estimates for the transitional mass between a type II and SE-SNe for single-star progenitors include 25-40 M⊙ (Heger et al., 2003; Eldridge & Tout, 2004) and 25 M⊙ (Gal-Yam et al., 2007). However, the rotating star models presented recently by Ekström et al. (2012) and Georgy et al. (2012) lower this value to between 15 and 20 M⊙. Observationally, the highest masses attributed to SNIIP progenitors that have been detected in pre-explosion imaging are 15-18 M⊙ for SN1999ev (Maund & Smartt, 2005); 15 M⊙ for SN2004dj (Maíz-Apellániz et al., 2004); and 15 M⊙ again for SN2004et (Li et al., 2005), although a recent study of the progenitor of SN2012aw (Fraser et al., 2012), an unconfirmed SNIIP, found a higher mass range of 14-26 M⊙. From the statistics of all such progenitor detections found at the time of publication, Smartt (2009) derived an upper limit to the masses of SNIIP progenitors of 16.5 M⊙. Thus there is strong evidence that stars at least as massive as 15 M⊙ can produce SNIIP, and conservatively taking this as the maximum mass, a burst of star formation would start producing SNIIP after some 13 Myr, according to the high-mass stellar lifetimes of Meynet et al. (1994). If instead the theoretically-preferred higher mass limits for this transition are adopted, SNIIP could be occurring in as little as 5 Myr. While it is possible to catch one galaxy in a sufficiently recent starburst phase that no SNIIP are yet occurring, for an ensemble of galaxies, such as those presented here, and previously in HAJ10, it seems extremely improbable that most could be caught at such a critical phase of activity purely by chance.
One possibility is that our selection by morphological disturbance may have resulted in systems with the very young starbursts required for this timescale explanation. In an attempt to determine the plausibility of this explanation, we used the results of Mihos & Hernquist (1994, 1996), who used Smoothed Particle Hydrodynamics simulations to follow the behaviour of gas within minor and major mergers of galaxies. These models contain a prescription for star formation based on the original volume density formulation of the Schmidt Law (Schmidt, 1959), enabling the calculation of the star formation rate as a function of time. The overall timescale is defined by a system of units that assumes the original galaxies, prior to merging, to have had properties similar to the Milky Way. This is a reasonable approximation for the bright interacting and merging systems of interest in the present paper.
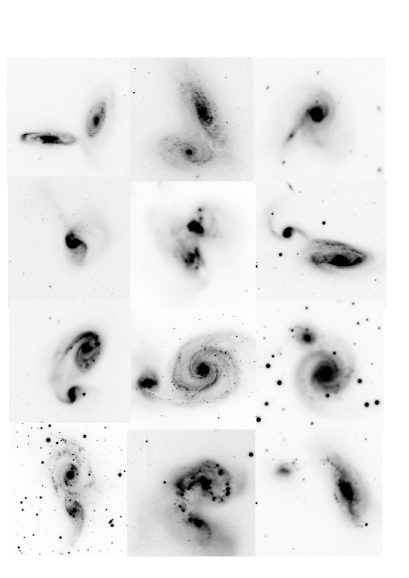
The details on the classification of galaxies within this study were presented in Section 2 and Table 1. Figure 14 shows a subset of those galaxies classified as ‘disturbed’, which also hosted centrally-located CCSNe. These have been matched up by eye with the stellar mass distributions of the simulated mergers in Mihos & Hernquist (1996) and arranged in an approximate chronological order, according to the corresponding time within the Mihos & Hernquist (1996) simulations. For the 6 systems shown, the resulting merger ages are 260, 260, 689, 780, 845 and 910 Myr respectively, from top left to bottom right. The simulations of Mihos & Hernquist (1996) also reveal the stages at which the central gas densities, and hence the star formation activity, are predicted to be strongly enhanced. This is the case for all but the first two frames in Fig. 14, with the predicted starburst phase covering a simulated time interval of over 200 Myr.
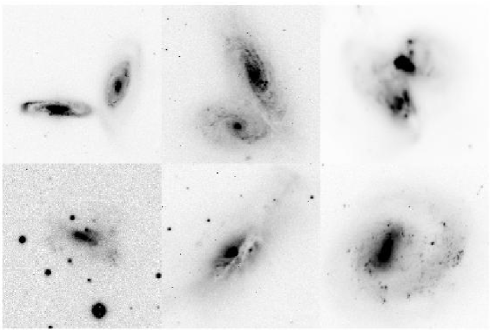
While the exact ages derived from this comparison of merger morphologies with simulations are subject to substantial uncertainties on a case by case basis, the overall timescales implied by the differences in galaxy morphology for the observed sample cover a range of hundreds of Myr, far in excess of the finely-tuned ages of a few Myr required to select the ‘stripped-envelope dominated’ phase at the start of a starburst. Even in the idealised case where a merger-induced starburst can be represented by a narrow spike in the central star formation rate, then for every one merger in the narrow age window where only stripped-envelope SNe are being produced in these regions, there should be several somewhat older starbursts producing only SNII. There is no observational evidence for the latter phenomenon.
Apart from this fine-tuning argument based on the appearances of galaxies and their dynamical timescales, there is further independent evidence that observed starbursts have maintained their activity for timescales easily long enough to be producing all types of CCSNe. Studies of the energetics and spectroscopic properties of starbursts generally infer ages of 40 Myr for the starburst phase (Sanders & Mirabel, 1996; Caputi et al., 2009). Of the most direct relevance for the present argument is the detection of extended soft X-ray emission from the regions surrounding starbursts (Franceschini et al., 2003; Iwasawa et al., 2011). This emission appears to be driven by CCSNe (Iwasawa et al., 2011), and the extent of the emission implies that these SNe have been occurring for 108 years (K. Iwasawa, private communication). Again this is easily long enough to have reached an equilibrium state in which all types of CCSNe should be fairly represented.
Therefore we conclude here that the selection of young starbursts does not drive the result presented here or in HAJ10.
5 Interpretations
Given that we have explored all possible sources of selection effect and established that none can drive the central excess of SE-SNe in disturbed galaxies, we now explore the possible interpretations of this result. We look at each possible channel of progenitor envelope-stripping, and how the environment within the central regions of interacting galaxies may affect each channel.
5.1 Metallicity
As discussed briefly in the introduction, one key parameter thought to lead to envelope-stripping, and hence the observation of a SNII or SNIbc, is metallicity. Many SN host studies have observed a central concentration of SNIbc when compared to SNII (Bartunov, Makarova, & Tsvetkov, 1992; van den Bergh, 1997; Tsvetkov, Pavlyuk, & Bartunov, 2004; Hakobyan et al., 2009; Boissier & Prantzos, 2009; Anderson & James, 2009), as seen here, and this has generally been assumed to be the result of metallicity gradients present within the host galaxy. Within a ‘normal’ star forming galaxy, metallicity gradients have been observed, with the central regions being more metal rich than the outer regions (e.g. Henry & Worthey, 1999). Within this scenario central SNe are more likely to lose their outer envelopes through metallicity-dependent line driven winds (Puls et al., 1996; Kudritzki & Puls, 2000; Mokiem et al., 2007). All SNe host galaxy studies to date have failed to distinguish between disturbed or interacting systems and ‘normal’ spirals within the sample (although see Petrosian et al. 2005 for a study of CCSNe with relation to starbursts). Within merging galaxies any metallicity gradient originally present is disrupted by the interaction and is smoothed out within the system (Kewley et al., 2010; Rupke, Kewley & Chien, 2010; Rich et al., 2012), through the infall of pristine gas from the outer regions into the centre (e.g. Rampazzo et al., 2005; Hibbard & van Gorkom, 1996; Kewley, Geller & Barton, 2006), often fuelling a burst of star formation (Barnes & Hernquist, 1996). Furthermore, studies of the metallicity of SNe sites have found little difference between regions that host SNII and SNIbc, and a presence of both major groups of SNe at all metallicities (Anderson et al., 2010). This is supported by a study of NGC 2770 (Thöne et al., 2009) which found that the large number of SNIb within the host were found in low metallicity regions, negating envelope stripping via radiative winds. These studies suggest that the central excess of SE-SNe in disturbed galaxies is not due to metallicity.
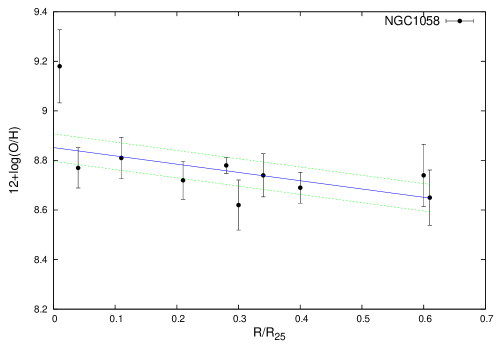
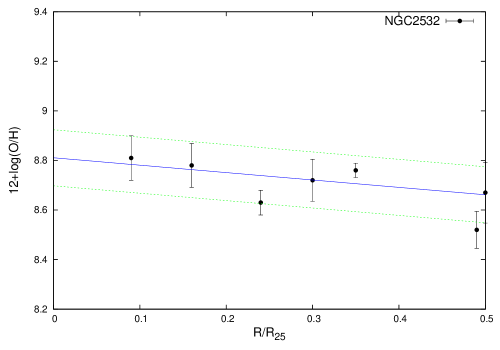
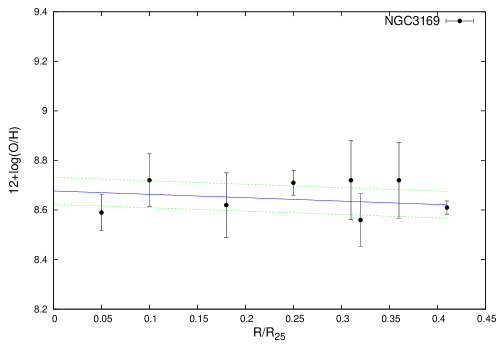
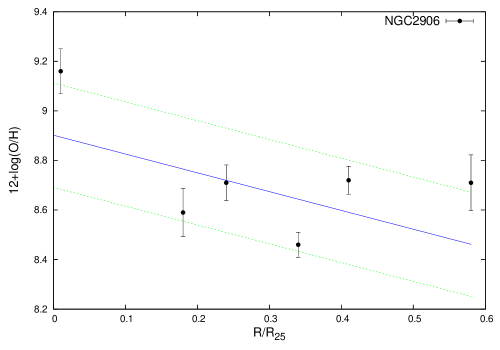
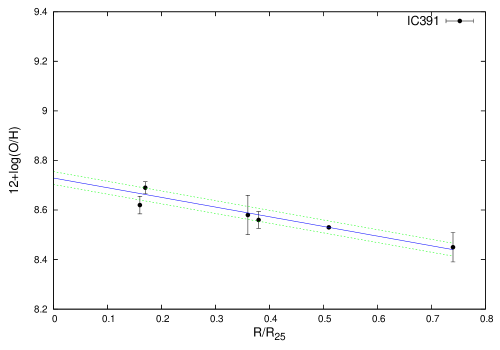
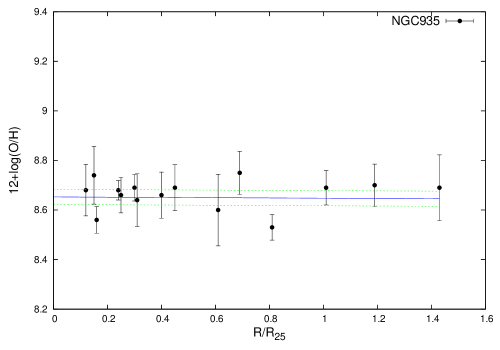
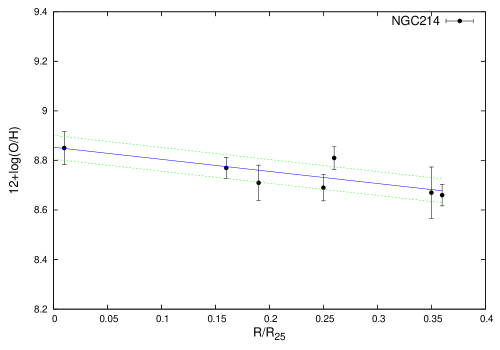
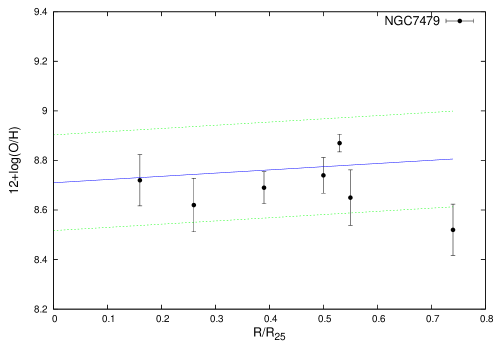
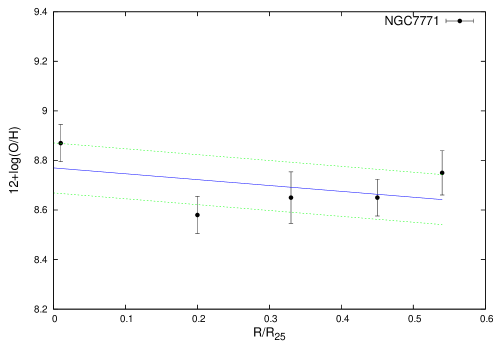
In order to study any metallicity gradient present within this sample, we obtained spectroscopy for a random subset of the host galaxies. Long-slit spectra for 23 of the host galaxies were obtained using the Intermediate Dispersion Spectrograph (IDS) on the INT on La Palma, in the Canary Islands. The slit was positioned to pass through the nucleus of each galaxy, to give a positional reference, and angles chosen to coincide with as many HII regions as possible. Metallicities were determined using the line ratio diagnostics from Pettini & Pagel (2004), who use emission lines close together in wavelength to negate extinction effects, which also addresses any atmospheric differential refraction (Filippenko, 1982) issues. In any case, observations were taken where possible at the parallactic angle. It was not always possible to obtain a spectrum at the SN-host HII region doing this and so where possible (at low airmass) a second angle was observed to obtain metallicity measurements for specific SNe sites. Standard reduction procedures were employed using Starlink packages, and spectra extracted from each observable HII region along the slit. Each spectrum was then wavelength and flux calibrated. A subset of the derived metallicity gradients is presented in Fig. 15. Each column in Fig. 15 represents a different sample within the current study; the first column displays host galaxies in the ‘undisturbed’ sample, the middle column ‘disturbed’ galaxies, and the final column galaxies within our ‘extreme’ subset. Any galaxies containing known Active Galactic Nuclei (AGN) had their central (bulge) metallicities disregarded prior to determinations of the gradients. The median metallicity gradients for each sub-sample are given below with the number of galaxies in this sample following in brackets. 666Throughout this section gradients are presented in units of , where is the B-band isophotal radius at a surface brightness of 25 mag arcsec-2.
-
Undisturbed: –0.5017(6)
-
Disturbed: –0.4086(9)
-
Extreme: –0.2447(7)
It should be noted here that the final figure changes dramatically (to –0.5742) with the inclusion of NGC3627, which falls into our ‘extreme’ sample but shows an extremely, and probably unphysically, steep metallicity gradient (–2.880) according to our measurements. It is not known why this galaxy displays such a steep gradient. However, it may also be interesting to note that were we to include the bulge spectrum (initially excluded as the galaxy is classified as a LINER) the gradient is reduced to –2.203, leading to an average within the ‘extreme’ sample of –0.4895.
|
|
|
|
|
|
|
|
|
Our data overall offer support to the much more detailed study of Kewley et al. (2010), who find that the metallicity gradients become shallower, or indeed disappear within disturbed or interacting galaxies.
In accordance with Anderson et al. (2010) it is also possible in some cases to gather data on metallicity measurements at the SNe sites. Within our ‘disturbed’ sample there are 30 central CCSNe of all types (8 II+IIP and 22 SE-SNe). Of these we possess host HII metallicity measurements for 13 (from Anderson et al. (2010) and the recent IDS data presented here), all of which are classified as SNIb (7), SNIc (5) or SNIb/c (1). Table 3 presents the average metallicity for each SNe type available here compared to recent studies by Anderson et al. (2010), Modjaz et al. (2011) and Leloudas et al. (2011). The table shows that our central SNe have metallicities that are completely consistent with those presented in other studies. The SNIc within the sample are entirely consistent with all of the studies, whereas the SNIb average metallicity is more consistent with Leloudas et al. (2011).
| Study | SNIb metallicity | N | SNIc metallicity | N | SNIbc metallicity | N | |||
|---|---|---|---|---|---|---|---|---|---|
| This paper | 8.581 | 0.041 | 7 | 8.637 | 0.067 | 5 | 8.617 | 0.035 | 13 |
| Anderson et al. (2010) | 8.616 | 0.040 | 10 | 8.626 | 0.039 | 14 | 8.635 | 0.026 | 27 |
| Modjaz et al. (2011) | 8.49 | 0.012 | 13 | 8.66 | 0.010 | 14 | |||
| Leloudas et al. (2011) | 8.52 | 0.05 | 14 | 8.60 | 0.08 | 5 |
The resulting conclusion from this discussion is that metallicity cannot drive the excess of SE-SNe within the central regions of interacting systems. Therefore alternate explanations must be pursued.
5.2 Binary Progenitors
The progenitors of CCSNe are widely discussed to arise from both binary and rotating stars (see Eldridge, Izzard & Tout 2008; Meynet & Maeder 2005, respectively). The relative contributions from each mechanism have been discussed extensively in the literature (e.g. Podsiadlowski, Joss, & Hsu, 1992; Georgy et al., 2012). Even for models where binarity is important, metallicity and mass may play an significant role (Yoon, Woosley & Langer, 2010; Eldridge, Langer & Tout, 2011; Smith et al., 2011).
However, if we are to attempt to explain the central excess of SE-SNe in disturbed galaxies in terms of binarity, we must analyse whether binary fraction can be increased in such environments.
It is possible to analyse previous high density star forming regions, by looking at present day globular clusters, which are thought to be remnants of previous starburst episodes (e.g. Elmegreen & Efremov, 1997; Meurer et al., 1995; Li, Mac Low & Klessen, 2004). A recent study by Kruijssen et al. (2012) found that within merging galaxies the dynamical heating of star clusters was an order of magnitude higher in interacting galaxies than isolated ones, due to tidal shocks driven by the increased density. This dynamical heating is sufficient to destroy star clusters at a higher rate than new clusters are formed so that the total number of stellar clusters in a merger remnant is 2-50 per cent of the amount in the progenitor discs. However, within these shock heated regions the massive clusters we would expect to host CCSNe, are more likely to survive. Studies have shown that there is in fact an anti-correlation between binary fractions of stars and the absolute luminosity (mass) of the cluster (Milone et al., 2008; Sollima et al., 2007).
Massive star clusters are known to have on average higher densities and larger velocity dispersions (Djorgovski & Meylan, 1993). The fraction of surviving binaries is thought to be dominated by binary ionisation and evaporation (Sollima, 2008), and so within high density regions binaries are more likely to be disrupted through close encounters, which are both more frequent and have higher mean kinetic energies (Sollima et al., 2010). However, during encounters between binary systems and a massive single star the secondary star is usually ejected, therefore in clusters with high collisional rates there will be an increase in the number of equal mass binaries. Sollima (2008) found that this increased fraction is not noticeable, with an exchange process of only a few per cent over the entire cluster.
Therefore this suggests that the massive clusters which survive galaxy interactions contain fewer binary systems. If these same arguments apply in the high-mass stellar regime then the excess of central SE-SNe cannot be explained in terms of an increased binary fraction.
5.3 Modified Initial Mass Function
In HAJ10, we characterised the modified IMF required to accommodate our SN observations in terms of a (radically) modified power-law index. However, there is to our knowledge no theoretical motivation for an IMF that is flat or even rising with mass, and simply changing the slope does not naturally explain the almost complete absence of SNIIP we find. Our results are more naturally accommodated by suppressing low mass SF, up to some limit that might vary from starburst to starburst, while leaving the form of the high-mass end of the IMF unchanged. To satisfy our observations, the requirement is that this limit should be sufficiently high to prevent formation of SNII progenitors in central regions of most (but not all) of our ‘disturbed’ galaxies. Above this limit, the IMF can take the standard form; this is unconstrained by our observations.
This concurs with the theoretical models of Klessen, Spaans, & Jappsen (2007) who find that in starburst galaxies the Jeans mass increases, which affects the turnover of the IMF by pushing it to higher initial masses. This ‘starburst’ IMF is close to what is required to give the relative numbers of SE- and IIP SNe found in our study. The IMF calculated for the Klessen, Spaans, & Jappsen (2007) ‘starburst’ simulation would lead to a strongly suppressed number of SNII relative to SE-SNe, at least approximately consistent with the results presented here, under the assumption that progenitor mass differentiates these SN types.
Further discussion on this form of modified IMF and its implications in the wider field of astronomy will be presented in a future paper (James et al. in preparation).
6 Conclusions and Implications
This paper has presented the results of a re-analysis of HAJ10, including increased statistics and a deeper analysis of the characteristics of disturbance. The results found can be summarised as follows:
-
We find a remarkable excess of SE-SNe within the central regions of ‘disturbed’ galaxies. This confirms the main result from HAJ10, and is an absolute excess even with respect to the star formation as traced by H emission.
-
The central excess is enhanced when we compare the SNIbc against SNIIP populations, as expected if a sequence of increased envelope-stripping exists from SNIIP-IIL-IIb-Ib-Ic.
-
We have found no preferential ‘loss’ of SNIIP within the sample, both in terms of absolute and apparent discovery magnitudes, or with redshift within such a local sample of host galaxies. Therefore selection effects based around the SNe population studied here cannot drive the results found within this analysis.
-
The overall differences in galaxy morphology imply interaction timescales far in excess of those required to select the ‘stripped-envelope dominated’ starburst phase within our sample. Therefore we conclude that there are no selection effects present within our host galaxies which could drive the central excess of SE-SNe in disturbed galaxies presented here.
-
Metallicity gradients within host galaxies cannot explain this result, as our disturbed sample are likely to have either a small gradient, or none at all. Furthermore, the metallicities of the local environments of the SNIbc within this sample are consistent with results published data.
-
The effects of stellar rotation and binarity have been discussed and no evidence has been found to indicate that either mechanism would be increased sufficiently within our host environments to explain the excess of SE-SNe found.
-
Our preferred explanation is that within the central regions of disturbed galaxies a modified IMF exists which preferentially produces the most massive stars, seen here in through the excess of SE-SNe.
-
The radial distributions of SNIb and SNIc within ‘undisturbed’ galaxies are statistically very different (P=0.004). This could be driven by metallicity gradients in these undisturbed galaxies, or radial variations in other properties (binarity or stellar rotation) driving envelope loss in progenitor stars. This should be investigated in future studies.
The results of this investigation further constrain the progenitors of different CCSNe subtypes, and highlight the need to gather as much information as possible on the specific host galaxy environment, where direct detections are impossible. We maintain that in different environments the main mass-loss mechanism in place to produce stripped-envelope supernovae can differ; most notably a metallicity driven wind in ‘undisturbed’ hosts and a modified IMF in the central regions of ‘disturbed’ host galaxies. Further discussion of the implications of a modified IMF in the central regions of ‘disturbed’ host galaxies is to follow (James et al. in prep).
Acknowledgments
We wish to thank John Eldridge, Steve Smartt and Paul Crowther for useful suggestions and feedback following our earlier papers in this area. SMH would also like to thank Joanne Bibby for her invaluable advice and knowledge on spectral data reduction. This research has made use of the NASA/IPAC Extragalactic Database (NED) which is operated by the Jet Propulsion Laboratory, California Institute of Technology under contract with the National Aeronautics and Space Administration. The Liverpool Telescope is operated on the island of La Palma by Liverpool John Moores University in the Spanish Observatorio del Roque de los Muchachos of the Instituto de Astrofísica de Canarias with financial support from the UK Science and Technology Facilities Council. The Isaac Newton Telescope is operated on the island of La Palma by the Isaac Newton Group in the Spanish Observatorio del Roque de los Muchachos of the Instituto de Astrofísica de Canarias. Also based on observations made with the ESO 2.2 m telescope at the La Silla Observatory (programme ID 084.D.0195). JPA acknowledges fellowship funding from FONDECYT, project number 3110142, and partial support from by Iniciativa Cientifica Milenio through the Millennium Center for Supernova Science (P10-064-F). PAJ and SMH acknowledge the UK Science and Technology Facilities Council for research grant and research studentship support, respectively.
References
- Alonso-Herrero et al. (2000) Alonso-Herrero A., Rieke G. H., Rieke M. J., Scoville N. Z., 2000, ApJ, 532, 845
- Anderson & James (2008) Anderson J. P., James P. A., 2008, MNRAS, 390, 1527
- Anderson & James (2009) Anderson J. P., James P. A., 2009, MNRAS, 399, 559
- Anderson et al. (2010) Anderson J. P., Covarrubias R. A., James P. A., Hamuy M., Habergham S. M., 2010, MNRAS, 407, 2660
- Anderson, Habergham, & James (2011) Anderson J. P., Habergham S. M., James P. A., 2011, MNRAS, 416, 567
- Anderson et al. (2012) Anderson J. P., Habergham S. M., James P. A., Hamuy M., 2012, MNRAS accepted, arXiv:1205.3802
- Arcavi et al. (2010) Arcavi I., Gal-Yam A., Kasliwal M. M., Quimby R. M., Ofek E. O., Kulkarni S. R., Nugent P. E., Cenko S. B., Bloom J. S., Sullivan M., Howell D. A., Poznanski D., Filippenko A. V., Law N., Hook I., Jönsson J., Blake S., Cooke J., Dekany R., Rahmer G., Hale D., Smith R., Zolkower J., Velur V., Walters R., Henning J., Bui K., McKenna D., Jacobsen J., 2010, ApJ, 721, 777
- Armus et al. (2009) Armus L., Mazzarella J. M., Evans A. S., Surace J. A., Sanders D. B., Iwasawa K., Frayer D. T., Howell J. H., Chan B., Petric A., Vavilkin T., Kim D. C., Haan S., Inami H., Murphy E. J., Appleton P. N., Barnes J. E., Bothun G., Bridge C. R., Charmandaris V., Jensen J. B., Kewley L. J., Lord S., Madore B. F., Marshall J. A., Melbourne J. E., Rich J., Satyapal S., Schulz B., Spoon H. W. W., Sturm E., U, V., Veilleux S., Xu K., 2009, PASP, 121, 559
- Barnes & Hernquist (1991) Barnes J. E., Hernquist L. E., 1991, ApJ, 370, L65
- Barnes & Hernquist (1996) Barnes J. E., Hernquist L., 1996, ApJ, 471, 115
- Bartunov, Makarova, & Tsvetkov (1992) Bartunov O. S., Makarova I. N., Tsvetkov D. I., 1992, A&A, 264, 428
- Bartunov, Tsvetkov, & Filimonova (1994) Bartunov O. S., Tsvetkov D. Y., Filimonova I. V., 1994, PASP, 106, 1276
- Boissier & Prantzos (2009) Boissier S., Prantzos N., 2009, A&A, 503, 137
- Cappellaro et al. (1993) Cappellaro E., Turatto M., Benetti S., Tsvetkov D. Y., Bartunov O. S., Makarova I. N., 1993, A&A, 273, 383
- Caputi et al. (2009) Caputi K. I., et al., 2009, ApJ, 707, 1387
- Conselice, Bershady, & Jangren (2000) Conselice C. J., Bershady M. A., Jangren A., 2000, ApJ, 529, 886
- Crowther (2007) Crowther P. A., 2007, ARA&A, 45, 177
- Dessart et al. (2011) Dessart L., Hillier D. J., Livne E., Yoon S.-C., Woosley S., Waldman R., Langer N., 2011, MNRAS, 414, 2985
- Djorgovski & Meylan (1993) Djorgovski S., Meylan G., 1993, American Astronomical Society Meeting Abstracts, 182, 50.15
- Ekström et al. (2012) Ekström S., Georgy C., Eggenberger P., Meynet G., Mowlavi N., Wyttenbach A., Granada A., Decressin T., Hirschi R., Frischknecht U., Charbonnel C., Maeder A., 2012, A&A, 537, 146
- Eldridge & Tout (2004) Eldridge J. J., Tout C. A., 2004, MNRAS, 353, 87
- Eldridge, Izzard & Tout (2008) Eldridge J. J., Izzard R. G., Tout C. A., 2008, MNRAS, 384, 1109
- Eldridge, Langer & Tout (2011) Eldridge J. J., Langer N., Tout C. A., 2011, MNRAS, 414, 3501
- Elias-Rosa et al. (2011) Elias-Rosa N., van Dyk S. D., Li W., Silverman J. M., Foley R. J., Ganeshalingam M., Mauerhan J. C., Kankare E., Jha S., Filippenko A. V., Beckman J. E., Berger E., Cuillandre J. C., Smith N., 2011, ApJ, 742, 6
- Elmegreen & Efremov (1997) Elmegreen B. G., Efremov Y. N., 1997, ApJ, 480, 235
- Evans, van den Bergh & McClure (1989) Evans R., van den Bergh S., McClure R. D., 1989, ApJ, 345, 752
- Filippenko (1982) Filippenko A. V., 1982, PASP, 94, 715
- Filippenko (1997) Filippenko A. V., 1997, ARA&A, 35, 309
- Franceschini et al. (2003) Franceschini A., et al., 2003, MNRAS, 343, 1181
- Fraser et al. (2012) Fraser M., Maund J. R., Smartt S. J., Botticella M.-T., Dall’Ora M., Inserra C., Tomasella L., Benetti S., Ciroi S., Eldridge J. J., Ergon M., Kotak R., Mattila S., Ochner P., Pastorello A., Reilly E., Sollerman J., Stephens A., Taddia F., Valenti S., 2012, submitted, arXiv:1204.1523
- Gal-Yam et al. (2007) Gal-Yam A., et al., 2007, ApJ, 656, 372
- Georgy et al. (2009) Georgy C., Meynet G., Walder R., Folini D., Maeder A., 2009, A&A, 502, 611
- Georgy et al. (2012) Georgy C., Ekström S., Meynet G., Massey P., Levesque E. M., Hirschi R., Eggenberger P., Maeder A., 2012, arXiv:1203.5243
- Habergham, Anderson, & James (2010) Habergham S. M., Anderson J. P., James P. A., 2010, ApJ, 717, 342
- Hakobyan et al. (2009) Hakobyan A. A., Mamon G. A., Petrosian A. R., Kunth D., Turatto M., 2009, A&A, 508, 1259
- Heger et al. (2003) Heger A., Fryer C. L., Woosley S. E., Langer N., Hartmann D. H., 2003, ApJ, 591, 288
- Henry & Worthey (1999) Henry R. B. C., Worthey G., 1999, PASP, 111, 919
- Hibbard & van Gorkom (1996) Hibbard J. E., van Gorkom J. H., 1996, AJ, 111, 655
- Iwasawa et al. (2011) Iwasawa K., Sanders D. B., Teng S. H., U V., Armus L., Evans A. S., Howell J. H., Komossa S., Mazzarella J. M., Petric A. O., Surace J. A., Vavilkin T., Veilleux S., Trentham N., 2011, A&A, 529, A106
- James & Anderson (2006) James P. A., Anderson J. P., 2006, A&A, 453, 57
- Joseph et al. (1984) Joseph R. D., Meikle W. P. S., Robertson N. A., Wright G. S., 1984, MNRAS, 209, 111
- Joseph & Wright (1985) Joseph R. D., Wright G. S., 1985, MNRAS, 214, 87
- Kaiser et al. (2010) Kaiser N., Burgett W., Chambers K., Denneau L., Heasley J., Jedicke R., Magnier E., Morgan J., Onaka P., Tonry J., 2010, SPIE, 7733, 12
- Keel et al. (1985) Keel W. C., Kennicutt R. C., Jr., Hummel E., van der Hulst J. M., 1985, AJ, 90, 708
- Kelly & Kirshner (2011) Kelly P. L., Kirshner R. P., 2011, submitted, arXiv: 1110.1377v2
- Kennicutt & Keel (1984) Kennicutt R. C., Jr., Keel W. C., 1984, ApJ, 279, L5
- Kennicutt et al. (1987) Kennicutt R. C., Jr., Roettiger K. A., Keel W. C., van der Hulst J. M., Hummel E., 1987, AJ, 93, 1011
- Kewley, Geller & Barton (2006) Kewley L. J., Geller M. J., Barton E. J., 2006a, AJ, 131, 2004
- Kewley et al. (2010) Kewley L. J., Rupke D., Zahid H. J., Geller M. J., Barton E. J., 2010, ApJL, 721, 48
- Kiewe et al. (2012) Kiewe M., Gal-Yam A., Arcavi I., Leonard D. C., Emilio Enriquez J., Cenko S. B., Fox D. B., Moon D.-S., Sand D. J., Soderberg A. M., CCCP T., 2012, ApJ, 744, 10
- Klessen, Spaans, & Jappsen (2007) Klessen R. S., Spaans M., Jappsen A.-K., 2007, MNRAS, 374, L29
- Kruijssen et al. (2012) Kruijssen J. M. D., Pelupessy F. I., Lamers H. J. G. L. M., Portegies Zwart S. F., Bastian N., Icke V., 2012, MNRAS, 421, 1927
- Kudritzki & Puls (2000) Kudritzki R.-P., Puls J., 2000, ARA&A, 38, 613
- Larson & Tinsley (1978) Larson R. B., Tinsley B. M., 1978, ApJ, 219, 46
- Law et al. (2009) Law N. M., Kulkarni S. R., Dekany R. G., Ofek E. O., Quimby R. M., Nugent P. E., Surace J., Grillmair C. C., Bloom J. S., Kasliwal M. M., Bildsten L., Brown T., Cenko S. B., Ciardi D., Croner E., Djorgovski S. G., van Eyken J., Filippenko A. V., Fox D. B., Gal-Yam A., Hale D., Hamam N., Helou G., Henning J., Howell D. A., Jacobsen J., Laher R., Mattingly S., McKenna D., Pickles A., Poznanski D., Rahmer G., Rau A., Rosing W., Shara M., Smith R., Starr D., Sullivan M., Velur V., Walters R., & Zolkower J., 2009, PASP, 121, 1395
- Leloudas et al. (2011) Leloudas G., Gallazzi A., Sollerman J., Stritzinger M. D., Fynbo J. P. U., Hjorth J., Malesani D., Michałowski M. J., Milvang-Jensen B., Smith M., 2011, A&A, 530, A95
- Lennarz, Altmann & Wiebusch (2012) Lennarz D., Altmann D., Wiebusch C., 2012, A&A, 538, 120
- Li, Mac Low & Klessen (2004) Li Y., Mac Low M.-M., Klessen R. S., 2004, ApJL, 614, 29
- Li et al. (2005) Li W., Van Dyk S. D., Filippenko A. V., Cuillandre J.-C., 2005, PASP, 117, 121
- Li et al. (2011) Li W., et al., 2011, MNRAS, 412, 1441
- Lotz, Primack & Madau (2004) Lotz J. M., Primack J., Madau P., 2004, AJ, 128, 168
- Maíz-Apellániz et al. (2004) Maíz-Apellániz J., Bond H. E., Siegel M. H., Lipkin Y., Maoz D., Ofek E. O., Poznanski D., 2004, ApJ, 615, L113
- Maund et al. (2011) Maund J. R., Fraser M., Ergon M., Pastorello A., Smartt S. J., Sollerman J., Benetti S., Botticella M. T., Bufano F., Danziger I. J., Kotak R., Magill L., Stephens A. W., Valenti S., 2011, ApJL, 739, L37
- Maund & Smartt (2005) Maund J. R., Smartt S. J., 2005, MNRAS, 360, 288
- Meurer et al. (1995) Meurer G. R., Heckman T. M., Leitherer C., Kinney A., Robert C., Garnett D. R., 1995, AJ, 110, 2665
- Meynet et al. (1994) Meynet G., Maeder A., Schaller G., Schaerer D., Charbonnel C., 1994, A&AS, 103, 97
- Meynet & Maeder (2003) Meynet G., Maeder A., 2003, A&A, 404, 975
- Meynet & Maeder (2005) Meynet G., Maeder A., 2005, A&A, 429, 581
- Mihos & Hernquist (1994) Mihos J. C., Hernquist L., 1994, ApJ, 425, L13
- Mihos & Hernquist (1996) Mihos J. C., Hernquist L., 1996, ApJ, 464, 641
- Milone et al. (2008) Milone A. P., Piotto G., Bedin L. R., Sarajedini A., 2008, Mem. Soc. Astron. Ital., 79, 623
- Minkowski (1941) Minkowski R., 1941, PASP, 53, 224
- Miralles-Caballero et al. (2011) Miralles-Caballero D., Colina L., Arribas S., Duc P. A., 2011, AJ, 142, 79
- Modjaz et al. (2011) Modjaz M., Kewley L., Bloom J. S., Filippenko A. V., Perley D., Silverman J. M., 2011, ApJ, 731, L4
- Mokiem et al. (2007) Mokiem M. R., et al., 2007, A&A, 473, 603
- Muller et al. (1992) Muller R. A., Newberg H. J. M., Pennypacker C. R., Perlmutter S., Sasseen T. P., Smith C. K., 1992, ApJ, 384, L9
- Neff, Ulvestad & Teng (2004) Neff S. G., Ulvestad J. S., Teng S. H., 2004, ApJ, 611, 186
- Pastorello et al. (2004) Pastorello A., Zampieri L., Turatto M., Cappellaro E., Meikle W. P. S., Benetti S., Branch D., Baron E., Patat F., Armstrong M., Altavilla G., Salvo M., Riello M., 2004, MNRAS, 347, 74
- Perets et al. (2010) Perets H. B., Gal-Yam A., Mazzali P. A., Arnett D., Kagan D., Filippenko A. V., Li W., Arcavi I., Cenko S. B., Fox D. B., Leonard D. C., Moon D.-S., Sand D. J., Soderberg A. M., Anderson J. P., James P. A., Foley R. J., Ganeshalingam M., Ofek E. O., Bildsten L., Nelemans G., Shen K. J., Weinberg N. N., Metzger B. D., Piro A. L., Quataert E., Kiewe M., Poznanski D., 2010, Nature, 465, 322
- Pérez-Torres et al. (2009) Pèrez-Torres, M. A., Romero-Cañizales, C., Alberdi, A., Polatidis A., 2009, A&A, 507, 17
- Petrosian et al. (2005) Petrosian A., Navasardyan H., Cappellaro E., McLean B., Allen R., Panagia N., Leitherer C., MacKenty J., Turatto M., 2005, AJ, 129, 1369
- Pettini & Pagel (2004) Pettini M., Pagel B. E. J., 2004, MNRAS, 348, L59
- Podsiadlowski, Joss, & Hsu (1992) Podsiadlowski P., Joss P. C., Hsu J. J. L., 1992, ApJ, 391, 246
- Prantzos & Boissier (2003) Prantzos N., Boissier S., 2003, A&A, 406, 259
- Puls et al. (1996) Puls J., Kudritzki R. P., Herrero A., Pauldrach A. W. A., Hser S. M., Lennon D. J., Gabler R., Voels S. A., Vilchez J. M., Wachter S., Feldmeier A., 1996, A&A, 305, 171
- Rampazzo et al. (2005) Rampazzo R., Plana H., Amram P., Bagarotto S., Boulesteix J., Rosado M., 2005, MNRAS, 356, 1177
- Rau et al. (2009) Rau A., Kulkarni S. R., Law N. M., Bloom J. S., Ciardi, D., Djorgovski G. S., Fox D. B., Gal-Yam A., Grillmair C. C., Kasliwal M. M., Nugent P. E., Ofek E. O., Quimby R. M., Reach W. T., Shara M., Bildsten L., Cenko S. B., Drake A. J., Filippenko A. V., Helfand D. J., Helou G., Howell D. A., Poznanski D.& Sullivan M. 2009, PASP, 121, 1334
- Rich et al. (2012) Rich J. A., Torrey P., Kewley L. J., Dopita M. A., Rupke D. S. N., 2012, arXiv:1204.5520
- Rupke, Kewley & Chien (2010) Rupke D. S. N., Kewley L. J., Chien L.-H., 2010, ApJ, 723, 1255
- Sanders & Mirabel (1996) Sanders D. B., Mirabel I. F., 1996, ARA&A, 34, 749
- Schmidt (1959) Schmidt M., 1959, ApJ, 129, 243
- Shaw (1979) Shaw R. L., 1979, A&A, 76, 188
- Smartt (2009) Smartt S. J., 2009, ARA&A, 47, 63
- Smartt et al. (2009) Smartt S. J., Eldridge J. J., Crockett R. M., Maund J. R., 2009, MNRAS, 395, 1409
- Smith et al. (2011) Smith N., Li W., Filippenko A. V., Chornock R., 2011, MNRAS, 412, 1522
- Sollima et al. (2007) Sollima A., Beccari G., Ferraro F. R., Fusi Pecci F., Sarajedini A., 2007, MNRAS, 380, 781
- Sollima (2008) Sollima A., 2008, MNRAS, 388, 307
- Sollima et al. (2010) Sollima A., Carballo-Bello J. A., Beccari G., Ferraro F. R., Pecci F. F., Lanzoni B., 2010, MNRAS, 401, 577
- Surace (1998) Surace J. A., 1998, Ph.D. thesis, Univ. Hawaii
- Thöne et al. (2009) Thöne C. C., Michałowski M. J., Leloudas G., Cox N. L. J., Fynbo J. P. U., Sollerman J., Hjorth J., Vreeswijk P. M., 2009, ApJ, 698, 1307
- Tsvetkov, Pavlyuk, & Bartunov (2004) Tsvetkov D. Y., Pavlyuk N. N., Bartunov O. S., 2004, Astronomy Letters, 30, 729
- van den Bergh (1997) van den Bergh S., 1997, AJ, 113, 197
- van den Bergh, Li & Filippenko (2005) van den Bergh S., Li W., Filippenko, A. V., 2005, PASP, 117, 773
- Van Dyk (1992) Van Dyk S. D., 1992, AJ, 103, 1788
- Van Dyk, Hamuy & Filippenko (1996) Van Dyk S. D., Hamuy M., Filippenko A. V., 1996, AJ, 111, 2017
- Van Dyk et al. (2000) Van Dyk S. D., Peng C. Y., King J. Y., Filippenko A. V., Treffers R. R., Li W., Richmond M. W., 2000, PASP, 112, 1532
- Veilleux, Kim & Sanders (2002) Veilleux S., Kim D.-C., Sanders D. B., 2002, ApJS, 143, 315
- Yoon, Woosley & Langer (2010) Yoon S.-C., Woosley S. E., Langer N., 2010, ApJ, 725, 940
- Zamojski et al. (2011) Zamojski M., Yan L., Dasyra K., Sajina A., Surace J., Heckman T., Helou G., 2011, ApJ, 730, 125