Analysis of a Fragmenting Sunspot using Hinode Observations
Abstract
We employ high resolution filtergrams and polarimetric measurements from Hinode to follow the evolution of a sunspot for eight days starting on June 28, 2007. The imaging data were corrected for intensity gradients, projection effects, and instrumental stray light prior to the analysis. The observations show the formation of a light bridge at one corner of the sunspot by a slow intrusion of neighbouring penumbral filaments. This divided the umbra into two individual umbral cores. During the light bridge formation, there was a steep increase in its intensity from 0.28 to 0.7 in nearly 4 hr, followed by a gradual increase to quiet Sun (QS) values in 13 hr. This increase in intensity was accompanied by a large reduction in the field strength from 1800 G to 300 G. The smaller umbral core gradually broke away from the parent sunspot nearly 2 days after the formation of the light bridge rendering the parent spot without a penumbra at the location of fragmentation. The penumbra in the fragment disappeared first within 34 hr, followed by the fragment whose area decayed exponentially with a time constant of 22 hr. In comparison, the parent sunspot area followed a linear decay rate of 0.94 Mm2 hr-1. The depleted penumbra in the parent sunspot regenerated when the inclination of the magnetic field at the penumbra-QS boundary became within 40∘ from being completely horizontal and this occurred near the end of the fragment’s lifetime. After the disappearance of the fragment, another light bridge formed in the parent which had similar properties as the fragmenting one, but did not divide the sunspot. The significant weakening in field strength in the light bridge along with the presence of granulation is suggestive of strong convection in the sunspot which might have triggered the expulsion and fragmentation of the smaller spot. Although the presence of QS photospheric conditions in sunspot umbrae could be a necessary condition for fragmentation, it is not a sufficient one.
Subject headings:
Sun: magnetic fields—sunspots—techniques: photometric—polarimetric1. Introduction
The solar magnetic field is distributed on a wide range of spatial scales. Sunspots can be regarded as the largest magnetic structures with diameters of 20-40 Mm and field strengths in excess of 2.5 kG at the photosphere (see Solanki (2003) and Borrero & Ichimoto (2011) for reviews on the properties of sunspots). The average lifetime of a sunspot is of the order of several days (Ringnes, 1964) and its equilibrium configuration is determined by the balance of forces due to gravity, the magnetic field, and the gas pressure (Priest, 1982).
The formation of sunspots is initiated by the coalescence of smaller magnetic elements which rise from the convection zone to the surface due to buoyancy. The systematic merging of these fragments often results in a pore which is characterized by strong and relatively vertical fields ranging from 1 to 1.5 kG. Partial penumbral formation occurs when the magnetic flux exceeds 1–1.5 Mx (Leka & Skumanich, 1998). The penumbra develops very rapidly, with pieces of it being completed within an hour or less (Bumba, 1965; Keppens & Martínez Pillet, 1996). A newly formed penumbral segment is practically indistinguishable from a more mature one in terms of field strengths, inclination angles and continuum intensities (Leka & Skumanich, 1998). Recent high resolution observations by Schlichenmaier et al. (2010a) illustrate the rapid sector-wise formation of the penumbra, which fills half the umbral circumference in about 4 hr. The development of a rudimentary penumbra initiates the Evershed flow (Evershed, 1909), a nearly horizontal outflow of plasma that starts in the inner penumbra and returns to the solar surface in the mid penumbra and beyond. During the formation of sunspots, the umbra is often divided by one or several light bridges which tend to demarcate individual magnetic regions (Bumba, 1965). Light bridges can also be seen during sunspot fragmentation (Bumba, 1965; García de La Rosa, 1987). They are considered ‘field-free’ intrusions in umbrae (Parker, 1979; Choudhuri, 1986) or manifestations of magneto-convection (Rimmele, 1997; Hirzberger et al., 2002).
According to McIntosh (1981), the decay of sunspots starts almost as soon as they are formed. Observations by Wallenhorst & Topka (1982) indicated the absence of spreading or diffusion during the decay, suggesting the in-situ disappearance of the magnetic field. However, it is believed that the decay of sunspots could occur through ohmic diffusion across a current sheet around the sunspot (Gokhale & Zwaan, 1972) or through moving magnetic features (MMFs)—magnetic elements that stream from the outer penumbra into the surrounding moat. MMFs are observed as extensions of penumbral filaments (Sainz Dalda & Martínez Pillet, 2005; Cabrera Solana et al., 2006; Ravindra, 2006; Sainz Dalda & Bellot Rubio, 2008), sometimes driven by ‘Evershed clouds’ (Shine et al., 1994; Cabrera Solana et al., 2007, 2008)—velocity patches that appear inside the penumbra and propagate radially outward along penumbral filaments. The net flux transported out of a sunspot by MMFs is estimated to be (0.4-6.2) Mx hr-1 (Hagenaar & Shine, 2005). Thus, a sunspot of Mx would disintegrate within one or several weeks if the sunspot flux is removed by MMFs alone. Recent observations of a sunspot region by Kubo et al. (2008) indicate a flux change rate and a transport rate of Mx hr-1 and 2.8 Mx hr-1, respectively. Although MMFs are indicative of sunspot decay (Harvey & Harvey, 1973), their origin could be related to the interaction between penumbral field lines, the Evershed mass flow, and the moat flow, not to the decay process itself (Martínez Pillet, 2002; Kubo, Shimizu & Tsuneta, 2007).
It is important to understand the nature and role of small-scale instabilities in the decay of sunspots. While detailed 3D MHD simulations of active region formation are available (e.g., Cheung et al., 2010), the process of sunspot fragmentation has not been modeled yet and is therefore poorly understood. In this paper, the evolution of a fragmenting sunspot is investigated using high resolution filtergrams and spectropolarimetric measurements from the Japanese satellite Hinode (Kosugi et al., 2007). The long time sequences provided by Hinode are ideally suited for this kind of study. We observed and analyzed the following processes: i) the formation of a light bridge in the umbra; ii) the fragmentation of the sunspot at the position of the light bridge; iii) the decay of the fragment; iv) the restoration of the penumbra in the parent sunspot; v) the area and flux decay of the spot; vi) the rotation of the fragment about the parent; and vii) the change in horizontal proper motions caused by the fragmentation. The aim of this work is to identify in-situ conditions leading to fragmentation and the different phases of sunspot evolution so as to provide useful constraints for 3D MHD models. Section 2 describes the data processing and Section 3 presents the main results of the analysis. We summarize the sunspot evolution and discuss our findings in Section 4.

2. Observations and Data Processing
2.1. Imaging data
We employ high resolution G-band filtergrams of NOAA AR 10961 recorded from June 28 to July 5, 2007 by the Broadband Filter Imager (BFI) of the Solar Optical Telescope (SOT; Tsuneta et al., 2008) on board Hinode. The filtergrams have a spatial sampling of 0109 and were taken in the 22 binning mode with sizes varying from 1k1k to 2k1k. The Level-0 G-band images were corrected for dark current, flat field, and bad pixels using the fg_prep routine in SolarSoft. Additional corrections are described below.
Intensity Gradients: The G-band data set covers the sunspot’s transit across the solar disc, from heliocentric angles () of close to the east limb to near the west limb. Consequently, intensity gradients in the image arising from ‘limb darkening’ (Milne, 1921; Bhm-Vitense, 1997) as well as residual flat-field errors ought to be corrected. A procedure for correcting such intensity variations on Hinode G-band images has been described by Tan et al. (2009). They selected a horizontal line sampling the quiet Sun (QS) granulation and used a fifth degree polynomial to fit the intensity as a function of and derive the limb darkening coefficients. A different approach is described below. The filtergrams were first normalized to the average QS intensity of the images taken close to disc center (). A 100100 pixel area was then used to compute the mean QS intensity in all the images. The variation of intensity as a function of the corresponding to the central pixel of the selected area is shown in the top panel of Figure 1. The coefficients given in the figure were obtained from a second degree polynomial fit. Using these coefficients, the intensity from each pixel was corrected as . The effect of the correction is illustrated in Figure 1 for a horizontal cut across the QS in a filtergram taken on June 28, 2007, when the sunspot was located at a heliocentric angle of 38∘.
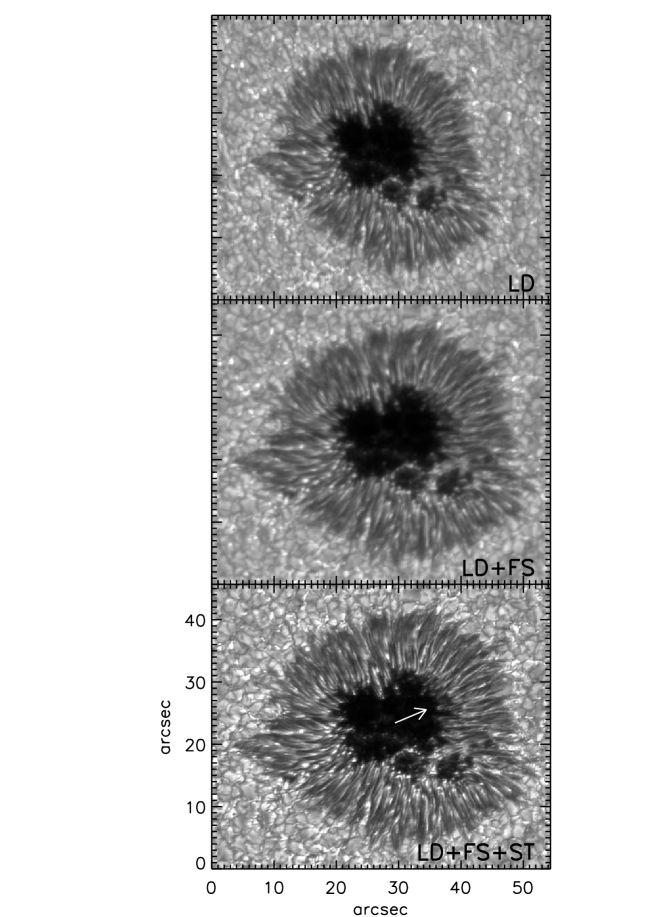
Geometric Foreshortening: Geometric foreshortening produces a projected image of the sunspot as it traverses the solar disk from East to West. A coordinate transformation described by Gary & Hagyard (1990) was performed to render the filtergrams into the heliographic plane (, ) from the observed image plane (, ). The middle panel of Figure 2 depicts the sunspot after correction for geometric foreshortening.
Instrumental Stray Light: The presence of stray light in the Hinode broadband filtergrams arising from instrumental scattering and its correction have been described by Mathew et al. (2009) using transit observations of Mercury on November 8, 2006. In that paper, the Level-1 images were deconvolved using a Point Spread Function (PSF) consisting of a weighted linear combination of 4 Gaussians. As a result, the contrast of bright points in the quiet Sun improved by a factor of 1.7 in the G band (430 nm). The PSF derived by Mathew et al. (2009) is used here to remove stray light from the G-band filtergrams assuming that the images corrected for foreshortening are equivalent to those obtained with the telescope pointing to disc center (the conditions of the transit observations). The improvement in the image contrast after removal of stray light is shown in the bottom panel of Figure 2, when the sunspot was located at S14E38 on June 28, 2007. The implication of scattered light on the fine structure of sunspots using Hinode filtergrams is detailed in a separate work (Louis et al., 2012).
2.2. Spectropolarimetric data
In addition to the G-band filtergrams, we also use observations taken by the SOT spectropolarimeter (SP; Lites et al., 2001; Ichimoto et al., 2008). This instrument measured the four Stokes profiles of the iron lines at 630 nm with a spectral sampling of 21.55 mÅ, a pixel size of 032, and an exposure time of 1.6 s per slit position (fast map mode). The SP data were corrected for dark current, flat field, thermal flexures, and instrumental polarization using sp_prep.pro. The continuum maps at 630 nm were also corrected for intensity gradients in a similar manner as the G-band images. Maps of field strength, inclination and azimuth were obtained from a Milne-Eddington inversion of the observed Stokes profiles using the MERLIN code111The inversion results can be found at the Community Spectropolarimetric Analysis Center, http://sot.lmsal.com/data/sot/level2hao_new/. The procedure described by Crouch et al. (2009) was applied to the vector magnetograms to resolve the 180∘ azimuth ambiguity. The resulting vector magnetic fields were subsequently transformed to the local reference frame.
3. Results
3.1. General Description of Sunspot Evolution
NOAA AR 10961 appeared close to the East limb during the early part of June 25, 2007. The spot moved across the disc at about S and disappeared beyond the West limb on July 7.
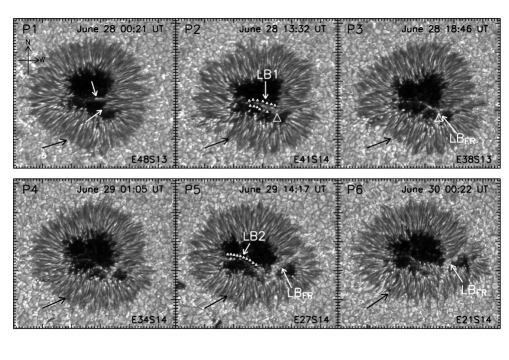
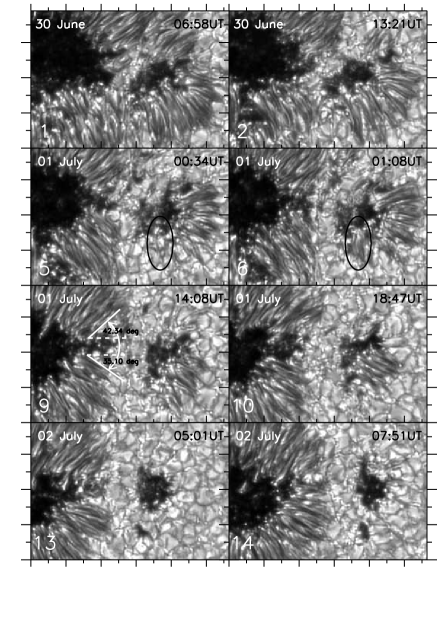
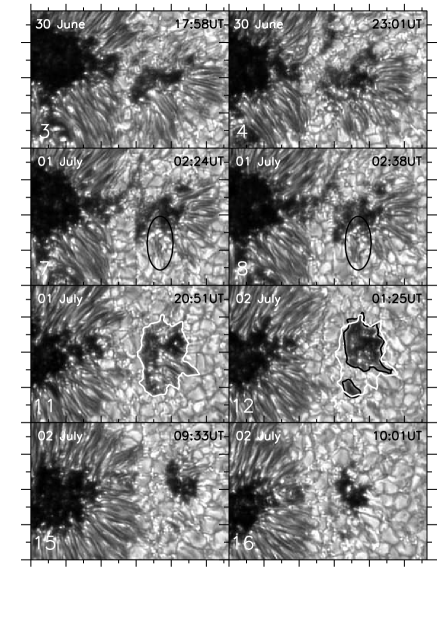
Our data set begins on June 28 and shows a fairly regular sunspot with a well developed penumbra (panel P1 of Figure 3). The western side of the umbra-penumbra boundary shows two penumbral filaments extending into the umbra (white arrows in P1). These filaments progress deeper into the umbra eastwards giving rise to a light bridge labeled ‘LB1’ in P2 and outlined by tiny white triangles. The apex of the large white triangle indicates a narrow umbral region between the intruding filament and the southern umbra-penumbra boundary (base of the triangle). This location witnesses the formation of another light bridge, labeled ‘LB’ in the following panel P3. The time taken for the formation of LB is approximately 5 hr. During this period, LB1 becomes narrower and fainter in comparison to its newly formed counterpart. Panel P5 shows LB increasing significantly in width from 485 km to 1295 km by the end of June 28, nearly 20 hr after it was formed. The panel also shows another light bridge ‘LB2’ (outlined with small white triangles), which can be regarded as a successor of LB1. While LB1 was a penumbral structure, LB2 predominantly consisted of umbral dots along its length. We choose to treat LB1 and LB2 as distinct structures based on their different morphology and time of formation.
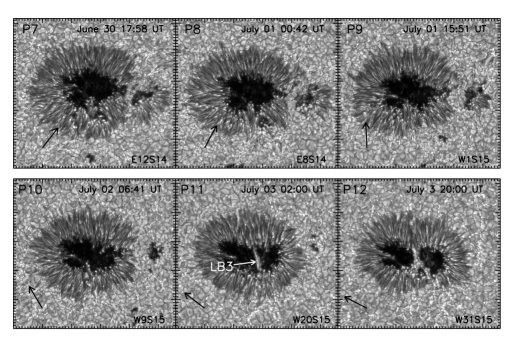
During the early part of June 30 (P6 in Figure 3), the symmetrical arrangement of the penumbral filaments near the southern section of the umbra-penumbra boundary gets further disturbed. This location coincides with one of the anchorage points of the light bridge LB. In addition, there are traces of disruption in the penumbra with the absence of penumbral filaments in the north-western sector of the sunspot, tracing outwards to the photosphere from the entrance of LB. The part of the sunspot encompassed by the LB starts to separate from the parent sunspot around 18:00 UT on June 30, as can be seen in P7. At this stage, the two umbral boundaries marked by the light bridge are separated by nearly 1.7 Mm and the morphology of the light bridge resembles the quiet Sun photosphere. By the end of June 30, the fragmentation is complete with the sunspot and its fragment being well separated. They remain within a distance of 10′′ from each other.
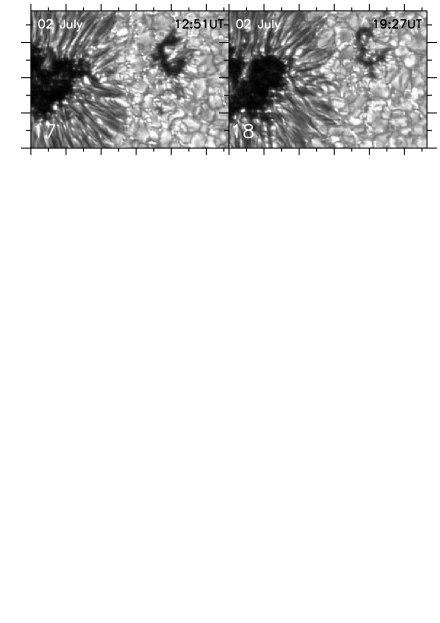
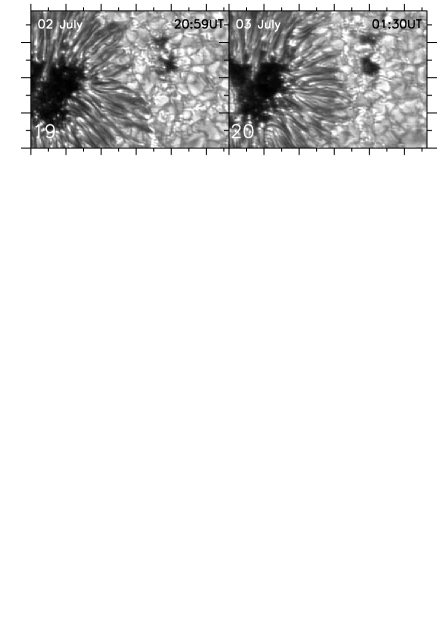
The penumbra in the fragment gradually gets depleted as shown in P8 - P9. By the early part of July 2, there are only minor traces of it in the remnant pore (P10). The penumbra in the parent sunspot gradually becomes symmetrical and ordered with the exception of the region closest to the fragment where the penumbral filaments are much shorter in length and can be considered rudimentary. The decay of the fragment and restoration of the penumbra in the parent are further elaborated in Section 3.2.3. The decaying pore is only seen as traces of smaller fragments during the early part of July 3 (P11). While the parent spot has a well developed penumbra uniformly structured all around the umbra by July 3, a conspicuous light bridge ‘LB3’ is seen running from the northern to southern end of the umbra-penumbra boundary, nearly splitting the umbra into two equal halves. LB3 progressively becomes broader and exhibits large granules along its length. By June 5 the penumbra close to the southern part of LB3 gets gradually depleted (P12). The sunspot retains this configuration until it advances over the Western limb on July 7, 2007.

3.2. Evolution of Light Bridge and Penumbrae
This section describes the small-scale changes in the light bridge and penumbrae associated with the evolution and fragmentation of the sunspot.
3.2.1 Formation and Evolution of LB
The fragmentation of the sunspot is heralded by the formation of a light bridge in the south-west sector of the sunspot umbra (LB, also called LB in this section). The time sequence of G band images reveal that the LB formed as a result of a slow incursion of penumbral filaments from the north towards the southern umbra-penumbra boundary. This intrusion is accompanied by an increase in the intensity by a factor of 2 over a time duration of 12 hr starting at 1:49 UT on June 28. The speed of the filament motion into the umbra was estimated to be 0.08 km s-1 which is consistent with Katsukawa et al. (2007). During the latter half of June 28, a coherent narrow LB is formed, isolating the smaller umbral core from the parent umbra (P3 of Figure 3). At this time, the LB consists of several bright, grain-like structures with a faint dark boundary separating individual cells (not shown). Intensities of these grains are comparable to those of bright penumbral grains at the southern end of the LB. We put an upper limit of 10 hr from the intrusion of the penumbral filament to the formation of the LB. The following 24 hr witnesses an increase in the width of the LB as well as in the size of bright cells/grains on it, with the motion of the latter closely resembling those of photospheric granules.
The morphological transformation of the LB is accompanied by an increase in its intensity. The temporal variation of the mean intensity of the region where the LB formed is shown in Figure 4. The isolation of the smaller umbral core by the LB is seen as a jump in the G-band intensity, increasing from 0.28 to 0.7 in 4 hr. The steep increase is followed by a more gradual rise touching near QS-photospheric intensities close to midday of June 29. A Boltzmann sigmoid of the form
was used to fit the observed time variation of the mean G-band intensity. The coefficients and correspond to the top and bottom of the curve, respectively, is the time taken to reach halfway between the top and bottom values, and is the slope of the function (the larger its value, the shallower the curve). The best fit yields , , hr, and hr.
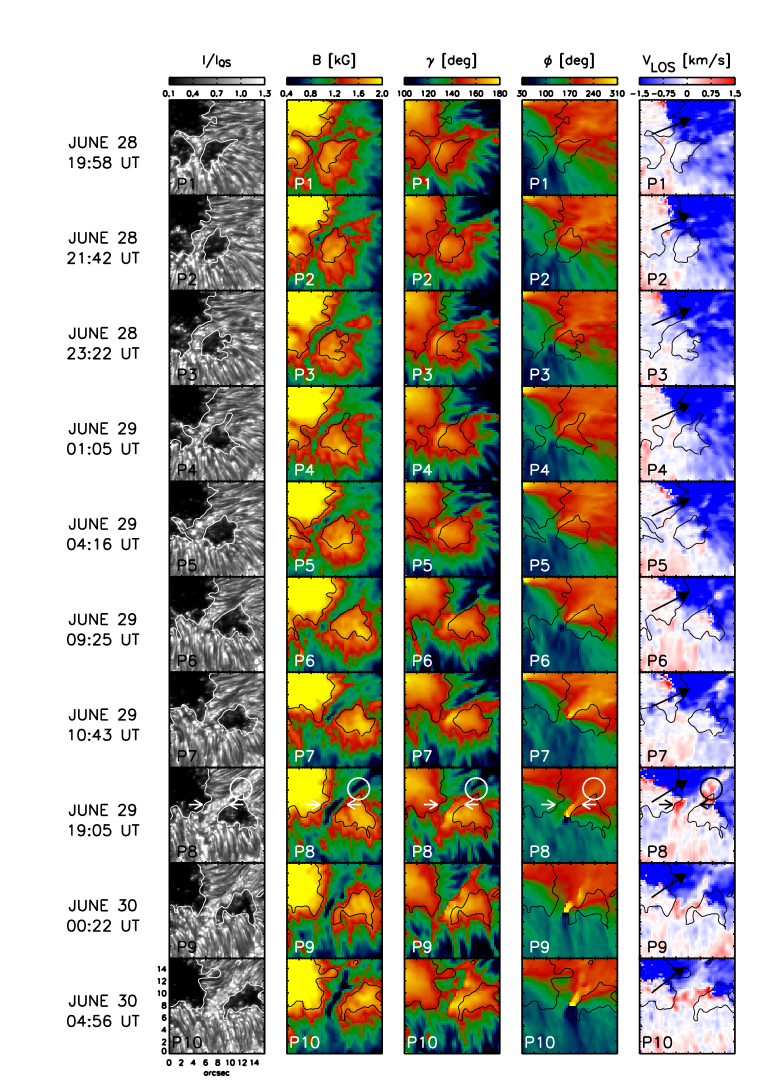
Figure 5 shows the temporal evolution of the G-band intensity, magnetic field strength, field inclination, field azimuth, and line-of-sight (LOS) velocity in the LB. The contours represent the umbral border and outline the LB. The time sequence of maps begins when the LB is already formed. While the main umbra consists of fields in excess of 2 kG, the smaller umbral region bounded by the LB is marginally weaker with an average field strength of 1.5 kG. Compared to the adjacent umbrae, the field strength in the LB is weaker by 500 G as seen in panels P1-P6. The magnetic field in the LB is relatively inclined with respect to the vertical, reaching values of 120-150∘. As a consequence of the smaller core being bounded by the LB, one azimuth center is located close to the central part of the LB on its western edge. The field is predominantly oriented across the LB. This is different to the configuration found in other LBs (e.g., Louis et al. (2008)). The LOS velocity in the LB (panels P1–P6) shows weak upflows in the range 0.1–0.35 km s-1, as well as downflows of 0.25–0.57 km s-1. These flows are quite weak in comparison to the penumbra whose disc and limb sides show velocities greater than 1km s-1.

Nearly 20 hr after its formation, the field strength along the axis of the LB drops to 650 G (P7). Panels P8–P10 indicate the following: i) the penumbra close to the northern entrance of the LB appears to be sidelined to the eastern edge while bright photospheric material is seen intruding from the periphery of the spot all the way to the LB, ii) the minimum field strength in the LB reduces to 300 G, iii) a narrow upflowing lane is seen along the central axis of the LB with downflows of 1.5 km s-1 adjacent to it, and iv) strong downflows are also seen in photospheric regions of the LB near penumbral filaments (circle in P8).
The LOS velocity and the field strength along a cut (arrow head across the LB in P8) indicate a reduction in field strength that coincides with the upflowing lane and is flanked by downflows on either side. The amplitude of Stokes in the pixels exhibiting the upflows is weaker than in the downflows. Downflows of up to 5 km s-1 are seen in the region marked with a circle in P8. The Stokes profiles emerging from those pixels show an extended hump characteristic of very large velocities. The magnitude of the downflows was derived from a two-component SIR inversion (Ruiz Cobo & Del Toro Iniesta, 1992) with height-independent parameters (except for temperature). The fill fraction of the fast component was estimated to be 16%.
The evolution of the mean and minimum field strengths in the region where the LB formed is depicted in Figure 6. The weakening of these quantities is similar to the trend seen in the G-band intensity. A Boltzmann sigmoid fit to the field strength reveals that the lower knee of the curve coincides with the weak fields detected in the LB on June 28, 19:05 UT (P8 of Figure 5). The morphology of the LB from this point onwards also appears distinct from the nearby penumbral features. The time taken for the field strength (and the continuum intensity) to reach halfway between the bottom and top values is 16 hr, starting from June 28. By comparison, the field strength of the neighbouring umbral region remained unaffected during the evolution and morphological transformation of the LB. With a significant field weakening in the LB and the onset of convection that is revealed by the upflows and downflows, the sunspot split close to midday of June 30, nearly 45 hr after the formation of the LB. The following section describes the evolution of the fragment and its subsequent decay.
3.2.2 Evolution of Fragment
Figure 7 depicts the temporal evolution of the sunspot fragment and the disappearance of its penumbra. The first panel shows the fragment during the early part of June 30 when it was still part of the parent sunspot. The angular span of the penumbra around the smaller umbral core which broke away is 120∘. Fragmentation commences with the depletion of penumbra close to the anchorage points of the light bridge. The penumbra is seen to reduce symmetrically on either side of the fragment, disappearing clockwise and counter-clockwise in the northern and southern penumbra, respectively. The angular span reduces to half its initial value within nearly 2 hours between June 30, 23:01 UT and July 1, 00:34 UT. The sector-wise disappearance of the penumbra is almost a reversal of the formation process observed by Schlichenmaier et al. (2010a). There is no major trace of the penumbra by July 2, with an isolated pore being the remnant of the fragment, although individual strands of the penumbra can be spotted around the pore (panel 12). There is also a reduction in the mean width of the fragment penumbra, which decreased from on June 30 to on July 1. The above values correspond to a 24 hr average.
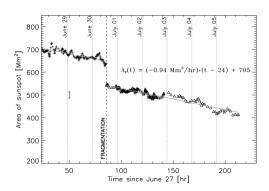
At the time of fragmentation on June 30, 13:39 UT, the fragment has an area of 92 Mm2 and decays exponentially with a time constant of hr (bottom panel of Figure 9). Panels 11 and 12 of Figure 7 depict the transition of the fragment to a pore devoid of a penumbra. This occurs between July 1, 20:51 UT and July 2, 01:25 UT. The white contour in panel 11 corresponds to the penumbra-QS boundary. It has also been overlaid in panel 12, which shows a large pore accompanied by a tiny magnetic patch located near the bottom edge of the white contour. The area of the fragment on July 1, 20:51 UT is 33 Mm2, with umbral and penumbral contributions of 14 and 19 Mm2, respectively. The pore and the patch lie within the white contour representing the fragment 4.5 hr earlier. The total area of the pore and its satellite fragment is 21 Mm2 at that moment. If the decrease in the area is attributed to the disappearance of the penumbra and if the natural decay rate of the fragment is neglected, then the pore and the patch ought to have decayed to at least 14 Mm2, which is inconsistent with the measured value. This suggests that the pore gets replenished with a fraction of the earlier decaying penumbra. During penumbral formation, the area of the umbra remains constant and the growth of the penumbra alone accounts for the increase in spot area (Schlichenmaier et al., 2010a; Rezaei et al., 2012). The process we have witnessed suggests a different behavior for penumbral decay.
One also finds evidence of transient penumbrae that appear and disappear close to the southern edge of the fragment. This is illustrated in panels 5 to 8 of Figure 7 with ellipses, which shows the appearance of rudimentary penumbrae in locations where photospheric granulation was observed earlier (panels 5 and 6). Such structures do not form stable penumbral filaments. Transient penumbrae can develop quite rapidly over periods of 30 min, but their disappearance is more gradual and occurs over periods of 1.5 hr or more. One can identify two distinct penumbral filaments at the position marked by the ellipse in panel 5 of Figure 7. Panel 7 shows several bright granules clustered together at the edge of the umbra-QS boundary with intensities comparable to those of regular penumbral grains. In a span of 15 min, a single penumbral filament is observed in this region. The rudimentary penumbra is not visible after July 1, 5:43 UT. Similar structures have been reported by Schlichenmaier et al. (2010a) during penumbral development, so they are not exclusive to penumbral decay.


3.2.3 Restoration of Penumbra in Parent Sunspot
The separation of the fragment renders a discontinuity in the azimuthal arrangement of the penumbra in the parent sunspot which coincides with LB. Panels 9 to 20 of Figure 7 show the intervening photosphere between the fragment and the parent sunspot. The angular span devoid of the penumbra in the parent is 80∘ (panel 9 of Figure 7). The appearance of a complete penumbra in this region is observed only towards the end of July 2, nearly 40 hr after the fragmentation. Furthermore, the length of the penumbral filaments in this region is about 1.5 times shorter than the average filament elsewhere in the sunspot. There is also a strong anti-correlation between the area of the fragment and the width of the parent’s penumbra closest to the fragment. This would suggest that the presence of the fragment hinders the formation of the penumbra in the parent spot.
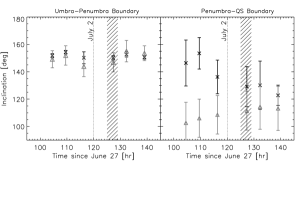
To determine the threshold of the magnetic field inclination and how it relates to the regeneration of the penumbra in the parent, we compare the field inclination () at the location of fragmentation with the rest of the sunspot having a regular penumbra, both for the umbra-penumbra boundary (UPB) and for the penumbra-QS boundary (PQB). The inclination in the region of fragmentation is calculated along the portion of the UPB and PQB intensity contours which is closer to the fragment. The left panel of Figure 8 shows the time evolution of at the UPB. The mean inclination is 150∘ at the location of fragmentation as well as the rest of the sunspot. However, the right panel shows the field becoming more inclined at the PQB, from 146∘ on July 1, 8:30 UT to 130∘ on July 2, 7:21 UT. The average value of in the rest of the sunspot shows typical values of 100–115∘, i.e., 10–25∘ from the horizontal (the spot is of negative polarity), which is consistent with Jurk (2011). The increase in inclination coincided with the growth of the penumbra that occurred between 5:00-9:00 UT on July 2 (refer panels 13 to 16 of Figure 7). Thus the radial width of the penumbra increased when the average field inclination at the border of the sunspot dropped below 130∘ (i.e., when the field became within 40∘ of being purely horizontal).
3.3. Area Decay of Sunspot and Fragment
Since the sunspot loses a significant area during the fragmentation process, it is necessary to compare its area and flux decay rates with that of the fragment. Estimation of the sunspot area relies on determining the intensity level separating the penumbra/umbra from the QS. Once the intensity at the interface is known, the area can be calculated from the total number of pixels within the corresponding contour. The intensity of the penumbra-QS boundary was determined with the help of the cumulative histogram method of Pettauer & Brandt (1997), which yielded a value of 0.925 for the G-band time sequence. In order to obtain a smooth contour, the filtergrams were filtered using a 77 pixel boxcar.
The top panel of Figure 9 shows the decay of the sunspot’s area with time. The sunspot area decreased from 697 Mm2 at 00:21 UT on June 28 to 636 Mm2 at 13:39 UT on June 30. A linear fit to the data points yields a decay rate of Mm2/day, or MSH/day2221 MSH = 6.3 arcsec2 with a jump of 93 Mm2 at the time of fragmentation.
The bottom panel of Figure 9 shows the area decay of the fragment. In contrast to the parent, the decay appears to be nonlinear. The exponential fit provides a lifetime of 98 hr if the minimum area of the fragment is assumed to be 2 Mm2 (the uncertainty of the area measurements). Observations show that the fragment survived for at least 76 hr after fragmentation, as traces of it were seen until the second half of July 3.
Figure 10 shows the temporal evolution of the longitudinal magnetic flux of the parent sunspot and its fragment. Using the inversion results, this quantity is computed as = , where represents the magnetic filling factor, and the magnetic field strength and inclination, and the area of pixel . The summation extends over all pixels. The magnetic flux of the parent remains nearly a constant at -5.01021 Mx over a duration of 61 hr up to the point of fragmentation. The flux is then observed to decay strongly at a rate of -4.91015 Mx s-1 till the disappearance of the fragment. The above value is consistent with that obtained by Deng et al. (2007) and Kubo et al. (2008). After the disappearance of the fragment, the decay rate increases to -7.3 1015 Mx s-1.
The magnetic flux of the fragment (bottom panel of Figure 10) amounts to -6.31020 Mx at the time of separation. By July 2 it decreased down to -2.21020 Mx. The decay of the penumbra in the fragment could be attributed to the order of magnitude deficit in the magnetic flux.
3.4. Rotation of Fragment about Parent Sunspot
During the evolution of the sunspot, the region enclosed by the light bridge appears to rotate in an anti-clockwise direction with respect to the main umbral core, as is evident from Figure 3. The rotation described in this section refers to the orbiting motion of the fragment around the center of the parent sunspot (Yan et al., 2008). In order to determine the rotation of the fragment, two points connecting the central axis and the rotating periphery need to be located. The centroid of each umbral core is calculated as
| (1) | |||||
| (2) |
The rotation angle is measured counter-clockwise from solar South (vertically downwards) to the line joining the two centroids. Over the course of 5 days the fragment rotated about the parent by nearly with an average rotation speed of /day. This is consistent with that obtained by Brown et al. (2003) for AR 9280333Incidentally, AR 9280 elongated and separated into two pores during its transit.. The separation between the parent and fragment, estimated as the distance between their centroid positions, increased almost linearly from approximately 10″ to 23″ in 5 days. As the rotation of the fragment is more pronounced than its parent, it would suggest that the sunspot as a whole is comprised of several individual magnetic strands rooted to a common flux system rooted deeper in the photosphere (Bello González et al., 2012).
3.5. Role of other LBs in Sunspot Evolution
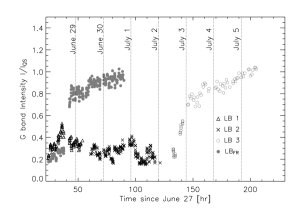
In addition to LB, there were several other LBs that were observed during the sunspot’s lifetime but did not cause fragmentation. This section compares various physical properties of the LBs seen in the active region to ascertain why fragmentation occurred. Figure 11 shows the time variation of G-band intensity in LB1, LB2 and LB3, the three LBs described in Section 3.1 and marked in Figure 3. To allow comparisons, the curve corresponding to LB is also included. The G-band intensities of LB1 and LB2 remain within 0.53 and do not exhibit any specific trend as a function of time. By comparison, the light curve of LB3 appears very similar to that of LB, with the intensity rising from umbral to near photospheric values in about 35 hr. The photometric properties of both LB3 and LB are consistent with each other as indicated in Table 1.
| Parameter | LB1 | LB2 | LB3 | LB | |
|---|---|---|---|---|---|
| Min | 0.21 | 0.15 | 0.22 | 0.18 | |
| G-band intensity [] | Max | 0.53 | 0.41 | 1.09 | 1.02 |
| Mean | 0.35 | 0.26 | 0.75 | 0.73 | |
| Min | 1160 | 1390 | 680 | 630 | |
| [G] | Max | 2150 | 2130 | 2330 | 1880 |
| Mean | 1720 | 1800 | 1620 | 1280 | |
| Min | 139 | 148 | 108 | 110 | |
| [deg] | Max | 172 | 168 | 166 | 176 |
| Mean | 158 | 159 | 135 | 150 | |
| Lifetime [hr] | 30 | 60 | 80 | 45 | |
| Area [Mm2] | 7.3 | 6.3 | 11.1 | 8.6∗ | |
| Umbral Fraction [%] | 23.7 | 15.6 | 38.4 | 5.9 | |
∗Area estimated on 18:31 UT June 28, 2007 after LB was formed.
The average field strengths in LB1 and LB2 exceed 1.5 kG, with a minimum field strength of more than 1.1 kG. In LB3, the corresponding values are 1.6 and 0.7 kG, respectively. This is comparable to LB, whose average and minimum field strengths are 1.3 and 0.6 kG, 34 hr prior to fragmentation. In addition, the field in LB1 and LB2 is mostly vertical with a mean inclination of about 160∘. This can be attributed to the fact that LB1 and LB2 morphologically resemble umbral dots and penumbral filament intrusions.
The LB lifetimes range from 1 to 2.5 days. LB3 in particular is quite long lived, since it was observed to be intact during the sunspot’s transit across the Western limb on July 7, 2007, implying a duration of more than 80 hr. The lifetime of LB is estimated to be 45 hr, from the moment it isolated the umbral core until the sunspot fragmentation. The area of the LBs in NOAA AR 10961 varied between 6.3 and 8.6 Mm2. While LB3 had an area of 7 Mm2 on July 3 at 3:03 UT, this increased significantly to 11 Mm2 nearly 8 hr later as the LB developed an additional arm connecting to the penumbra at its southern end. The fraction of the umbra isolated by the LBs is shown in the last row of Table 1. The area bounded by LB1 and LB2 represents 24% and 16% of the total umbral area, while LB3 divided the umbra nearly in half. By comparison, LB segregated only 6% of the umbra. Although LB3 had physical characteristics similar to LB, it did not fragment the spot.
3.6. Evolution of Horizontal Motions
In this section we describe the horizontal proper motions of intensity features, in and around the sunspot, and how they were affected by the fragmentation process. The horizontal motions were determined using local correlation tracking (LCT; November, 1986; November & Simon, 1988; Fisher & Welsch, 2008; Welsch et al., 2004), a technique which computes the relative displacement of small sub-regions centered on a particular pixel with sub-pixel accuracy using cross-correlation techniques. The sub-regions are apodized by a Gaussian window whose full-width at half-maximum is roughly the size of the structures that need to be tracked. Knowing the displacement and the time interval, the horizontal speed for each pixel can be determined. First, the aligned G-band data sets are filtered for acoustic waves using a phase velocity cut-off value of 6 km/s (Title et al., 1989). The filtered images are then subject to the tracking routine. After experimentation, an apodizing window of 1″ width and a time difference of 2 minutes between two images were chosen. To reduce the noise in the measurements, 5 velocity images were averaged. The LCT input parameters are similar to the ones used by Vargas Domínguez et al. (2010) and Verma & Denker (2011) on Hinode G-band filtergrams.

Horizontal proper motions in a sunspot are characterized by the presence of inward and outward directed flows originating from a region of divergence, or dividing line (DL; Sobotka et al., 1999; Sobotka & Stterlin, 2001), located at 0.6–0.7 penumbral radii. Since these motions change significantly in the region of fragmentation, remaining fairly uniform in the rest of the AR, we restrict our analysis of the horizontal motions in and around the fragment in the following sections.
3.7. Continuance of Horizontal Motions in Fragment
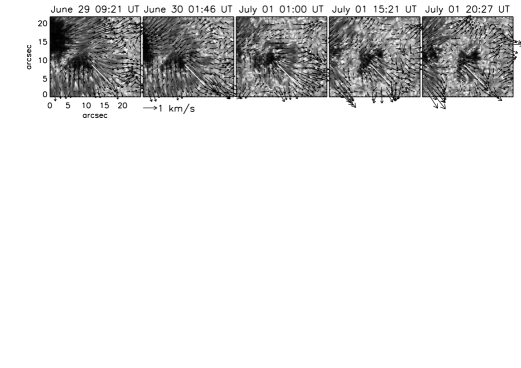
As the width of LB increases on June 30 and the separation between the sunspot and its fragment widens, the average speeds of proper motions in the intermediate granulation region are seen to be less than 100 m s-1. Radial motions are seen in the penumbra of the fragment even after separating from the parent. Figure 12 shows horizontal velocity maps at different stages of evolution of the fragment. The horizontal velocity vectors have been overlaid on the G-band images in the top panel. Below each G-band snapshot we plot the variation of the horizontal speed, as well as the radial and tangential components of the velocity along a radial cut in the penumbra (white line). The radial component is measured with respect to the cut and is negative and positive for inward and outward motions, respectively. Figure 12 illustrates the following: i) the inward and outward motions from the DL is present even after fragmentation; ii) such a radial pattern is only observed in penumbral filaments wherever present in the decaying fragment; and iii) inward motions of 100–150m s-1 are seen at the location of fragmentation which also lacks a penumbra. These inward motions are weaker than those typically seen in the inner penumbra of the sunspot.

3.7.1 Horizontal Motions during the Pore Phase
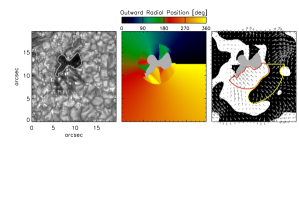
Here we compare the nature of the horizontal motions in the pore on July 2 and in the fragment comprising a penumbra a day earlier. In order to isolate regions of inward and outward motions surrounding the pore, the angle between the position vector and the velocity vector at each pixel was determined. The former is directed from the pore centroid or the pore-QS boundary outwards. The azimuth of the position vector is the angle it makes with solar West, increasing in the counter-clockwise direction. For radial distances greater than 4″, the azimuth is calculated using the pixel location and the pore’s centroid. For pixels closer to the pore, the azimuth is assigned the value of the point on the pore-QS boundary lying nearest to the pixel of interest. The above procedure is similar to the one adopted by Vargas Domínguez et al. (2010). Once the position angle is known, is calculated such that it is 180∘ and for pure radial and outward motions, respectively. Binary maps are then obtained assigning 1 for and 0 for . The middle panel of Figure 13 shows the azimuths of the position vector on June 1 at 20:39 UT, while the right panel displays the binary image depicting inward and outward motions. The red and yellow contours span the azimuth range from 220∘ to 360∘.
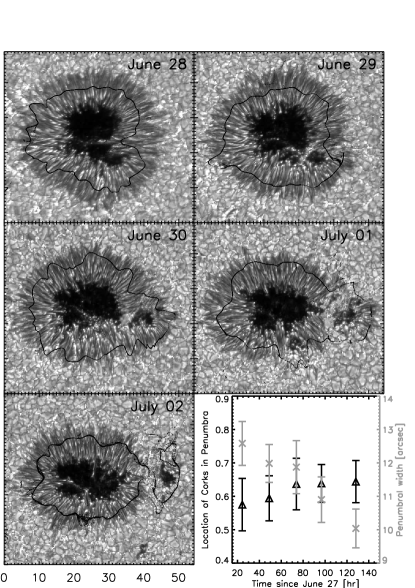
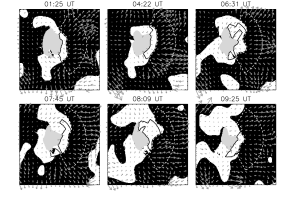
Figure 14 shows a sequence of binary maps on July 2, when the fragment was reduced to a pore. The pore has been masked in light grey and the grey arrows represent the velocity vectors. The figure clearly shows a region of inward motions surrounding the pore on the western side. The inward motions are interrupted by slower outward motions on the eastern side, possibly due to the presence of the larger parent sunspot. The black contour represents a region of inward motions having a -span in azimuth around the western edge of the pore. This is the region selected for further analysis. Since the binary maps on July 2 do not show clear differences with the ones on July 1 when the penumbra was still present, we compare the magnitude of the inward and outward motions during the pore phase with that of the previous day when the penumbra was intact.
In the pore, the mean speed of the inward motions is 0.1–0.3 km s-1, while the fragment has 0.4 km s-1 on July 1. The radial distance of the DL from the pore boundary is 16. In the case of the fragment, the DL lies further out at 3″. The DL is located at even larger radial distances in the parent sunspot that has a well formed penumbra, up to 6″ from the umbra. These results are in good agreement with the findings of Deng et al. (2007) and Vargas Domínguez et al. (2010). The differences between the horizontal motions surrounding the fragment when it is a pore and when it shows a penumbra are: i) the speed of the inward motions, which is systematically smaller by 0.25 km s-1 in the pore as revealed by the LCT maps on July 2, and ii) the location of the DL separating the inward and outward motions, which lies much closer to the pore boundary in the former.
3.7.2 Persistent Divergence Locations
In the previous section, the inward and outward motions surrounding the pore were compared with those of the fragment on the previous day. A common feature that was observed in both cases is the region of divergence separating the two types of motions, although their nature and properties are distinct from one another. In order to identify the persistent locations of divergence as the sunspot evolved we use the method of corks described below.
We start out with 25,600 artificial trace particles scattered uniformly and allowed to advect in the flow field. These corks are traced backwards in time for 24 hr. As a consequence of the long time duration, the corks appear to collect at the strongest centers of divergence which in this case lie in the outer penumbra of the sunspot. The resulting locations of divergent motion are shown in Figure 15. Furthermore, the shape of the DL gets stretched in the direction of separation as the fragmentation commences. Note that the DL remains fairly constant in the rest of the sunspot as described earlier. The regions where the DL appears discontinuous coincide with places which lack a penumbra or where photospheric granulation intervenes. This is seen particularly on July 1 near the southern region of the parent sunspot and the anchorage points of the light bridge where the fragment separated from the spot. The existence of a DL in the penumbra of the fragment even after the break up process is consistent with the observations shown in Figure 12. On July 2, the DL closed in around the parent spot, hinting at the re-establishment of the penumbra. The DL was also present in the pore on July 2, but at a smaller distance from the pore-QS boundary than in the sunspot.
The bottom right panel of the figure indicates that as the sunspot evolves, the DL has a weak tendency to move outwards. The position of the DL in terms of the normalized penumbral distance, varies from 0.580.16 to 0.640.13 from June 28 to July 2 respectively. There is also a systematic reduction in the width of the penumbra as the sunspot decays, decreasing from 12.61.3 arcsec to 10.01.2 arcsec over a course of 5 days. Those pixels that lie outside the sunspot or close to the fragment umbral core were not considered in the above calculation.
4. Discussion
We followed the evolution of a sunspot in NOAA AR 10961 for 8 days in June/July 2007 using high resolution imaging and spectropolarimetric observations from Hinode. The observations show the formation of a LB that fragmented the sunspot in two parts. The LB formed as a consequence of penumbral filament intrusion into the umbra. The fragmentation process began with the depletion of the penumbra at the anchorage points of the light bridge. Consequently, the characteristic pattern of proper motions in and around sunspots was also disrupted. The presence of the fragment inhibited its restoration. This could be due to the inability of magnetic fields to rise to the surface by buoyancy because of the intervening convective wall that extended beneath the photosphere between the parent sunspot and the fragment.
The precursors to penumbral formation are elongated granules that develop structures resembling penumbral filaments close to the edge of the sunspot boundary, as observed by Schlichenmaier et al. (2010a, b) and Lim et al. (2011). These features could be tiny -shaped magnetic loops. In addition, one finds the formation of the penumbra in the sunspot to be closely related to the magentic field inclination at the penumbra-QS boundary as seen in the post fragmentation phase.
So does the presence of a light bridge herald the fragmentation of a sunspot and what are the conditions for this to happen? The significant field strength reduction in the LB along with the presence of granulation is suggestive of strong convection which might have triggered the expulsion and fragmentation of the smaller umbral core. Katsukawa et al. (2007) point out that the process of LB formation, fragments the sunspot by injecting hot, weakly magnetized gas into the umbra. However, the LB analyzed by Katsukawa et al. (2007) remained an extension of the penumbra and did not separate individual umbral cores. Furthermore, the intensity and field strength did not evolve to QS values and the sunspot remained a single coherent structure during its transit. This does not imply however, that LBs which have matured into photospheric structures will in turn fragment the sunspot. LB3, which was seen in the sunspot after the fragmentation, had similar characteristics to LB and in this regard it ought to have split the sunspot within a time scale of 3-4 days after it had reached QS conditions, but it did not. The failure of fragmentation might be attributed to the fraction of the umbra that LBs isolate in general. This could decide if individual fragments can remain stable to convective motions. In our case, we cannot rule out the possibility that the sunspot could have fragmented soon after its passage across the Western limb. Although the presence of photospheric conditions in a light bridge is a necessary condition for fragmentation, it is not a sufficient one.
The fragmentation of sunspots, seen as a transition of their sub-structures, demonstrates a strong interplay between convection and magnetic fields extending over a large range of spatial and temporal scales. The next step would be to carry out a similar investigation on the formation of sunspots, which would be crucial to understand the organization and stability of magnetic fields at the solar surface.
References
- Bello González et al. (2012) Bello González, N., Kneer, F., Schlichenmaier, R. 2012, A&A, 538, 62
- Bhm-Vitense (1997) Bhm-Vitense, E. 1997, Introduction to Stellar Astrophysics, Vol. 2, Cambridge University Press
- Borrero & Ichimoto (2011) Borrero, J. M., Ichimoto, K. 2011, LRSP, 8, 4
- Brown et al. (2003) Brown D. S., Nightingale R. W., Alexander D., Schrijver C. J., Metcalf T. R., Shine R. A., Title A. M., Wolfson C. J. 2003, Sol. Phys., 216, 79
- Bumba (1965) Bumba V. 1965, in Stellar and Solar Magnetic Fields, R. Lst (Ed.), North-Holland Pub. Co., IAU Symp. 22, 305
- Cabrera Solana et al. (2006) Cabrera Solana, D., Bellot Rubio, L. R., Beck, C., Del Toro Iniesta, J. C. 2006, ApJ, 649, L41
- Cabrera Solana et al. (2007) Cabrera Solana, D., Bellot Rubio, L. R., Beck C., Del Toro Iniesta, J. C. 2007, A&A, 475, 1067
- Cabrera Solana et al. (2008) Cabrera Solana, D., Bellot Rubio, L. R., Borrero, J. M., Del Toro Iniesta, J. C. 2008, A&A, 477, 273
- Cheung et al. (2010) Cheung, M. C. M., Rempel, M., Title, A. M., Schssler, M. 2010, ApJ, 720, 233
- Choudhuri (1986) Choudhuri, A. R. 1986, ApJ, 302, 809
- Crouch et al. (2009) Crouch, A. D., Barnes, G., Leka, K. D. 2009, Sol. Phys., 260, 271
- Deng et al. (2007) Deng, N., Choudhury, D. P., Tritschler, A., Denker, C., Liu, C., Wang, H. 2007, ApJ,671, 1013
- Evershed (1909) Evershed, J. 1909, MNRAS, 69, 454
- Fisher & Welsch (2008) Fisher, G. H., Welsch, B. T. 2008, In: Howe, R., Komm, R. W., Balasubramaniam, K. S., Petrie, G. J. D. (eds.), Subsurface and Atmospheric Influences on Solar Activity, ASPC, 383, 373
- García de La Rosa (1987) García de La Rosa, J. I. 1987, Sol. Phys., 112, 49
- Gary & Hagyard (1990) Gary, G. A., Hagyard, M. J. 1990, Sol. Phys., 126, 21
- Gokhale & Zwaan (1972) Gokhale, M. H., Zwaan, C. 1972, Sol. Phys., 26, 52
- Hagenaar & Shine (2005) Hagenaar, H. J., Shine, R. A. 2005, ApJ, 635, 659
- Harvey & Harvey (1973) Harvey, K., Harvey, J. 1973, Sol. Phys., 28, 61
- Hirzberger et al. (2002) Hirzberger, J., Bonet, J. A., Sobotka, M., Vazquez, M., Hanslmeier, A. 2002, A&A, 383, 275
- Ichimoto et al. (2008) Ichimoto, K., et al. 2008, Sol. Phys., 249, 233
- Jurk (2011) Jurk, J. 2011, A&A, 531, 118
- Katsukawa et al. (2007) Katsukawa, Y., Yokoyama, T., Berger, T. E., Ichimoto, K., Kubo, M., Lites, B. W., et al. 2007, PASJ, 59, 577
- Keppens & Martínez Pillet (1996) Keppens, R., Martínez Pillet, V. 1996, ApJ, 316, 229
- Kosugi et al. (2007) Kosugi, T., Matsuzaki, K., Sakao, T., Shimizu, T., Sone, Y., Tachikawa, S., Hashimoto, T., Minesugi, K., Ohnishi, A., Yamada, T., Tsuneta, S., Hara, H., Ichimoto, K., Suematsu, Y., Shimojo, M., Watanabe, T., et al. 2007, Sol. Phys., 243, 3
- Kubo et al. (2008) Kubo, M., Lites, B. W., Shimizu, T., Ichimoto, K. 2008, ApJ, 686, 1447
- Kubo, Shimizu & Tsuneta (2007) Kubo, M., Shimizu, T., Tsuneta, S. 2007, ApJ, 659, 812
- Leka & Skumanich (1998) Leka, K. D., Skumanich, A. 1998, ApJ, 507, 454
- Lim et al. (2011) Lim, E. K., Yurchyshyn, V., Abramenko, V., Ahn, K., Cao, W., Goode, P. 2011,ApJ, 740, 82
- Lites et al. (2001) Lites, B. W., Elmore, D. F., Streander, K. V. 2001, in ASPC, 236, Advanced Solar Polarimetry: Theory, Observation, and Instrumentation, ed. Michael Sigwarth (San Francisco, CA: ASP), 33
- Louis et al. (2008) Louis, R. E., Bayanna, A. R.,Mathew, S. K., Venkatakrishnan, P. 2008, Sol. Phys., 252, 43
- Louis et al. (2012) Louis, R. E., Mathew, S. K., Bellot Rubio, L. R., Ichimoto, K., Ravindra, B., Bayanna, A. R. 2012, ApJ, 752, 109
- Martínez Pillet (2002) Martínez Pillet, V. 2002, Astron. Nachr., 323, 342
- Mathew et al. (2009) Mathew, S. K., Zakharov, V., Solanki, S. K. 2009, A&A, 501, L19
- McIntosh (1981) McIntosh P. S. 1981, in The Physics of Sunspots, L. Cram, J.H. Thomas (Eds.), NSO, Sunspot, N.M., 7
- Milne (1921) Milne, E. A. 1921, MNRAS, 81, 361
- November (1986) November, L. J. 1986, Appl. Opt., 25, 392
- November & Simon (1988) November, L. J., Simon, G. W. 1988, ApJ, 333, 427
- Parker (1979) Parker, E. N. 1979, ApJ, 234, 333
- Pettauer & Brandt (1997) Pettauer, T., Brandt, P. 1997, Sol. Phys., 175, 197
- Priest (1982) Priest, E. R. 1982, Solar Magnetohydrodynamics (Geophys. Astrophys. Monogr. 21; Dordrecht: Reidel)
- Ravindra (2006) Ravindra, B. 2006, Sol. Phys., 237, 297
- Rezaei et al. (2012) Rezaei, R., Bello Gonzlez, N., Schlichenmaier, R. 2012, A&A, 537, A19
- Rimmele (1997) Rimmele, T. 1997, ApJ, 490, 458
- Ringnes (1964) Ringnes, T. S. 1964, ApNr, 9, 95
- Ruiz Cobo & Del Toro Iniesta (1992) Ruiz Cobo, B., Del Toro Iniesta, J. C. 1992, ApJ, 398, 375
- Sainz Dalda & Martínez Pillet (2005) Sainz Dalda, A., Martínez Pillet, V. 2005, ApJ, 632, 1176
- Sainz Dalda & Bellot Rubio (2008) Sainz Dalda, A., Bellot Rubio, L. R. 2008, A&A, 481, L21
- Schlichenmaier et al. (2010a) Schlichenmaier, R., Rezaei, R., Bello Gonzlez, N., Waldmann, T. 2010a, A&A, 512, L1
- Schlichenmaier et al. (2010b) Schlichenmaier, R., Bello Gonzlez, N., Rezaei, R., Waldmann, T. 2010b, Astron. Nachr., 331, 563
- Sobotka et al. (1999) Sobotka, M., Brandt, P. N., G.W. Simon, G. W. 1999, A&A, 348, 621
- Sobotka & Stterlin (2001) Sobotka, M., Stterlin, P. 2001, A&A, 380, 714
- Solanki (2003) Solanki, S. K. 2003, A&A Rev., 11, 153
- Shine et al. (1994) Shine, R. A., Title, A. M., Tarbell, T. D., Smith, K., Frank, Z. A., Scharmer, G. 1994, ApJ, 430, 413
- Tan et al. (2009) Tan, C., Chen, P. F., Abramenko, V., Wang, H. 2009, ApJ, 690, 1820
- Title et al. (1989) Title, A. M., Tarbell, T. D., Topka, K. P., Ferguson, S. H., Shine, R. A. 1989, ApJ, 336, 475
- Tsuneta et al. (2008) Tsuneta, S., Ichimoto, K., Katsukawa, Y., Nagata, S., Otsubo, M., Shimizu, T., Suematsu, Y., Nakagiri, M., Noguchi, M., Tarbell, T., et al. 2008, 2008, Sol. Phys., 249, 167
- Vargas Domínguez et al. (2010) Vargas Domínguez, S., de Vicente, A., Bonet, J. A., Martínez Pillet, V. 2010, A&A, 516, 91
- Verma & Denker (2011) Verma, M., Denker, C. 2011, A&A, 529, 153
- Wallenhorst & Topka (1982) Wallenhorst, S. G., Topka, K. P. 1982, Sol. Phys., 81, 33
- Welsch et al. (2004) Welsch, B. T., Fisher, G. H., Abbett, W. P., Reginer, S. 2004, ApJ, 610, 1148
- Yan et al. (2008) Yan,X. L., Qu, Z. Q., Xu, C. L. 2008, ApJ, 682, L65