Superconductivity in the YIr2Si2 and LaIr2Si2 Polymorphs
Abstract
We report on existence of superconductivity in YIr2Si2 and LaIr2Si2 compounds in relation to crystal structure. The two compounds crystallize in two structural polymorphs, both tetragonal. The high temperature polymorph (HTP) adopts the CaBe2Ge2-structure type (space group P4/nmm) while the low temperature polymorph (LTP) is of the ThCr2Si2 type (I4/mmm). By studying polycrystals prepared by arc melting we have observed that the rapidly cooled samples retain the HTP even at room temperature (RT) and below. Annealing such samples at followed by slow cooling to RT provides the LTP. Both, the HTP and LTP were subsequently studied with respect to magnetism and superconductivity by electrical resistivity, magnetization, AC susceptibility and specific heat measurements. The HTP and LTP of both compounds respectively, behave as Pauli paramagnets. Superconductivity has been found exclusively in the HTP of both compounds below (= 2.52 K in YIr2Si2 and 1.24 K in LaIr2Si2). The relations of magnetism and superconductivity with the electronic and crystal structure are discussed with comparing experimental data with the results of first principles electronic structure calculations.
I introduction
To date large variety of ternary intermetallic systems has been discovered and many of them remain subjects of intensive scientific interest. The rare-earth intermetallics are the most intensively studied with respect to the cooperative phenomena – magnetism and superconductivity. The localized 4f electrons of the rare-earth ions exposed to various crystallographic and chemical environments in compounds cause a rich spectrum of the physical phenomena like magnetism with various magnetic structures, heavy fermion behavior or unconventional superconductivity in the quantum critical regime. The weak interactions of localized 4f electrons with valence electrons of neighboring ions, which are the key ingredients of the physics of these intermetallics, are strongly dependent on the complex interplay of chemistry and symmetry of the neighborhood. Studies of La, Lu or Y analogues allow inspecting properties independent on presence of 4f-electrons in the material.
Only in some specific cases one can investigate the effect of crystal symmetry change alone without changing composition. An outstanding opportunity is offered by polymorphism. Polymorphism is a unique phenomenon when the material can appear in two or even few different crystal structures although the chemical stoichiometry and composition are conserved. It means that the same collection of ions can be arranged to two or more crystal structures of different symmetry.
One large group of materials exhibiting often polymorphism is characterized by the composition , where represents various rare-earth ions, stays for 3d, 4d and 5d transition metals and noble metals, e.g. Ag or Au and X represents p-elements like Si , Ge, As or PChelmicki et al. (1985); Czjzek et al. (2004); Dirken et al. (1989); Ghadraoui et al. (1988); Felner and Nowik (1983, 1984, 1985); Fujii and Sato (2009); Hiebl and Rogl (1985); Jeitschko and Reehuis (1987); Jeitschko et al. (1987); Kuznietz et al. (1989); Leciejewicz et al. (1984); Quezel et al. (1984). Two polymorphs can be found in the case of 122 iridium silicides. One polymorph crystallizes in the primitive tetragonal structure of the CaBe2Ge2 type (space group P4/nmm) and the second adopts the ThCr2Si2-type body centered tetragonal structure (I4/mmm). The ThCr2Si2–type is thermodynamically stable at room temperature (LTP) while the CaBe2Ge2-type is thermodynamically stable at high temperatures (HTP). Nevertheless, the HTP can exist as a metastable form at room temperature when the cooling rate from the melt is high enough. The temperatures of the structural transitions between polymorphs are the characteristic parameters of each polymorphic compound. Existence of the polymorphism is probably not the general rule in the entire group of the Ir2Si2 compounds. For example EuIr2Si2 is reported crystallizing only in the CaBe2Ge2-type structureGhadraoui et al. (1988); Chevalier et al. (1986).
The group of 122 rare-earth-iridium silicides exhibits variety of phenomena like magnetism, superconductivity or non-Fermi liquid behavior. A short overview is presented in the following paragraph together with motivation of our work.
The Ce analogue does not order magnetically, neither the HTP nor the LTP variant presumably due to lack of Ce magnetic moments of valence fluctuating Ce ions. The LTP behaves as the Fermi-liquid at low temperatures whereas the HTP exhibits non-Fermi-liquid featuresBuffat et al. (1986); Mihalik et al. (2009a). It is in contrast to the uranium polymorphs, which order antiferromagneticaly in the LTP whereas the HTP is paramagnetic at low temperaturesChelmicki et al. (1985); Kuznietz et al. (1989); Endstra et al. (1991).
Similar situation to U compounds has been found in the Pr polymorphs. The HTP is paramagnetic down to 2 K while the LTP orders antiferromagneticaly at . Magnetism of the Pr polymorphs is determined by the crystal field (CF) acting on the Pr ionMihalik et al. (2010a, b); Welter et al. (2003); Mihalik et al. (2009b). The Nd compounds behave likewise the Pr ones. The HTP is entirely paramagnetic whereas the LTP becomes antiferromagnetic below Welter et al. (2003); Mihalik et al. (2011a). Existence of the SmIr2Si2 polymorphs has been confirmed by a structure study but information regarding magnetism is still missingChevalier et al. (1984). As already mentioned EuIr2Si2 has been reported crystallizing only in the CaBe2Ge2 type structure and exhibits intermediate valence behaviorChevalier et al. (1986, 1984). Rather incomplete information is available for the heavy rare-earth iridium silicides; for TmIr2Si2 no scientific data at all are available and for HoIr2Si2 besides confirmation of polymorphismChevalier et al. (1984) no other information has been published. The LTP of Gd, Tb, Dy and Er are reported to be antiferromagnetic below and , respectively Czjzek et al. (2004); Mihalik et al. (2011a); Chevalier et al. (1984); Hossain et al. (2006); Danzenbacher et al. (2006); Hiess et al. (2006); Tokiwa et al. (2006). Antiferromagnetism () is reported also for the HTP of TbIr2Si2Hossain et al. (2006); no other physical properties of HTP are known for the heavy rare-earth iridium silicides except for the Yb compound. YbIr2Si2 attracted much interest owing to heavy fermion behavior of the LTP, which is close to a quantum critical point (QCP)Hossain et al. (2006); Danzenbacher et al. (2006). In contrary the HTP orders magnetically at 0.7 KHossain et al. (2006); Hiess et al. (2006); Tokiwa et al. (2006). No information on physical properties of LuIr2Si2 has been published although the Lu compound was often mentioned as a non-magnetic analogue within the YbIr2Si2 study.
Superconductivity has been observed for the HTP of two Ir2Si2 compounds without the 4f electrons, namely YIr2Si2 and LaIr2Si2 . The literature reports, which are briefly reviewed in Table 1, are in some cases contradictory, especially as concerns presence of superconductivity in the LTP of YIr2Si2. In this context we would like to note that lanthanum at ambient pressure becomes a superconductor below about 6 K in both the h.c.p and f.c.c. crystal form, respectively in ambient pressureZiegler et al. (1953). In contrary yttrium metal under ambient pressure shows no superconductivity but WittigWittig (1970) has discovered superconductivity in yttrium metal at 1.2 K when applying pressure of 11 GPa.
| LaIr2Si2 | HTP (K) | LTP (K) |
| RefBraun et al. (1985) | 1.56 | - |
| RefShelton et al. (1984) | 1.52-1.58 | - |
| RefBraun et al. (1983) | 1.6 | - |
| YIr2Si2 | HTP (K) | LTP (K) |
| RefShelton et al. (1984) | 2.72-2.83 | - |
| RefHirjak et al. (1985) | 2.6 | 2.6 (broaden) |
| RefHigashi et al. (1984) | 2.7 | 2.4 |
| RefLejay et al. (1983) | 2.7 | 2.45 |
The primary objective of the present paper is to clarify how magnetism and superconductivity in YIr2Si2 and LaIr2Si2 is connected with the specific layered crystal structures of the two polymorphs (LTP and HTP). As a first step we studied existence of the LTP- and HTP-phase, respectively, with respect to thermal history by combining the DTA measurements with X-ray powder diffraction analysis of samples at room temperature. The main part of the paper is devoted to the low temperature measurements of the electrical resistivity, magnetization, AC susceptibility and specific heat in various magnetic fields. To corroborate our explanation of experimental results we have also performed ab initio electronic structure calculations for YIr2Si2 and theoretical predictions regarding the superconducting state.
II experimental and computation details
In order to avoid problems with stabilizing the HTP at low temperatures when growing the single crystals by Czochralski methodMihalik et al. (2011a) we have decided to perform the work on polycrystals which can be easier quenched after melting and single-HTP samples can be obtained. The samples of YIr2Si2 and LaIr2Si2 compounds have been prepared by melting the stoichiometric amounts of elements (purity of Y and La - 99.9%, Ir - 99.99%, Si - 99.9999%) in an arc-furnace with a water-cooled copper crucible under the high-purity (6N) argon protective atmosphere. The total sample mass was typically 2.5 g. The samples were re-melted three times to ensure good homogeneity; finally the sample has been left to cool rapidly after sudden switching off the arc above the melt. No significant evaporation has been observed during melting the samples. Each sample has been cut into two equal parts. One half of the each sample was wrapped in a tantalum foil (99.9 %), sealed in a quartz tube under the vacuum of , annealed at for 7 days and then slowly cooled to avoid internal stresses. The second half was kept without any heat treatment. Both the samples (as cast and annealed) were characterized by the X-ray powder diffraction method (XRPD) at room temperature using a Bruker D8 Advance diffractometer equipped with a monochromator providing the CuK radiation. The diffraction patterns were evaluated by the standard Rietveld techniqueRietveld (1969) using the FullProf/WinPlotr softwareRodríguez-Carvajal (1993). The composition of samples was verified by chemical analysis using a scanning electron microscope (SEM) Tescan Mira I LMH equipped by an energy dispersive X-ray detector (EDX) Bruker AXS. The samples have been shaped appropriate for individual measurements using a fine wire saw to prevent additional stresses in the samples.
Differential thermal analysis (DTA) measurements were performed using Setaram SETSYS-2400 CS instrument over the range from room temperature to . The heating and cooling rates were 5 K/min.
The low temperature behavior was tested by the electrical resistivity, heat capacity, magnetization and AC susceptibility measurements in the PPMS9T and MPMS7T facilities (Quantum Design). The samples for the electrical resistivity measurement were of the bar shape (1 mm x 1 mm x 4 mm). The electrical resistivity was measured as a function of temperature and magnetic field by using the four-terminal AC method. The heat capacity was measured on the 1.5 mm x 1.5 mm x 0.5 mm plates by the relaxation method. The magnetic measurements were performed with fine powder samples having the grains fixed in random orientation by weakly magnetic glue. The electrical resistivity was measured also with a 3He option down to the temperature of 350 mKProkleska et al. (2010).
The results of calculations of the electronic structure of LaIr2Si2 have been published beforeMihalik et al. (2009b). The ground-state electronic structure YIr2Si2 was calculated on the basis of DFT within the local spin density approximation (LSDA)Perdew and Wang (1992) and the generalized gradient (GGA) approximationWu and Cohen (2006); Perdew et al. (1996, 2008) therefore we used more possibilities than just GGAPerdew et al. (1996) in the workShein (2011). For this purpose, we used the full-potential augmented-plane-wave plus local-orbitals method (APW-lo) as implemented in the latest version (WIEN2k) of the original WIEN codeSchwarz et al. (2002). The calculations were performed within scalar relativistic mode with the following parameters. Non-overlapping atomic-sphere (AS) radii of 2.8, 2.3 and 1.6 a.u. (1 a.u. = 52.9177 pm) were taken for Y, Ir and Si, respectively. The basis for the expansion of the valence states (less than 8 Ry below the Fermi energy) consisted of more than 3500 basis functions (more than 350 APW/ atom) for the HTP-structure and more than 1350 (more than 270 APW/atom) for the LTP-structure plus the Y 3s, 3p, Ir 5s, 5p, 4f and Si 2p local orbitals. The Brillouin-zone integrations were performed with the tetrahedron method 47, on a 330 k-point mesh (HTP) and 288 (LTP) corresponding to more than 4000 k-points in the full Brillouin zone for both the crystal structures.
III results and discussion
III.1 Composition and crystal structure analysis
We have successfully synthesized the polycrystalline samples of the YIr2Si2 and LaIr2Si2 compounds and performed FE-EDX analysis at various locations of the annealed samples. The element analysis confirmed the majority of the YIr2Si2 and LaIr2Si2 phases, respectively, in all surveyed samples and 1-2 percent of the La rich and Si poor phase (La1.04Ir2Si1.58) localized mainly on grain boundaries of the La based samples.
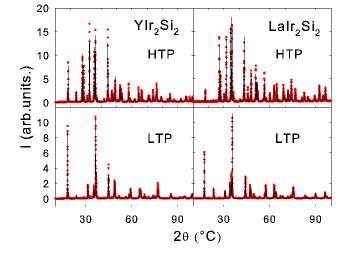
Subsequently, small pieces of the as-cast and annealed samples of both compounds, were powdered in agate mortar and XRPD data have been collected. We have observed significant difference between the patterns of the as-cast and annealed samples in the case of both compounds due to the crystal structure transformation within the thermal treatment. All reflections can be assigned to the ThCr2Si2–type structure type in the case on thermally treated samples while the as-cast samples kept the CaBa2Ge2-structure type. No significant additional reflections have been found in either sample. The powder patterns of the both compounds in the as-cast and annealed states are displayed in Figure 1.
The proper analysis of the XRPD pattern of the YIr2Si2 HTP revealed a mixture between the Si and Ir atoms in the 2c positions. The refinement process showed mixture of about 10 – 12 %. A similar situation has been observed in the case of LaIr2Si2 with the Si/Ir mixture of about 5 %. On the other hand no atoms mixture has been detected in the LTP and all atoms of the involved elements well occupied their positions in both compounds. The crystal structure parameters of the YIr2Si2 compound are digestedly summarized in the Table 2 and Table 3. The determined parameters are in good agreement with the structure model published by Shelton et al.Shelton et al. (1984).
| YIr2Si2 – HTP | 4.0938(2) | |||
| CaBa2Ge2 structure type | 9.6856(7) | |||
| Atoms | Symmetry | x | y | z |
| Ir | 2c | ¼ | ¼ | 0.127(5) |
| Si | 2c | ¼ | ¼ | 0.422(9) |
| Y | 2c | ¼ | ¼ | 0.742(8) |
| Ir | 2b | ¾ | ¼ | ½ |
| Si | 2a | ¾ | ¼ | 0 |
| YIr2Si2 – LTP | 4.0483(2) | |||
| ThCr2Si2 structure type | 9.8152(7) | |||
| Atoms | Symmetry | x | y | z |
| Si | 4e | 0 | 0 | 0.3640(9) |
| Ir | 4d | 0 | ½ | ¼ |
| Y | 2a | 0 | 0 | 0 |
Lattice parameters and fractional coordinates of the both LaIr2Si2 polymorphs are summarized in the Table 4 and Table 5.
| LaIr2Si2 – HTP | 4.1873(1) | |||
| CaBa2Ge2 structure type | 9.9380(3) | |||
| Atoms | Symmetry | x | y | z |
| Ir | 2c | ¼ | ¼ | 0.374(4) |
| Si | 2c | ¼ | ¼ | 0.140(8) |
| La | 2c | ¼ | ¼ | 0.742(8) |
| Ir | 2a | ¾ | ¼ | 0 |
| Si | 2b | ¾ | ¼ | ½ |
| LaIr2Si2 – LTP | 4.1111(1) | |||
| ThCr2Si2 structure type | 10.3001(3) | |||
| Atoms | Symmetry | x | y | z |
| Si | 4e | 0 | 0 | 0.366(1) |
| Ir | 4d | 0 | ½ | ¼ |
| La | 2a | 0 | 0 | 0 |
The difference between corresponding lattice parameters of LaIr2Si2 and YIr2Si2 compounds is about 1 % which well corresponds with the difference between the La and Y atomic radii. The c/a ratio of HTP is 1% and 3% larger than the value for the LTP of YIr2Si2 and LaIr2Si2, respectively.
The transformation temperatures between the HTP and LTP in both compounds were studied by DTA and the typical result for the YIr2Si2 compound is displayed in Figure 2. Two thermal cycles have been applied on the as cast samples, which contain entirely the HTP. Two anomalies appeared in the first heating branch of the both compounds. When heating from room temperature the first anomaly corresponds with the transformation from the HTP, which is metastable at room temperature to the thermodynamically preferable LTP. The transformation temperature has been found () for the LaIr2Si2 (YIr2Si2) compound. It is in good agreement with transition temperature for LaIr2Si2 compound reported by Mihalik et al.Mihalik et al. (2011b). The second anomaly appears when the LTP transforms to the HTP at for LaIr2Si2 (~ by Mihalik et al.Mihalik et al. (2011b)) and for YIr2Si2. Only one transition has been found on the cooling branch, which corresponds to the reverse transition from the HTP to the LTP at for the LaIr2Si2 (~ by Mihalik et al.Mihalik et al. (2011b)) and for the YIr2Si2 compound (see Figure 2).
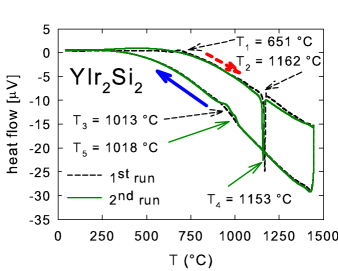
In the case of YIr2Si2 the sample after the first thermal cycle can be considered as being in the well-annealed state, i.e. containing only the LTP. Therefore the 651 anomaly is obviously missing on the heating branch of the second thermal cycle whereas the other features well correspond to these observed in the first thermal cycle.
The observed transformation temperatures are digestedly summarized in the Table 6.
| Transf. T () | YIr2Si2 | LaIr2Si2 | LaIr2Si2Mihalik et al. (2011b) |
|---|---|---|---|
| 651 | 365 | 340 | |
| 1162 | 1101 | 1140 | |
| 1013 | 800 | 860 | |
| 1153 | 1107 | not measured | |
| 1018 | - | not measured | |
| 149 | 301 | not measured |
To achieve the desirable YIr2Si2 and LaIr2Si2 samples for measurements of low temperature properties which contain entirely the LPT we annealed the as cast samples in the temperature interval (which is high enough to transform the frozen HTP to the LTP but low enough to prevent the LTP to the HTP transformation. The cooling rate used after annealing was lower than 1 K/min. Then the annealed samples have been found free of any traces of HTP.
III.2 Resistivity and heat capacity results
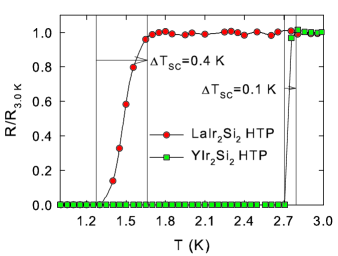
We have measured electrical resistivity data of the as-cast (HTP) and annealed (LTP) samples of both compounds and we have observed significantly different behavior. While the HTP of both compounds, respectively, exhibit robust superconductivity – see the drop of the resistivity around the superconducting transition temperature , which has been assigned to the maximum slope of the resistivity drop (Figure 3). We have found the values of for YIr2Si2 and for LaIr2Si2. Nevertheless there is a significant difference between the SC transition of the La and Y compound. While a very sharp transition from normal to superconducting state within 0.1 K has been detected for the Y compound a broader transition (0.4 K) occurs in the La compound (see Figure 3). The relatively high temperatures of the superconducting transition in HTP (higher than 1 K) are attributed to the unique arrangement of the Ir atoms in the 5 Si pyramidal cages in the HTP crystal structure. It is therefore tempting to speculate that the transition-metals coordination in these silicides is linked with and may be crucial for the occurrence of superconductivity in these compoundsBraun et al. (1983), which may happen if the material is not well annealed. No sign of superconductivity has been detected in the LTP polymorphs down to the lowest temperature of our experiment (0.4K). It is in contradiction with some previous papers where superconductivity in YIr2Si2 was reported for both the HTP and LTP samplesHirjak et al. (1985); Lejay et al. (1983). We believe that the main reason of superconductivity observed in the LTP samples reported in some earlier papers can be attributed to the presence of certain amount of the HTP in these samples.
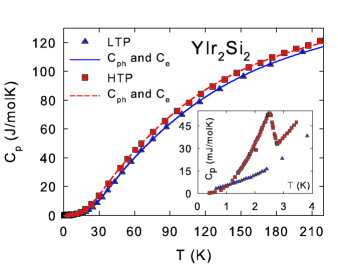
To confirm the bulk superconducting properties we have measured the heat capacity data of all four samples and have observed also here significantly different behavior of the HTP and LTP samples of corresponding compounds similar to resistivity behaviour. While the HTP of both compounds were superconducting – see the anomaly at temperatures of the superconducting transitions in the heat capacity data (Figure 4 and Figure 5) no sign of any transition has been observed in the data of the LTPs. The values determined from the heat capacity behavior are somewhat lower than these indicated by resistivity data. We have found the critical values based on heat capacity data of for the YIr2Si2 and for the LaIr2Si2 compound. The values of the both HTP of both compounds well correspond with values found for HTP in literature which are listed in the Table 1.
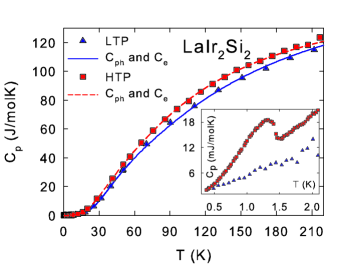
We have analyzed the heat capacity considering it as a sum of electron () and phonon () contribution:
| (1) |
where is the density of electronic states at Fermi level and is Boltzmann constant.
The phonon contribution was treated within the Debye and Einstein models using anharmonicity correctionMartin (1991). The values of the Debye and Einstein temperatures and degeneracy of the Einstein modes are listed in Table 7 and Table 8.
| YIr2Si2 | HTP | LTP | ||||
|---|---|---|---|---|---|---|
| Branch | Degen. | Degen. | ||||
| 145 | 180 | 4 | ||||
| 2 | 170 | 4 | 2 | 180 | 4 | |
| 3 | 180 | 4 | 3 | 185 | 4 | |
| 3 | 405 | 4 | 3 | 390 | 4 | |
| 4 | 410 | 4 | 4 | 395 | 4 | |
| LaIr2Si2 | HTP | LTP | ||||
|---|---|---|---|---|---|---|
| Branch | Degen. | Degen. | ||||
| 155 | 200 | 5 | ||||
| 2 | 170 | 4 | 2 | 170 | 5 | |
| 3 | 175 | 4 | 3 | 175 | 5 | |
| 3 | 390 | 4 | 3 | 470 | 5 | |
| 4 | 395 | 4 | 4 | 475 | 5 | |
Values of the Sommerfeld γ coefficient determined from the specific heat data are summarized in Table 9.
| YIr2Si2 | LaIr2Si2 | |||
| HTP | LTP | HTP | LTP | |
| 8 | 8 | 8.1 | 8.1 | |
Our experimental values of coefficient can compare as well with the coefficients presented by Braun et al.Braun et al. (1985). The value of presented by Braun et al. for HTP is in good agreement with our observed value. On the other hand our experimental value of is significantly higher than the value presented by Braun et al.Braun et al. (1985) for the LTP.
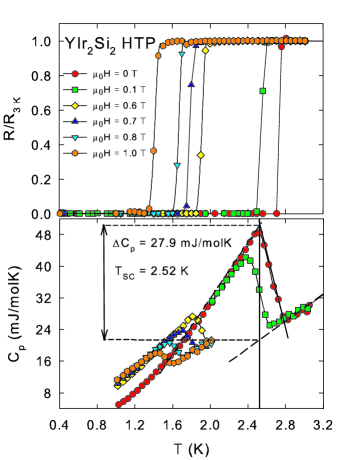
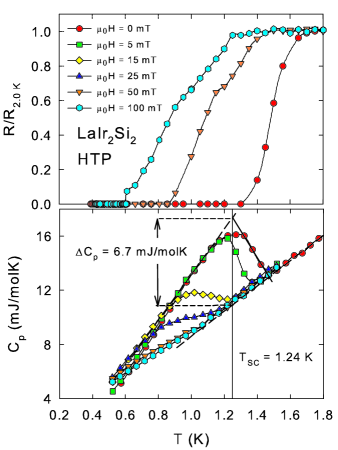
In order to analyze the superconducting properties of both compounds with respect to the predictions of BCS theory we have measured the heat capacity and electrical resistivity at low temperatures under various magnetic fields. The results are shown in Figure 6 and 7 for HTPs of YIr2Si2 and LaIr2Si2, respectively, which were found superconducting. Only curves in selected magnetic fields are displayed from the heat capacity measurements for better clarity. It is also important to note that we have always found a sharp drop of resistivity at the SC transition for all the applied magnetic fields for the YIr2Si2. The broadened transitions were observed for LaIr2Si2 both in zero magnetic field () and also under the applied magnetic field when two step like transitions developed.
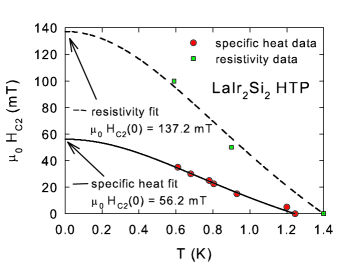
We have plotted all the values of the critical fields from all used methods and their temperature evolution for both YIr2Si2 and LaIr2Si2 in the Figure 8 and Figure 9. In the case of YIr2Si2 we have found good agreement between the temperature evolution between the resistivity and heat capacity data. Only the AC susceptibility data measured for a narrow temperature interval (2.6-2.1 K) are slightly shifted to lower fields. First we have tested to evaluate the temperature evolution of the critical field using the square law (Equation (2)) .
| (2) |
The square law was not found as a reasonable model for significant undervalue of the parameter in the case of YIr2Si2. The value of was found to be 1.27 T using square law. We have obtained more satisfying results using formula derived from Ginzburg-Landau theory Tinkham (1963); Woollam et al. (1974); Narduzzo et al. (2008) (Equation (3)).
| (3) |
This formula gives as a result of the explanation of the resistivity data and similar value for the heat capacity data. The value of the critical field for LaIr2Si2 compound have been also unsuccessfully approximated by the square law (Equation (2)) that gives the value of the critical field when applied on the heat capacity data. Also in this case Ginzburg-Landau formula (Equation (3)) gives better results and estimates the value of the critical field for the heat capacity data. Fitting of the resistivity data gives significantly a higher value of the critical field . Such behavior unambiguously denoted that the LaIr2Si2 sample was not in full bulk superconducting state as it will be also later confirmed by anomaly low value of the .
On the basis of these findings we have tried to estimate the value of the from the specific heat data using Werthamer-Helfand-Hohenberg (WHH) formula (Equation (4))Werthamer et al. (1966) within the weak-coupling BCS theory, as well.
| (4) |
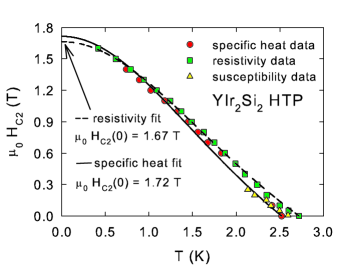
We have approximated the value of the critical field YIr2Si2 and only for LaIr2Si2. Mainly the WHH value of is in very good experimental agreement in the case of the Y compound. All the values are also digestedly compared and summarized in the Table 12.
The specific heat jump at temperature in zero magnetic field reaches the value in the case of YIr2Si2 while significantly lower and broadened jump of occurred for LaIr2Si2. We have tried to estimate the value of the , which should be 1.43 based on BSC weak-coupling theory. The value of 1.38 obtained for YIr2Si2, in good agreement with the predicted value of 1.43. Contrary to that the corresponding value for the LaIr2Si2 is significantly lower than expected - only 0.67. As we have mentioned hereinbefore we presume that the sample did not reach the superconducting state at a certain sharp temperature interval because of broadening of the superconducting transition probably due to mechanical stresses. Moreover only part of the sample was superconducting. Similar situation can occur in intermetallics as was found for example in Ref.Pospisil et al. (2011) because standard BCS behavior of the La compound was found in Ref.Braun et al. (1985) with which is 90 % of the BCS-predicted value.
III.3 First principles electronic structure calculations
The first principles calculations started minimizing the forces at the symmetry free Wyckoff positions for both HTP and LTP structures. We have found very good agreement with our experimental data. Using fixed spin moment method it has been confirmed Pauli paramagnet as the ground state of the YIr2Si2 for both the HTP and LTP.
We now compare the performance of LSDA and GGA with respect to the equilibrium volume of the HTP and LTP. The ratio c/a has been also minimized and found to be close to the experimental equilibrium (see Table 10 and 11). We have calculated the variation of the total energy with the relative volume ( is the experimental equilibrium volume). The LSDAPerdew and Wang (1992) value of the equilibrium volume is less than 1.0 % smaller than the experimental value. The GGA from Ref.Perdew et al. (1996), on the other hand, leads to a volume that exceeds the experimental by 3.8 % and the volume obtained with the GGA from Ref.Wu and Cohen (2006) is 1.3 % larger. The best results are obtained using the GGA from Ref.Perdew et al. (2008), which underestimates by only 1.1%. An all forms of the GGAWu and Cohen (2006); Perdew et al. (1996, 2008) provide a worse equilibrium volume than the LSDA. Finally we have calculated the structural difference energy using LSDA. We have found the value 9 mRy per formula unit and the LT phase is lower in energy with agreement to our experimental data.
| YIr2Si2 | reference | ||
|---|---|---|---|
| LTP | HTP | ||
| 2.4474 | 2.3791 | this work | |
| 2.4245 | 2.3659 | this work | |
| LaIr2Si2 | |||
| LTP | HTP | ||
| 2.5070 | 2.3749 | Ref.Mihalik et al. (2009b) | |
| 2.5054 | 2.3734 | this work | |
| YIr2Si2 - LTP - experimental data | calculated values | ||||||
| Atom | Symmetry | x | y | z | x | y | z |
| Si | 4e | 0 | 0 | 0.36409 | 0 | 0 | 0.37934 |
| Ir | 4d | 0 | 0.5 | 0.25 | 0 | 0.5 | 0.25 |
| Y | 2a | 0 | 0 | 0 | 0 | 0 | 0 |
| YIr2Si2 - HTP - experimental data | calculated values | ||||||
| Atom | Symmetry | x | y | z | x | y | z |
| Ir | 2c | 0.25 | 0.25 | 0.12753 | 0.25 | 0.25 | 0.12822 |
| Si | 2c | 0.25 | 0.25 | 0.42296 | 0.25 | 0.25 | 0.36808 |
| Y | 2a | 0.25 | 0.25 | 0.74891 | 0.25 | 0.25 | 0.7538 |
| Ir | 2b | 0.75 | 0.25 | 0.5 | 0.75 | 0.25 | 0.5 |
| Si | 2c | 0.75 | 0.25 | 0 | 0.75 | 0.25 | 0 |
We have checked the calculated density of the electronic states and it is in perfect agreement with the results in Ref.Shein (2011). The DOS value at the Fermi level is and which correspond to and for the HTP and LTP, respectively. The experimental specific-heat value is for the HTP, which points to an enhancement factor of , being defined by . This total enhancement is most likely due to the electron-phonon coupling.
The first superconducting temperature -relation based on the minimum set of three parameters (averaged Debye temperature , mass-enhancement coefficient and a Coulomb pseudopotential ) which found extensive applications in the analysis of superconductors was worked out by McMillanMcmillan (1968). Starting with the full Eliashberg equations, McMillan introduced ad hoc assumptions on the nature of the spectral function and assumed further that depends on spectral function only through . Performing numerical solutions of the Eliashberg equations McMillan derived so-called McMillan-formula (Equation (5)).
| (5) |
Using the averaged Debye temperature , the mass-enhancement coefficient and the Coulomb pseudopotential we have found . This only semiquantitatively agrees with our experimental value . We note that the result of using McMillan formula is especially very sensitive to particular value of mass-enhancement coefficient which is the result of combined analysis of experimental specific heat data and first-principles calculations based on the DFT with approximate exchange correlation functional. For example the value of which is quite close to our experimental value . We also point out that we used Coulomb pseudopotential which is a common practice to follow suggestion of McMillanMcmillan (1968) for all transition metals and their compounds. Therefore our calculations using McMillan formula can be taken as a starting crude estimate of only. One possible reason of limiting validity of using of McMillan formula for our YIr2Si2 might be the complex nature of the phonon spectra in YIr2Si2 compound and therefore the coupling of electrons to special phonon modes. Therefore the full first-principles calculation of the superconducting temperature of YIr2Si2 is clearly beyond the scope of the present paper.
III.4 Magnetization data
The experimental magnetic susceptibility of YIr2Si2 in the normal state is temperature independent and the value is close to for HTP and for LTP, respectively. The theoretical value of for HTP and for LTP, respectively calculated by using the well-known equation for Pauli susceptibility (Equation (6)) provides only right order with the experimental value. The overestimation of the theoretical value is probably connected with approximate exchange correlation functional used in our first principles DFT calculations.
| (6) |
| parameter | YIr2Si2 | LaIr2Si2 | YIr2Si2 | LaIr2Si2 |
|---|---|---|---|---|
| HTP | HTP | LTP | LTP | |
| 2.52 | 1.24 | No SC | No SC | |
| 2.72K | 1.45 | No SC | No SC | |
| 2.7 – 2.2 | - | No SC | No SC | |
| 0.45 | - | - | - | |
| 2.5 | - | 1.5 | 1.8 | |
| 8.4 | - | 7.3 | - | |
| 1.59 | 0.041 | - | - | |
| 1.27 | 0.042 | - | - | |
| 1.72 | 0.056 | - | - | |
| 1.67 | 0.137 | - | - | |
| 8 | 8 | 8.1 | 8.1 | |
| 5.6 | - | 4.9 | - | |
| 509 | 88.4 | - | - | |
| 455 | 89.7 | - | - | |
| 1.38 | 0.67 | - | - | |
| 145 | 155 | 180 | 200 | |
| 0.42 | - | - | - | |
| 2.3791 | 2.3749Mihalik et al. (2009b) | 2.4474 | 2.5070Mihalik et al. (2009b) | |
| 2.3659 | 2.3734 | 2.4245 | 2.5054 |
IV conclusions
We have successfully verified, that polymorphism is an effective tool to study the influence of the crystal symmetry as a deciding parameter for presence of the superconductivity on materials. As a model example we have successfully synthesized both tetragonal polymorphs of the YIr2Si2 and LaIr2Si2 compounds, respectively. We have determined the role of thermal treatment in formation of the LTP and the metastable HTP in detail. We conclude that not only the maximum temperature but also the cooling rate have been found as crucial parameters to obtain the single-phase material which can explain the controversial reports on the existence of the superconductivity in 122 iridium silicides presented in previous works. We have confirmed that only the HTP is superconducting; and for YIr2Si2 and LaIr2Si2, respectively. The LTP of both, YIr2Si2 and LaIr2Si2 , behave as the normal metallic conductors (no sign of superconductivity). The presence of the superconductivity in Y and La iridium silicides is connected with unique inverse stacking of Ir-Si layers in the HTP structure creating pyramidal Ir cages with La or Y atoms inside, which are not present in LTP polymorphs.
To well understand more physics of the 122 iridium silicides we have determined all the structure parameters, electronic structure and we have also inspected the superconducting state of both superconducting compounds within the BCS theory predictions.
The lattice parameters and atoms fractional coordinates were found to be in good agreement with previously published structure models Shelton et al. (1984); Braun et al. (1983) and also in agreement with our theoretical DFT values obtained using GGA. The LT polymorphs have been also confirmed being thermodynamically favorable at room temperature. The low values of the coefficient for the YIr2Si2 and for the LaIr2Si2 of the HT polymorph denotes the low density of states at Fermi level, which was confirmed by theoretical calculations. We have also revealed a low mass enhancement () for the YIr2Si2, which indicates a weak electron-phonon interaction. According to the straightforward use of McMillan formula the theoretical value of the superconducting temperature is which is not so bad results in comparison to other Y intermetallics. Therefore we tentatively propose that the observed superconductivity might for example result from the coupling of electrons to special phonon modes in the Y and La iridium silicides complex phonon spectra. All physical parameters and found constants for the YIr2Si2 and LaIr2Si2 are digestedly summarized in the table 12.
Acknowledgements.
The work is a part of activities of the Charles University Research Center "Physics of Condensed Matter and Functional Materials. It was also supported by the Czech Science Foundation (Project # 202/09/1027) and the Charles University Grant Agency Project # 719612.References
- Chelmicki et al. (1985) L. Chelmicki, J. Leciejewicz, and A. Zygmunt, Journal of Physics and Chemistry of Solids 46, 529 (1985).
- Czjzek et al. (2004) G. Czjzek, V. Oestreich, H. Schmidt, K. Laka, and K. Tomala, Journal of Magnetism and Magnetic Materials 79, 42 (2004).
- Dirken et al. (1989) M. W. Dirken, R. C. Thiel, and K. H. J. Buschow, Journal of The Less-Common Metals 147, 97 (1989).
- Ghadraoui et al. (1988) E. H. E. Ghadraoui, J. Y. Pivan, R. Guqrin, O. Pena, J. Padiou, and M. Sergent, Materials Research Bulletin 23, 1345 (1988).
- Felner and Nowik (1983) I. Felner and I. Nowik, Solid State Communications 47, 831 (1983).
- Felner and Nowik (1984) I. Felner and I. Nowik, Journal of Physics and Chemistry of Solids 45, 419 (1984).
- Felner and Nowik (1985) I. Felner and I. Nowik, Journal of Physics and Chemistry of Solids 46, 681 (1985).
- Fujii and Sato (2009) H. Fujii and A. Sato, Journal of Alloys and Compounds 487, 198 (2009).
- Hiebl and Rogl (1985) K. Hiebl and P. Rogl, Journal of Magnetism and Magnetic Materials 50, 39 (1985).
- Jeitschko and Reehuis (1987) W. Jeitschko and M. Reehuis, Journal of Physics and Chemistry of Solids 48, 667 (1987).
- Jeitschko et al. (1987) W. Jeitschko, R. Glaum, and L. Boonk, Journal of Solid State Chemistry 69, 93 (1987).
- Kuznietz et al. (1989) M. Kuznietz, H. Pinto, H. Ettedgui, and M. Melamud, Phys Rev B 40, 7328 (1989).
- Leciejewicz et al. (1984) J. Leciejewicz, ceiling left, M. Slaski, and A. Zygmunt, Solid State Communications 52, 475 (1984).
- Quezel et al. (1984) S. Quezel, J. Rossatmignod, B. Chevalier, P. Lejay, and J. Etourneau, Solid State Communications 49, 685 (1984).
- Chevalier et al. (1986) B. Chevalier, J. M. D. Coey, B. Lloret, and J. Etourneau, Journal of Physics C-Solid State Physics 19, 4521 (1986).
- Buffat et al. (1986) B. Buffat, B. Chevalier, M. H. Tuilier, B. Lloret, and J. Etourneau, Solid State Communications 59, 17 (1986).
- Mihalik et al. (2009a) M. Mihalik, M. Divis, and V. Sechovsky, Physica B: Condensed Matter 404, 3191 (2009a).
- Endstra et al. (1991) T. Endstra, G. J. Nieuwenhuys, A. A. Menovsky, and J. A. Mydosh, Journal of Applied Physics 69, 4816 (1991).
- Mihalik et al. (2010a) M. Mihalik, M. Divis, and V. Sechovsky, Journal of Magnetism and Magnetic Materials 322, 1153 (2010a).
- Mihalik et al. (2010b) M. Mihalik, M. Divis, V. Sechovsky, N. Kozlova, J. Freudenberger, N. Stüser, and A. Hoser, Phys Rev B 81 (2010b).
- Welter et al. (2003) R. Welter, K. Halich, and B. Malaman, Journal of Alloys and Compounds 353, 48 (2003).
- Mihalik et al. (2009b) M. Mihalik, Z. Matej, M. Divis, and V. Sechovsky, Intermetallics 17, 927 (2009b).
- Mihalik et al. (2011a) M. Mihalik, J. Pospisil, A. Hoser, and V. Sechovsky, Phys Rev B 83 (2011a).
- Chevalier et al. (1984) B. Chevalier, P. Lejay, B. Lloret, W. X. Zhong, J. Etourneau, and P. Hagenmuller, Annales de Chimie-Science des Materiaux 9, 987 (1984).
- Hossain et al. (2006) Z. Hossain, C. Geibel, T. Radu, Y. Tokiwa, F. Weickert, C. Krellner, H. Jeevan, P. Gegenwart, and F. Steglich, Physica B-Condensed Matter 378-80, 74 (2006).
- Danzenbacher et al. (2006) S. Danzenbacher, Y. Kucherenko, C. Laubschat, D. V. Vyalikh, Z. Hossain, C. Geibel, X. J. Zhou, W. L. Yang, N. Mannella, Z. Hussain, Z. X. Shen, and S. L. Molodtsov, Phys Rev Lett 96 (2006).
- Hiess et al. (2006) A. Hiess, O. Stockert, M. M. Koza, Z. Hossain, and C. Geibel, Physica B: Condensed Matter 378-380, 748 (2006).
- Tokiwa et al. (2006) Y. Tokiwa, P. Gegenwart, Z. Hossain, J. Ferstl, G. Sparn, C. Geibel, and F. Steglich, Physica B-Condensed Matter 378-80, 746 (2006).
- Ziegler et al. (1953) W. T. Ziegler, R. A. Young, and A. L. Floyd, J. Am. Chem. Soc. 75, 1215 (1953).
- Wittig (1970) J. Wittig, Phys Rev Lett 24, 812 (1970).
- Braun et al. (1985) H. F. Braun, T. Jarlborg, and A. Junod, Physica B+C 135, 397 (1985).
- Shelton et al. (1984) R. N. Shelton, H. F. Braun, and E. Musick, Solid State Communications 52, 797 (1984).
- Braun et al. (1983) H. F. Braun, N. Engel, and E. Parthé, Phys Rev B 28, 1389 (1983).
- Hirjak et al. (1985) M. Hirjak, P. Lejay, B. Chevalier, J. Etourneau, and P. Hagenmuller, Journal of the Less Common Metals 105, 139 (1985).
- Higashi et al. (1984) I. Higashi, P. Lejay, B. Chevalier, J. Étourneau, and P. Hagenmuller, Revue de Chimie Minerale 21, 239 (1984).
- Lejay et al. (1983) P. Lejay, I. Higashi, B. Chevalier, M. Hirjak, J. Etourneau, and P. Hagenmuller, Comptes Rendus de l Academie des Sciences Serie Ii 296, 1583 (1983).
- Rietveld (1969) H. M. Rietveld, Journal of Applied Crystallography 2, 65 (1969).
- Rodríguez-Carvajal (1993) J. Rodríguez-Carvajal, Physica B 192, 55 (1993).
- Prokleska et al. (2010) J. Prokleska, J. Pospisil, J. V. Poltierova, V. Sechovsky, and J. Sebek, Journal of Physics: Conference Series 200, 012161 (2010).
- Perdew and Wang (1992) J. P. Perdew and Y. Wang, Phys Rev B 45, 13244 (1992).
- Wu and Cohen (2006) Z. G. Wu and R. E. Cohen, Phys Rev B 73, 235116 (2006).
- Perdew et al. (1996) J. P. Perdew, K. Burke, and M. Ernzerhof, Phys Rev Lett 77, 3865 (1996).
- Perdew et al. (2008) J. P. Perdew, A. Ruzsinszky, G. I. Csonka, O. A. Vydrov, G. E. Scuseria, L. A. Constantin, X. Zhou, and K. Burke, Phys Rev Lett 100, 136406 (2008).
- Shein (2011) I. R. Shein, Physica B: Condensed Matter 406, 3525 (2011).
- Schwarz et al. (2002) K. Schwarz, P. Blaha, and G. K. H. Madsen, Computer Physics Communications 147, 71 (2002).
- Mihalik et al. (2011b) M. Mihalik, J. Pospisil, A. Rudajevova, X. Marti, D. Wallacher, A. Hoser, T. Hofmann, M. Divis, and V. Sechovsky, Intermetallics 19, 1622 (2011b).
- Martin (1991) C. A. Martin, J Phys-Condens Mat 3, 5967 (1991).
- Tinkham (1963) M. Tinkham, Phys. Rev. 129, 2413 (1963).
- Woollam et al. (1974) J. A. Woollam, R. B. Somoano, and P. O’Connor, Phys Rev Lett 32, 712 (1974).
- Narduzzo et al. (2008) A. Narduzzo, M. S. Grbic, M. Pozek, A. Dulcic, D. Paar, A. Kondrat, C. Hess, I. Hellmann, R. Klingeler, J. Werner, A. Kohler, G. Behr, and B. Buchner, Phys Rev B 78, 012507 (2008).
- Werthamer et al. (1966) N. R. Werthamer, E. Helfand, and P. C. Hohenberg, Phys. Rev. 147, 295 (1966).
- Pospisil et al. (2011) J. Pospisil, M. Kratochvilova, M. Divis, J. Prokleska, J. V. Poltierova, and S. V., Journal of Alloys and Compounds 509, 1401 (2011).
- Mcmillan (1968) W. L. Mcmillan, Phys. Rev. 167, 331 (1968).