Publication Induced Research Analysis (PIRA) - Experiments on Real Data
Abstract
This paper describes the first results obtained by implementing
a novel approach to rank vertices in a heterogeneous graph,
based on the PageRank family of algorithms and applied here
to the bipartite graph of papers and authors as a first evaluation
of its relevance on real data samples.
With this approach to evaluate research activities,
the ranking of a paper/author depends
on that of the papers/authors citing it/him or her.
We compare the results against existing ranking methods (including
methods which simply apply PageRank to the graph of papers or the graph
of authors) through the analysis of simple scenarios based on a real
dataset built from DBLP and CiteseerX.
The results show that in all examined cases the obtained result is most
pertinent with our method which allows to orient our future work to
optimizing the execution of this algorithm.
category:
G.2.2 Discrete Mathematics Graph Theorykeywords:
Graph algorithmscategory:
F.2.2 Analysis of algorithms and problem complexity Nonnumerical Algorithms and Problemskeywords:
Sorting and searchingcategory:
H.3.3 Information storage and retrieval Information Search and Retrievalkeywords:
relevance feedback, search processkeywords:
publication, citation, ranking, graph, dataset.1 Introduction
This paper explores the implementation of existing work on a parameterized random journey of a bipartite paper-author graph, which was defined in [8]. We recall that the exploration of a partial graph derived from this global one was considered in past research in many papers (for instance, the author graph in e.g. [12, 17, 9, 13, 5, 4], or the paper graph [3, 11, 7], or a partial joint graph in [10, 16, 14, 15]).
The main focus here is to revisit the analysis of different approaches in a more systematical way than that considered in [8] and connect those results to the real situations that were observed in the dataset that we built specifically for this study.
Building a large coherent dataset for that purpose was not straightforward: the main difficulty was to obtain the information on the reference (or citation) list of a paper, even if there are many public information such as Google Scholar, because of the legal issue related to web site crawling.
In Section 2, we recall briefly the algorithm that is studied and will be compared to other metohds. In Section 3, we describe how the dataset was built for this evaluation. Finally, Section 4 illustrates and compares different approaches by outlining major tendencies but also by pointing out several specific cases where the ranking differs between our algorithm and another method.
2 Model
In this paper, we revisit the ranking algorithm proposed in [8]: as in [8], we give here a description of the algorithm based on the random walk point of view for a better intuition and clarity. We recall that the algorithm definition and the way the algorithm is solved are two different problems. In this paper, the random walk approach is used to obtain the score of each node (paper or author): as for the classical PageRank problem, we could have used any other approach such as a power iteration, but such a consideration is out of the scope of this paper and will be studied in a subsequent paper.
2.1 PIRA algorithm
The main ideas of [8] is to use the PageRank extension in the bipartite graph of author and paper nodes where the notion of what we call here p-weight and c-weight has been implicitly used.
2.1.1 Probability weight
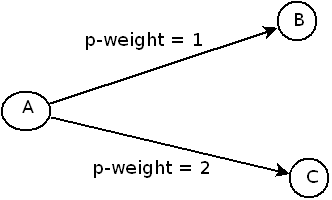
Probability weight (p-weight) is a property associated to an edge for deciding the probability that this edge is chosen when the surfer arrives at its origin node. For example, in Figure 1, when the surfer arrives at the node A, he has a probability to go to C, and to go to B. The value of the property p-weight is therefore relative, i.e. it is only useful when placed with other edges: if a vertex has only one outgoing edge, then the probability of choosing this edge when a visitor arrives at is always (conditional to the damping probability).
In the author paper graph, this p-weight of an edge from an author to a paper may be represented as proportional to the time he spent to write : if is written by three authors, then this value is . More generally:
where is an edge linking an author to one of his paper , and nbAuthors() is the number of co-authors of .
2.1.2 Counter weight
In the original PageRank, when arriving at a vertex , we increment the counter by one. A property that we call counter weight (c-weight) can be associated to an edge which decides the quantity of increment when the surfer arrives at its end using this edge:
where is an edge pointing to .
The c-weight of an edge from a vertex to a vertex represents the weight that gives to . For instance, if we want that a paper does not receive any score from its author (which can be considered as a self-evaluation), the c-weight of an edge linking an author to a paper may be set to 0:
where is an edge linking an author to one of his papers.
Because the counter weight effect is not propagated through the links, this can be seen as a reweighted score of the eigenvector (limit) obtained in the case where all c-weights are equal to one.
2.2 Pseudo code
The pseudo code below follows closely the flow execution of the algorithm proposed in [8] as PR-G.
The restarting_weight is added to where is the vertex
from which the visitor starts/restarts the random walk. The cite_weight,
wrote_weight, isWrittenBy_weight are the c-weights associated to the
cite, wrote and isWrittenBy edges respectively.
The methods a2p, p2p and p2a stand for the jump from author to paper,
paper to paper and paper to author respectively.
In a2p, the visitor picks a paper by taking into account the p-weight defined in
Section 2.1.1.
df stands for the damping factor ( is the probability that the reinitialization
is triggered), and theta is the probability that the surfer
follows a citation link when he arrives at a paper (otherwise an isWrittenBy link is chosen).
init_all()
choose a type: author or paper
if (author) choose randomly an author a
a2p(a , restarting_weight)
else choose randomly a paper p
p2p(p, restarting_weight)
a2p(author, weight)
add weight to author
if (df) init_all()¯¯
else pick a paper p of a
if (p exists) p2p(p, wrote_weight)
else init_all()
p2p(paper, weight)
add weight to paper
if (df) init_all()¯¯
else pick a cited paper p’
if (p’ exists)
if (theta) p2p(p’, cite_weight)
else p2a(p, cite_weight)
else init_all()
p2a(paper, weight)
add weight to paper
if (df) init_all()
else pick randomly an author a of p
if (a exists)
a2p(a, isWrittenBy_weight)
else init_all()
main()
init_all()
3 Dataset
3.1 Construction phase
In order to validate/evaluate our approach, we built a dataset of the author-paper graph from DBLP [2] and CiteSeerX [1, 6] as follow:
-
•
[Starting point] we parsed an XML file of DBLP containing 980680 papers and 679282 authors to create an initial author and paper sets (at this point the graph contains only wrote edges);
-
•
[Crawling links] from the 980680 papers of DBLP, we crawled the CiteSeerX website to get information on the citation list of each paper (cited by): from this we got only about 7% successful answers (the rest is not found) amounting to 67772 papers;
-
•
[References outside DBLP] the dataset has been completed with papers (and authors) that cite the 67772 papers.
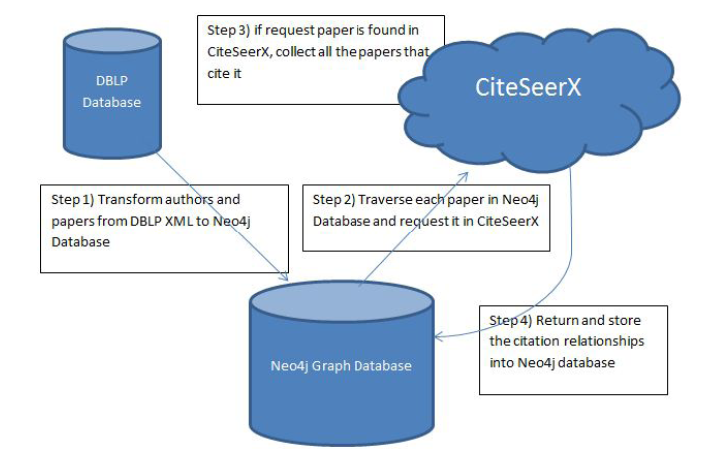
The result of the above process is a dataset of 246039 authors (73241 from DBLP) and 281207 papers (67772 from DBLP). In the following, while running the ranking algorithm on the nodes, the ranking results are only shown for those in DBLP because the authors and papers outside DBLP have no incoming citation links. We could have iteratively crawled to get the citation list of the papers outside DBLP, but this would have required an exponentially increasing data collection time and we estimated that the amount of data already collected was sufficient to illustrate several real-life scenarios.
3.2 Dataset statistics
This subsection provides some statistics on the dataset that was constructed as described above.
The average number of publications for authors from DBLP is 6.95 whereas it is only 1.7 for authors outside of DBLP.

Figure 3 shows a logscaled comparison of the repartition of the number of publications per author for authors inside and outside of DBLP. Note that the first 9 authors outside DBLP with over hundreds of publications are actually parsing errors from the CiteSeerX dataset (such as: et al., Ph D, Student Member, etc.). Because we do not rank those authors we preferred at first to leave them since they represent a known lack of information in our dataset (which we may decide to correct at a later time).
The average number of co-authors per paper is similar for both DBLP and non DBLP papers (2.85).

Figure 4 shows a logscaled comparison of the repartition of the number of co-authors per paper inside and outside of DBLP. Note that the paper from DBLP with 102 authors is in fact some kind of compilation of many scientists’ work.
The total number of citation links in our dataset is 631113, of which 121688 are citations between papers both in DBLP (the rest being citations from outside DBLP to a paper in DBLP: by construction we cannot have a citation towards a paper outside DBLP).

Figure 5 shows the number of outgoing citations from papers inside and outside DBLP (with no surprise the non-DBLP line stays above the DBLP one); we also included in the figure the incoming citations line (which makes sense only for DBLP papers by construction).
3.3 Data validation
The process of building a clean dataset is in fact not obvious: in particular, we encountered the very well known problem of the author name disambiguation. This problem may be partially solved by assuming that an author is likely to cite his own papers and based on the co-authorship information: for instance, if a paper A of an author J. YYY cites a paper B of John YYY, we may assume that the author of paper A is John YYY. Also, when J. YYY and John YYY have a common co-author, we may also assume that J. YYY is John YYY for the co-authored papers. Unfortunately for other papers which did not meet one of the above conditions we cannot assume that J. YYY is John YYY, therefore our dataset still contained many ambiguous authors (with initials) which we preferred to leave as it is in order not to introduce false authorships (i.e. when in doubt we preferred to have duplicate authors rather than merging two actual distinct authors into one).
As pointed out, such disambiguation methods are far from being enough, but such a consideration is out of the scope of this paper.
4 Evaluation
4.1 Notation
In order to compare the proposed solution to existing measures, several theoretical scenarios are considered. Those scenarios are also found in our database, which shows that those scenarios are not only fictive ones. The following notation will be used:
-
•
Pub. of an author: the number of publications of the author;
-
•
Cit. of an author: the number of times his papers have been referenced;
-
•
Hind of an author: the H-index;
-
•
PR-A of an author: the PageRank score of this author on the author graph;
-
•
PR-P of an author: the PageRank score of this author resulting from the paper graph (i.e. each author receives the fraction of the PageRank score of his/her papers corresponding to an even distribution among each paper’s authors);
-
•
PIRA of an author: the score of this author in the PR-G algorithm.
Note that there are in fact many possible ways to implement the PageRank variants on the author graph. In this paper, we considered the one derived from PIRA when constraining the random walk on the paper graph following the citation link exactly one time.
4.2 Preliminary analysis
In this section we will comment some general impact of the ranking differences due to the limited dataset information, which may be seen as a boundary impact.
4.2.1 The weight of external papers
In our dataset, about 70-75% papers/authors are external (i.e. outside dblp), therefore their impact on the ranking score is dominant. This may result in limited differences when considering variants of ranking algorithm, in particular because the random walk path is not deep enough.
4.2.2 Missing data on the referenced papers list
Because we had only a subset of the scientific literature and also because of the way we constructed our dataset, the average number of references to another paper in our dataset is only slightly over 2 (see also Figure 5), whereas the actual number of references per paper is usually in the 10-30 range (only 4188 papers in our dataset have more than 10 references to other papers in our database, they represent less than two percent of the total number of papers).
We suspected that having only a single or two outgoing citation links was going to introduce bias in some cases and this is why we implemented a minimum_citation_count variable to simulate a minimum number of outgoing references and therefore dilute the chances to pick a specific paper (the only one available) when following the citation link (when a "fake" paper is chosen, we restart the random walk from any paper in the dataset).
We have run our PIRA algorithm with the variable minimum_citation_count set to 0 and then to 10 and compared the results. As we suspected, about 20 percent of papers ranked in the top one percent with the variable set to zero were ranked out of the top one percent when this variable is introduced and set to 10.
We then investigated a few examples of papers which were ranked significantly lower when setting the variable minimum_citation_count to 10.
For example author 15510 (Gilles Brassard) was ranked 159 without minimum_citation_count and went down to rank 960 when imposing a minimum of 10 references per paper.
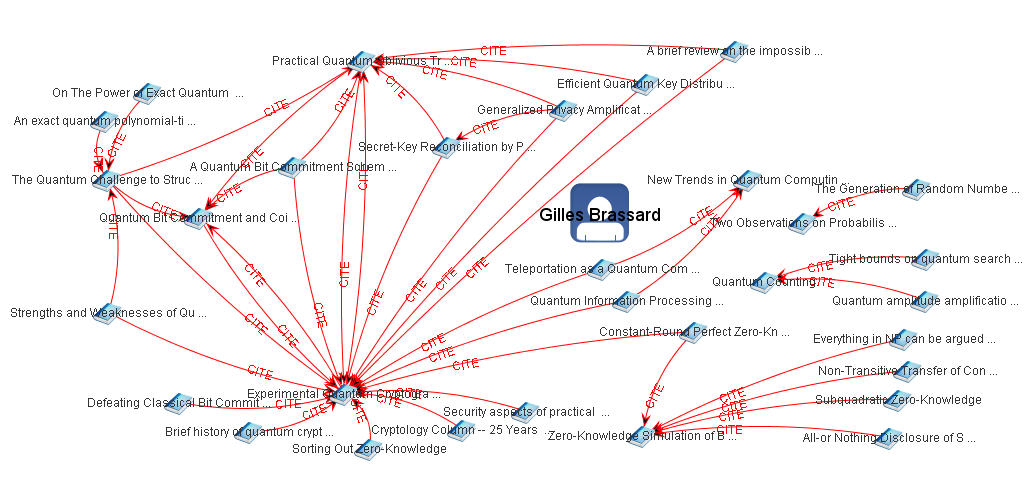
Figure 6 shows all the papers written by Gilles and their citation links among themselves. Two things stand out in the figure: Gilles wrote a decent amount of papers (his publication score is 41) and most of his papers cite a previous paper of his (only nine papers did not cite other papers - they are not displayed in this figure). When not imposing a minimum amount of references it is obvious that each time we end up on one of his paper and choose to follow the citation link we will have no choice but to jump to another one of his paper, thereby mechanically increasing its PIRA score. But this is not quite enough to explain the drastic difference in ranking: a closer inspection into which papers most influenced Gilles’ score shows that one paper 15508 (The quantum challenge to Structural Complexity) had the most influence on his PIRA score and paper 15508 itself inherited most of its score from paper 86162 (Quantum complexity theory - which cites only two papers, the other being also written by Gilles) which in turn inherits it from paper 86399 (A fast quantum Mechanical Algorithm for Database Search - which cites only 86162), the latter two papers having a PIRA ranking of respectively 42 and 41. This chain of citations is heavily diluted when introducing a minimum_citation_count of 10 (because two citation jumps will decrease the probability by two orders of magnitude) and this explains most of the ranking difference.
Another example which corroborates the fact that an indirect citation chain is the major factor for the down-ranking caused by minimum_citation_count is author 30803 (Takuo Watanabe, whose rank goes from 177th down to 2030th) which has a much more modest publication score of 11 and which also inherits most of its score from a single paper 30802 (Hybrid Group Reflective Architecture for OO Concurrent Reflective Programming) which is cited by two well ranked papers:
-
•
52911 (Aspect-Oriented programming) with a PIRA rank of 28, and which only cites 3 papers from our dataset;
-
•
30772 (An Overview of AspectJ) with a PIRA rank of 32 and which also cites only 3 papers.
Note that when comparing PIRA with PR-P (cf. section 4.4.2), we have set minimum_citation_count to 0 because we did not have the equivalent parameter on the existing PageRank implementation that we used.
4.3 Global comparison
In this section, we address a global comparison of ranking methods. Figure 7 shows the difference in percentage of the X best ranked authors w.r.t. the number of publications. The ranking by the number of publications is probably the measure which differs the most to all others: it is likely to be directly proportional to the quantity of effort spent by an author. We can observe that the differences are more visible with PR-A, Cit and PIRA which are intuitively the most qualitative ones. We see that PR-P is the closest (below top 15%): this can be explained by the fact that with PR-P each published paper has a minimum score, therefore the score of an author is above a linear function (before normalization) w.r.t. the number of publications.

Figure 8 shows the same comparison but this time w.r.t. the number of citations: we can see that PR-A is the closest to citations based ranking: the explanation is that PR-A explores the paper citation links only once between authors who cite without the score inheritance between authors distant by more than one citation relationships: as a consequence, the ranking is close to the local counter of the number of citations.

The fact that in both cases (Figure 7 and Figure 8) the best ranked authors are less differentiated between different approaches is mostly due to the graph property (Zipf/power law type links distribution, cf. Figure 5) of the dataset: there are authors who will be in the top 1%, 2% etc whatever the measure (authors having a lot of publications and citations). Note also that by definition, the difference on the top 100% is always equal to 0.
4.4 Specific cases comparisons
4.4.1 Citations count vs PIRA ranking
In order to evaluate the ranking differences among authors between citations count and PIRA,
we constructed a file containing the first thousand DBLP authors ranked with citations count
and compared their rank in PIRA. See Figure 9 where the x-axis
is the citations count ranking and the y-axis is for each author the difference between its
citations rank and its PIRA rank.
What we did was then to identify points which would stray far from the mass and investigate the rank difference.
We started by identifying author 70411 which had a citation rank of 167 and
a PIRA rank of 1613.
A short investigation showed that most of its rank was inherited from paper
83130 which has 570 citations in our dataset. Interestingly enough this paper was
co-authored by eight authors which are all outlined in Figure 9
because of their ranking differences between citations count and PIRA,
which can easily be explained by the fact that in PIRA the weight of this paper will be
divided evenly between the eight authors whereas citations count will freely distribute
all this paper’s weight to all its authors (in fact it can be noted that some of these authors
received citations only for this paper, and still ranked 316th and 317th with citations count!).

Another point that stood out was author 11409 which is ranked 390 positions higher with PIRA than with citations count, this is caused by the fact that his main paper 74463 (of which he is the unique author, which helps rank him higher in PIRA compared to multiple authors of a paper with the same citation rank) was cited by a number of papers that were themselves quite cited (100+ times each), among which is 74457 written by author 34024 who is also well-ranked (both PIRA and citation) and which cites only two papers.
This illustrates clearly the impact of the recursive score inheritance of the PageRank approach which does not exist with local counters such as citations count, which brings us to the comparison of PIRA with PageRank applied on the papers graph (PR-P).
4.4.2 PR-P vs PIRA ranking
As in the previous section we have plotted the first thousand ranked papers with PR-P against the rank difference with PIRA (see Figure 10). This helps to quickly identify papers whose rank is greatly modified by the algorithm change. A first remark on Figure 10 is that most anomalies correspond to a case where the rank with PIRA is significantly worse than with PR-P.

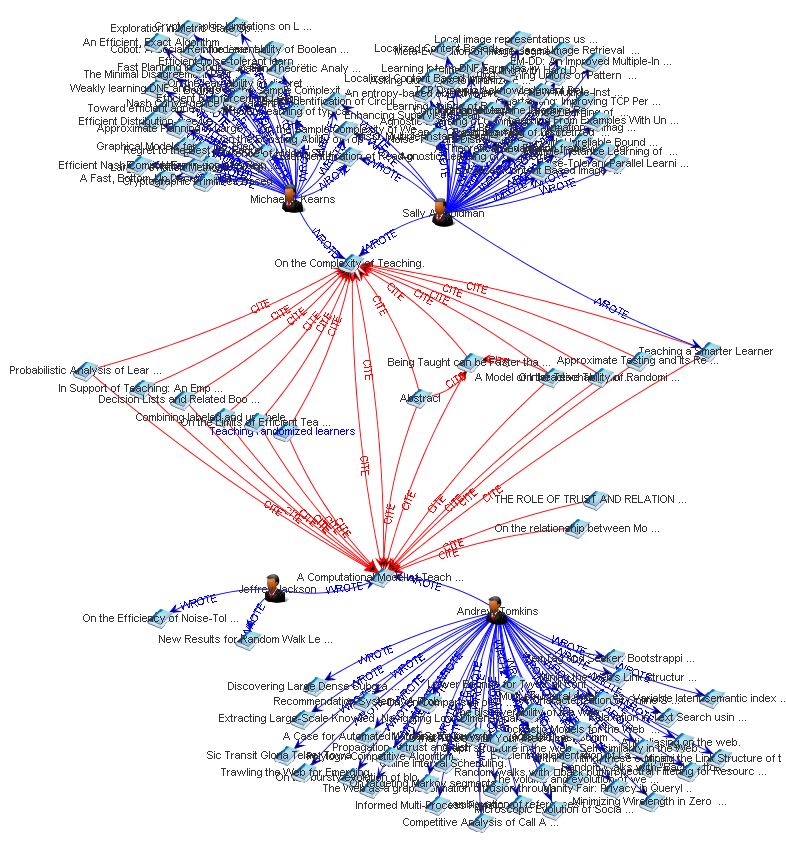
When picking a paper among the anomalies and using our specifically built graphical tool (see Figure 11) to investigate the reasons behind the ranking difference, we have always found that at least one other paper was involved in the ranking difference and this is why we grouped papers by pairs (cases A, B, C and D) in Figure 10.
All the papers which strayed from the mass in Figure 10 have the particularity that
they cite a paper which cites themselves back. Although counter-intuitive (a paper should only be
able to cite papers from the past), we have found many examples of this, confirmed
by manually visiting CiteSeerX’s website, usually because a revised paper X will have
cited a paper Y which cited an earlier version of X.
Because most cases found in the anomalies are similar (citation loop between two papers), we will
explain the difference using case A.
As can be seen in Figure 11, the structure consists of two papers citing each other (and citing no other papers):
17176 (A Computational Model of Teaching) and 17149 (On the Complexity of Teaching,
of which a preliminary version appeared in the Proceedings of 4th Annual Workshop of Computational
Learning Theory) and which are both cited by a relatively small (14) number of papers.
What happens intuitively with PageRank on the graph of papers is that once the random surfer arrives on one of these 16
papers (the aforementioned fourteen plus our two PR-P inflated ones) it will then be trapped and jump only between paper
17176 and 17149 (until the damping factor takes effect), thereby artificially incrementing those two papers’ scores.
What happens when we introduce the random walk on the bipartite graph (authors+papers) is that we move from a paper to to an author with probabilty (usually 0.3 in our executions) and once on an author the next jump will be uniformally chosen among its publications, and Figure 11 clearly shows that 3 of the 4 authors have 30+ publications each, thereby removing the trap that existed with PR-P.
4.5 Generic comparison
4.5.1 Paper quality
The number of publications measure does not take into account the paper quality (the notion of quality is approximate, since we first need to define a pertinent ranking for papers, then a quality paper will be a highly ranked one. For now, a paper is considered of quality if it is cited by an important number of papers): an author who has written a referential paper is less ranked than another who wrote two unknown papers (this can happen with old time, classic authors who published in general less than the actual ones. This could be due to the lack of information we have about ancient journals or conferences).
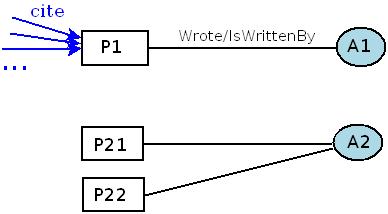
In our database, we have found (see Table 1) two authors who illustrate the above scenario: one publishes a lot but receives nearly zero citation while the other wrote only one high quality paper.
| ID | Name | Pub | Cit | PRA | PIRA |
|---|---|---|---|---|---|
| 20 | Dorothy E. | 1 | 313 | 63.748 | 59.942 |
| Denning | |||||
| 40152 | Pedro | 21 | 1 | 0.077 | 0.331 |
| Cabalar |
4.5.2 Number of co-authors
With the publication and citation measures, the number of co-authors (of the measured author) is not taken into account. A person who writes single-handedly his paper is considered equal to one who published a paper with 10 other persons.
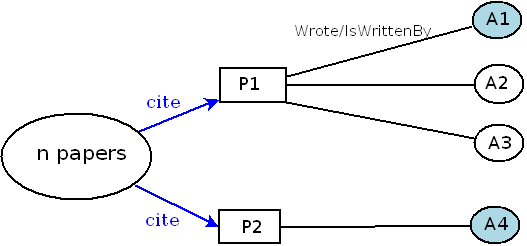
4.5.3 Quality of citing papers
With the publication, citation and PR-A measures, the quality of citing papers are not taken into account: a citation from a famous paper is considered the same as a citation from an unknown paper.

In our database, we have also found two authors who represents the above scenario: both publish just one paper which receives each just one citation, but the quality of the citing paper is very different: one receives 16 citations, the other has just one citation. As we can see on Table 2, only PIRA produces a good ranking.
| ID | Name | Pub | Cit | PR-A | PIRA | distant |
| citations | ||||||
| 85366 | Soe | 1 | 1 | 0.338 | 0.816 | 16 |
| Myat Swe | ||||||
| 103666 | Carlo | 1 | 1 | 0.41 | 0.443 | 1 |
| Jelmini |
4.5.4 Effect of self-citation
In the publication and citation measures, the effect of self-citation is not taken into account. By writing a lot of papers, each one referencing the previous ones, an author can have a rather high ranking.
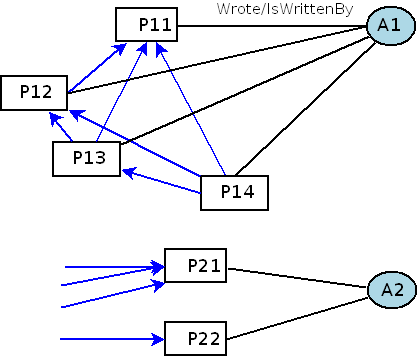
In our database, we have also found two authors who represent the above scenario: one publishes several papers and receives only citations from papers written by himself, the other author publishes less, receives three times less citations but all of them come from exterior papers (which reveals a more legitimate impact).
| ID | Name | Pub | Cit | PR-A | PIRA | cit. ext. |
|---|---|---|---|---|---|---|
| 99898 | Nicolai | 10 | 9 | 0.669 | 0.526 | 0 |
| Czink | ||||||
| 77239 | Christophe | 1 | 3 | 2.008 | 1.038 | 3 |
| Lizzi |
4.5.5 Summary
The summary of what features a measure does or does not take into account is proposed in Table 4.
| Criteria/Measures | Pub | Cit | PR-A | PIRA |
| Paper quality | No | Yes | Yes | Yes |
| Number of co-authors | No | No | Yes | Yes |
| Citing papers’ quality | No | No | No | Yes |
| Self-citation’s effect | No | No | Yes | Yes |
5 Conclusion
In this paper, we revisited a global bipartite graph based ranking algorithm
for jointly ranking papers and authors and
compared this ranking mechanism to existing metrics through simple
and generic cases to illustrate the improvements brought by this type
of ranking: a real dataset was built from DBLP and CiteseerX to illustrate
the results and to show how this global bipartite graph approach has
the advantage of being qualitatively more relevant.
Future work will focus on improving the algorithm in terms of performance
to obtain a significantly faster ranking compared to existing methods.
References
- [1] http://citeseer.ist.psu.edu.
- [2] http://www.informatik.uni-trier.de/ley/db/.
- [3] P. Chen, H. Xie, S. Maslov, and S. Redner. Finding scientific gems with google’s pagerank algorithm. Informetrics, 1(1):8–15, January 2007.
- [4] Y. Ding, E. Yan, A. R. Frazho, and J. Caverlee. Pagerank for ranking authors in co-citation networks. CoRR, 2010.
- [5] D. Fiala, F. Rousselot, and K. Jez̆ek. Pagerank for bibliographic networks. Scientometrics, 76(1):135–158, 2008.
- [6] C. L. Giles, K. D. Bollacker, and S. Lawrence. Citeseer: an automatic citation indexing system. Digital Libraries, pages 89–98, 1998.
- [7] M. Gori and A. Pucci. Research paper recommender systems: A random-walk based approach. 2006.
- [8] D. Hong and F. Baccelli. On a joint research publications and authors ranking. ResCom Workshop, arxiv: http://hal.inria.fr/hal-00666405, 2011.
- [9] X. Liu, J. Bollen, M. L. Nelsom, and H. V. de Sompel. Co-authorship networks in the digital library research community. Inf. Process. Manage., 41(6):1462–1480, 2005.
- [10] N. Ma, J. Guan, and Y. Zhao. Bringing pagerank to the citation analysis. Information Processing and Management, 44:800–810, 2008.
- [11] S. Maslov and S. Redner. Promise and pitfalls of extending google’s pagerank algorithm to citation networks. The Journal of Neuroscience, 28(44):11103–11105, October 2008.
- [12] F. Radicchi, S. Fortunato, B. Markines, and A. Vespignani. Diffusion of scientific credits and the ranking of scientists. Phys. Rev., E 80, 2009.
- [13] E. Yan and Y. Ding. Discovering author impact: A pagerank perspective. Inf. Process. Manage., 47(1):125–134, 2011.
- [14] E. Yan, Y. Ding, and C. R. Sugimoto. P-rank: An indicator measuring prestige in heterogeneous scholarly networks. Journal of the American Society for Information Science and Technology, 62(3):467–477, March 2011.
- [15] J. Zhang, C. Ma, C. Zhao, J. Zhang, L. Yi, and X. Mao. A novel ranking framework for linked data from relational databases. Tsinghua Science & Technology, 15(6):642–649, December 2010.
- [16] D. Zhou, S. Orshanskiy, H. Zha, and C. Giles. Co-ranking authors and documents in a heterogeneous network. ICDM, pages 739–744, 2007.
- [17] K. Zyczkowski. Citation graph, weighted impact factors and performance indices. Scientometrics, 85(1):301–315, 2010.