A search of CO emission lines in blazars: the low molecular gas content of BL Lac objects compared to quasars.††thanks: Based on observations carried out with the IRAM 30m Telescope. IRAM is supported by INSU/CNRS (France), MPG (Germany) and IGN (Spain).
Abstract
BL Lacertae (Lac) objects that are detected at very-high energies (VHE) are of fundamental importance to study multiple astrophysical processes, including the physics of jets, the properties of the extragalactic background light and the strength of the intergalactic magnetic field. Unfortunately, since most blazars have featureless optical spectra that preclude a redshift determination, a substantial fraction of these VHE extragalactic sources cannot be used for cosmological studies. To assess whether molecular lines are a viable way to establish distances, we have undertaken a pilot program at the IRAM 30m telescope to search for CO lines in three BL Lac objects with known redshifts. We report a positive detection of M⊙ toward 1ES 1959+650, but due to the poor quality of the baseline, this value is affected by a large systematic uncertainty. For the remaining two sources, W Comae and RGB J0710+591, we derive upper limits at, respectively, M⊙ and M⊙, assuming a line width of and a standard conversion factor M⊙ (K km s-1 pc2)-1. If these low molecular gas masses are typical for blazars, blind redshift searches in molecular lines are currently unfeasible. However, deep observations are still a promising way to obtain precise redshifts for sources whose approximate distances are known via indirect methods. Our observations further reveal a deficiency of molecular gas in BL Lac objects compared to quasars, suggesting that the host galaxies of these two types of active galactic nuclei (AGN) are not drawn from the same parent population. Future observations are needed to assess whether this discrepancy is statistically significant, but our pilot program shows how studies of the interstellar medium in AGN can provide key information to explore the connection between the active nuclei and the host galaxies.
keywords:
BL Lacertae objects: general, BL Lacertae objects: individual: 1ES 1959+650, galaxies: ISM, galaxies: distances and redshifts, galaxies: active, ISM: molecules.1 Introduction
Blazars are among the most violently variable radio sources within the population of active galactic nuclei (AGN). In the classical unified model (e.g. Antonucci, 1993), they are considered the face-on view of radio-loud AGN, with a beamed jet pointing along the observer line of sight and with blobs of highly relativistic particles moving down the jet. The non-thermal radiation produces a double-peaked spectral energy distribution (SED), with the lower energy peak resulting from the synchrotron radiation of relativistic leptons in the presence of a tangled magnetic field, while the higher energy peak is commonly attributed to inverse-Compton up-scattering by the relativistic particles within the jet of either the synchrotron photons themselves (namely synchrotron self-Compton emission; SSC) or a photon field external to the jet (namely external Compton emission; EC). A review of these leptonic models can be found in Dermer et al. (1992); Maraschi et al. (1992); Marscher et al. (2000); Sikora et al. (1994) and the references therein.
Within this general class, blazars can be further sub-classified as flat-spectrum radio-loud quasars (FSRQs) if broad emission lines are visible or, otherwise, as BL Lacertae (Lac) objects. BL Lac objects are then categorized based on the frequency location of the lower energy peak (), with low-synchrotron-peaked BL Lac (LSP) objects having a below Hz, intermediate-synchrotron-peaked BL Lac (ISP) objects peaking between and Hz and high-sychrotron-peaked BL Lac (HSP) objects showing a peak above Hz (Abdo et al., 2010b). Across these different sub-classes, blazars exhibit a continuous variation in their SED (Fossati et al., 1998) and this has been interpreted as an evolutionary sequence (Böttcher & Dermer, 2002) associated to the variation of the diffuse radiation field in the surroundings of the relativistic jet (Ghisellini et al., 1998). The evolution along the sequence is connected to the decrease in the accretion rate and to the onset of the radiatively inefficient accretion flow (Ho, 2008; Trump et al., 2011). At the beginning of the sequence, blazars have appreciable external radiation field that facilitates effective cooling, resulting in low frequency peaked synchrotron and inverse Compton emission. A progressively lower contribution of the external field along the sequence inhibits efficient cooling, resulting in an higher frequency peak of the synchrotron and inverse Compton emission.
New highly sensitive -ray instruments such as the VERITAS and HESS Cherenkov arrays, the Fermi Large Area Telescope (LAT), and the MAGIC Telescopes are offering a new perspective of the complete electromagnetic spectrum of blazars, providing the opportunity to investigate the origin of the highest energy photons (e.g. Aliu et al., 2011), and to use these powerful AGN as background sources to probe the properties of the extragalactic background light (EBL; e.g. Aharonian et al., 2006). High energy -ray photons interact with low energy EBL photons via pair production, suppressing the intensity of the -ray spectra emitted by extragalactic objects. Therefore, the absorbed spectrum contains information on the EBL that, in turn, encodes the integrated history of structure formation and the evolution of stars and galaxies in the Universe. Further, these pair-produced electrons lose energy by inverse Compton scattering against the cosmic microwave background radiation. Since the resulting flux is dependent on the intergalactic magnetic field (IGMF), -rays emitting blazars are useful probes of the IGMF (e.g. Neronov & Semikoz, 2009). However, since the non-thermal emission from BL Lac objects, by definition, outshines the weaker optical spectral features that are suitable for establishing redshifts, the distances to blazars that are detected at very high energies (VHE; GeV) are sometimes unknown, limiting the use of these objects for cosmological studies (e.g. Abdo et al., 2011).
A possibly powerful yet unexplored way to establish the distance to BL Lac objects is the search for bright carbon monoxide emission lines, such as 12CO() and 12CO(). Indeed, previous CO observations of quasars and Seyfert I galaxies (Evans et al., 2001; Scoville et al., 2003; Bertram et al., 2007) have yielded a high detection rate () of molecular gas from the AGN host galaxies. The rate of detection is lower in radio-bright galaxies (; Ocaña Flaquer et al., 2010; Smolčić & Riechers, 2011), but one in two or three sources is detected in moderately deep observations. Inspired by these previous results, we investigate whether molecular emission lines are in fact a promising way to measure distances in BL Lac objects. Besides this practical reason, establishing the molecular content in BL Lac host galaxies compared to other classes of AGN potentially offers additional insight into the origin of the blazar evolutionary sequence, the unified model for AGN and the processes of feedback in massive galaxies.
This paper presents results from pilot observations of three BL Lac objects at the IRAM 30m telescope. The target selection for this study is presented in Section 2, while observations and the data reduction are discussed in Section 3. Section 4 offers an overview of the molecular gas properties of the three blazars targeted by our observations, while the discussion follows in Section 5. The summary and future prospects conclude this paper in Section 6. Throughout this work we adopt cosmological parameters from WMAP7 (Komatsu et al., 2011).
 |
 |
 |
| 12CO() | 12CO() | ||||||||
|---|---|---|---|---|---|---|---|---|---|
| Name | 11footnotemark: 1 | 22footnotemark: 2 | 33footnotemark: 3 | 44footnotemark: 4 | 55footnotemark: 5 | 44footnotemark: 4 | 55footnotemark: 5 | 66footnotemark: 6 | 77footnotemark: 7 |
| (Mpc) | (mK/mJy) | (mJy ) | (mK/mJy) | (mJy ) | ( K pc2) | () | |||
| RGB J0710+591 | 583 | 0.125 | - | 0.20/1.2 | 0.44/3.3 | ||||
| 1ES 1959+650 | 208 | 0.047 | 0.0474 | 0.18/1.1 | 0.44/3.4 | ||||
| W Comae | 473 | 0.103 | - | 0.15/0.9 | 0.30/2.2 | ||||
1Luminosity distance. 2Optical redshift. 3Molecular line redshift. 4Root-mean-square antenna temperature and flux density at the final resolution of km s-1 per channel. 5Line intensity, where for non-detections we report the limit assuming a line width of . 6Line luminosity of the 12CO() transition. 7Molecular gas mass assuming M⊙ (K km s-1 pc2)-1. ∗ The line flux and luminosity for the 12CO() transition are affected by the poor quality of the baseline (see Section 3 for details).
2 Target selection
For this pilot study, we searched the literature for VHE detected BL Lac objects with a reliable redshift determination and a luminosity distance Mpc. Our final selection includes RGB J0710+591, W Comae, and 1ES 1959+650, three blazars that fall within the class of radio and X-ray bright sources. Details on the VHE properties of these sources can be found in Acciari et al. (2009), Acciari et al. (2010), and Aharonian et al. (2003).
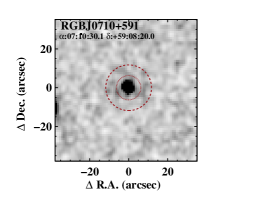
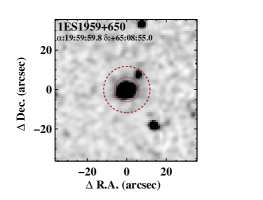
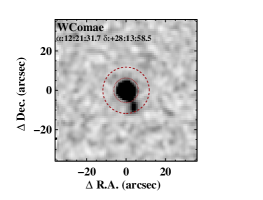
RGB J0710+591 is an HSP object at , whose redshift is secured by the detection of Ca H & K and G band absorption lines in the optical spectrum (Laurent-Muehleisen et al., 1998). The blazar host galaxy is fully resolved and the light profile is characteristic of an elliptical galaxy (Scarpa et al., 2000). 1ES 1959+650 is again an HSP object at whose redshift is provided by prominent Ca H & K absorption lines (Schachter et al., 1993). The host galaxy is fully resolved and the radial profile is very well described by a point source combined with a de Vaucouleurs model (Scarpa et al., 2000). Finally, W Comae is an ISP object, whose redshift at can be established from the emission lines [\textO ii], [\textO iii], H, and [\textN ii] detected in the Sloan Digital Sky Survey spectrum (Abazajian et al., 2009). As visible from Figure 1, a companion galaxy is located in the south-west direction from this source, with the two objects possibly in interaction. The light profile is well described by a Sérsic index (Nilsson et al., 2003).
 |
 |
 |
 |
3 Observations and data reduction
We observed the three blazars with the IRAM 30m telescope on Pico Veleta (Spain) between UT 15 and 19 July 2011. Additional observations for RGB J0710+591 were taken between UT 2 and 5 September 2011. Weather conditions were generally good, with system temperatures ranging between 100 and 150 K at GHz.
To acquire the 12CO() line (rest-frame frequency GHz) and the 12CO() line ( GHz) simultaneously, we used four single pixel heterodyne EMIR receivers, two centered on the E0 band () and two on the E2 band (). The local oscillator was tuned such that the redshifted 12CO() lines would fall at the center of the lower inner sideband for RGB J0710+591 and W Comae and, due to its lower redshift, in the upper inner sideband for 1ES 1959+650. The telescope half-power beam widths are and , respectively at the 12CO() and 12CO() redshifted frequencies, and encompass the host galaxies (Figure 1). The data were recorded using the WILMA autocorrelator providing a spectral resolution of . This corresponds to a resolution of at and at . The observations were conducted in wobbler-switching mode, with a switching frequency of and a symmetrical azimuthal wobbler throw of to maximize the baseline stability. For each blazar, we acquired series of 12 ON/OFF subscans of 30 seconds each. Calibrations were repeated every 6 minutes, while focus and pointing were checked throughout the observing period with bright sources. At the end of the observing run, we had acquired 4.8 hours on source for 1ES 1959+650, 7.6 hours for W Comae and 5.4 hours for RGB J0710+591.
The data reduction was completed with the IRAM software CLASS/GILDAS. The flux calibrated scans were subsequently combined and analyzed using a set of in-house IDL procedures. To compensate for the variability of the continuum level that is common for blazars, we subtracted a constant baseline from each scan before coadding. After applying the heliocentric correction to homogenize observations at different epochs, we combined all the scans, weighting by the exposure time and the system temperature. Both polarizations were included in the final stack.
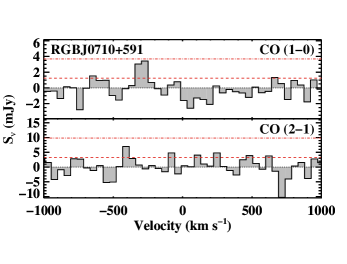
Due to the bright continuum level at for 1ES 1959+650 and W Comae ( Jy and Jy, respectively), the quality of the baseline is degraded by the presence of standing waves between the secondary and the feed to the receiver. Specifically, the spectrum of 1ES 1959+650 at exhibits ripples with a peak-to-peak amplitude of over characteristic velocities of . Similarly, the spectrum of W Comae shows flux variations of over characteristic velocities of . For this reason, we did not attempt to model the baseline over the entire 4 GHz bandwidth, instead we focused our analysis on a velocity window of centered at the systemic redshift that is known from optical spectroscopy. In this interval, we subtracted a polynomial model fitted to the data from the spectrum. Then, we smoothed each spectrum with a Hann window and we binned the data to achieve a final resolution of per channel. Figure 2 shows the smoothed continuum-subtracted spectra for the three blazars.
For RGB J0710+591, we subtracted a linear baseline for both the 12CO() and the 12CO() transitions. While fitting the baseline, we excluded a symmetric window of centered at the systemic redshift to prevent the subtraction of weak emission lines. A higher order polynomial fit (order 10 for the 12CO() line and order 5 for the 12CO() line) was required instead for W Comae due to the lower quality of the baseline, again excluding a symmetric window of around the optical redshift. We emphasize that, despite the high order adopted, the model for the baseline has characteristic shapes on scales of several hundred and, therefore, it does not introduce spurious signals on small velocity scales ( km s-1), preserving the noise properties of the original spectrum. Finally, for 1ES 1959+650, the 12CO() emission line is visible at even before modeling the baseline. In this case, we adopted a polynomial fit of order 4 with a window. Conversely, the poor quality of the baseline at longer wavelengths prevents us from detecting the associated 12CO() line trivially. After subtracting a baseline of order 15, a line is clearly detected when, based on the position of the 12CO() line, a window is excluded from the continuum fit (bottom left panel of Figure 2). Instead, if we impose a symmetric window of around the optical redshift as previously done for the other two blazars, the 12CO() line is only marginally detected and the peak flux is suppressed by (bottom right panel of Figure 2). For this reason, we consider the 12CO() line flux affected by significant systematic uncertainty associated with the baseline subtraction.
The root-mean-squared temperatures () computed in the baseline-subtracted spectra over the velocity interval at the final resolution are listed in Table 1, in units of both the antenna temperature and of the flux density . For the flux calibration, we adopt the frequency dependent conversion available from the EMIR commissioning report.
4 The molecular content of BL Lac objects
Figure 2 shows that molecular gas is only detected in 1ES 1959+650, i.e. in one out of three sources. Inspecting more closely the 12CO() spectrum for RGB J0710+591, a positive excess is visible at . Integrated over two channels, this spectral feature is significant at after accounting for both the statistical error and the uncertainty of the baseline, which we estimate to be comparable to the measured . For this reason, and because we do not see the corresponding 12CO() transition, we only report an upper limit for RGB J0710+591.
More significant, instead, is the detection for 1ES 1959+650. The 12CO() line is detected at accounting for both random and systematic errors, and it is not particularly sensitive to the baseline subtraction. Further, the 12CO() line is also detected at , but as previously discussed this transition is more sensitive to the baseline subtraction. Moreover, both lines appear at the same redshift ( and for, respectively, 12CO() and 12CO()) that is consistent with the one measured from optical lines. Finally, both line profiles are marginally resolved.
For 1ES 1959+650, we model both lines with a Gaussian profile in the velocity interval . The peak of the molecular emission is offset from the systemic velocity inferred from optical spectroscopy by , but since the uncertainty of the optical redshift is unknown, this shift may not be significant. The 12CO() and 12CO() lines have a full-width half-maximum velocity and , respectively. These lines are narrow compared to the typical line widths for luminous quasars (Scoville et al., 2003) and more closely resemble the typical velocity width of early-type galaxies (Young et al., 2011). By integrating over the Gaussian profile, we derive a line intensity111By directly integrating the data in the velocity interval , we find similar values, consistent within the errors. mJy km s-1 for 12CO() and mJy km s-1 for 12CO(). Here, the error is computed as , where is the number of channels at resolution within the line width. We also attempt to estimate the uncertainty on the baseline by performing multiple fits to the continuum with varying choices of polynomial orders and window positions. This simple exercise reveals that an additional factor should be included in the error budget. However, we emphasize that this error estimate is still sensitive to the functional form adopted to model the ripples that are present in the baseline, and thus an additional systematic uncertainty may affect our final values. Only future interferometric observations will be able to quantify this error.
Finally, the integrated intensity for the 12CO() line can be converted into the luminosity (in K km s-1 pc2) by using
| (1) |
Assuming a typical conversion factor from CO luminosity to molecular hydrogen mass M⊙ (K km s-1 pc2)-1 (see Evans et al., 2001), we infer a total hydrogen mass M⊙. A summary of the molecular gas properties of 1ES 1959+650, together with the upper limits for RGB J0710+591 and W Comae, is provided in Table 1.
5 Discussion
With two tight upper limits and one detection at , these pilot observations suggest that VHE-detected BL Lac objects do not generally bear large amounts of molecular gas. However, the detection of weak lines in 1ES 1959+650 proves that, despite the bright synchrotron continuum, deep enough observations of the molecular lines can be a viable technique to constrain and refine the redshifts of sources of particular interest for which approximate distances are know from indirect methods (see Section 6).
5.1 A comparison with other AGN and galaxy populations
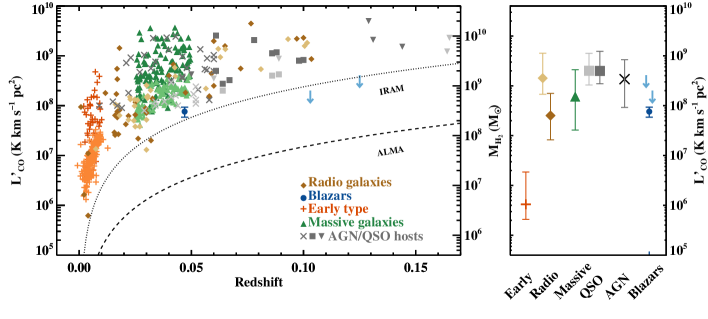
Although our sample is too small for any conclusive analysis, in the left panel of Figure 3 we attempt a first comparison between the CO luminosity of BL Lac objects and other sources for which millimeter observations are available from the literature. All the data have been homogenized to a single conversion factor M⊙ (K km s-1 pc2)-1 and all the limits are reported at , preserving the choice of the velocity width as published in the original studies. For the upper limits of RGB J0710+591 and W Comae, we adopt a line width of that is motivated by the detection in 1ES 1959+650.
The difference between VHE-detected BL Lac objects and quasars (Scoville et al., 2003; Evans et al., 2001) or Seyfert I host galaxies (Bertram et al., 2007) is evident, given that the molecular gas detected in quasars is up to a factor of ten higher than what was found in blazars by our observations. This discrepancy is apparent even if we consider only quasars from the Scoville et al. (2003) sample that overlap in redshift with our blazars and that were selected purely based on optical luminosity. In fact, there is an even more pronounced separation between blazars and infrared ultra-luminous quasars that have a median molecular gas mass of M⊙ (Xia et al., 2012).
Further, BL Lac objects are only consistent with the lower-end of the molecular gas distribution in galaxies that are selected purely based on their stellar mass (M⊙) regardless to the presence of AGN and morphological type (Saintonge et al., 2011). Conversely, the CO luminosity in BL Lac objects seems consistent with the level of molecular gas typically detected in radio-loud galaxies. These sources are indeed observed to have a lower molecular gas content than quasars (Ocaña Flaquer et al., 2010; Smolčić & Riechers, 2011). Finally, VHE-detected BL Lac objects also appear compatible with the population of early type galaxies (Young et al., 2011) in which only a fifth of the observed sources are detected at the current sensitivity limits. It should be noted that these classes of objects are observed at lower redshifts than the blazars and the luminous quasars, thus the Malmquist bias complicates a systematic comparison between different classes. For instance, the subset of radio galaxies with exhibits a molecular mass that is systematically higher and comparable to quasars than in the full sample (see additional discussion on this redshift dependence in Ocaña Flaquer et al., 2010; Smolčić & Riechers, 2011). Nevertheless, the comparison between quasars and BL Lac objects is done at comparable redshifts. Further, because blazars lie at , we can still conclude that blazars are consistent with the median molecular mass content of early type galaxies and radio galaxies given our current sensitivity limit. Deeper observations will investigate whether this is true or whether blazars exhibit in fact an intermediate level of molecular gas between those of quasars and early type galaxies.
The qualitative trends discussed above are confirmed by the more quantitative analysis presented in the right panel of Figure 3, where for each class we compare the 25th, 50th, and 75th percentiles of the observed distributions. For this, we use the Kaplan-Meier estimator (Feigelson & Nelson, 1985) for randomly censored data as implemented in the ASURV package (Lavalley et al., 1992). Since our sample includes only three blazars, percentiles cannot be defined and we superimpose the observed data points in Figure 3. We can still derive a mean value of K km s-1 pc2 that, however, is not particularly informative due to small statistics. We further emphasize that the percentiles shown in the right panel of Figure 3 refer to samples that are selected to be representative of the populations in exam, although they are not complete.
5.2 Possible observational biases
Noting the lack of strong emission from these BL Lac objects, it is worth examining whether the discrepancy between this class of blazars and quasars can be attributed to an observational bias and, in particular, whether the bright synchrotron continuum may outshine strong emission lines.
To rule out this possibility, we constructed mock spectra with different continuum intensities and line properties similar to the one measured in the 12CO() transition for 1ES 1959+650. Following the same procedure adopted for real data, we analyzed these mock spectra multiple times, adding different realizations of Gaussian noise to a level that is comparable to the observed one. At the end of this test, we were able to recover the input line parameters with a dispersion that is consistent with the estimated uncertainties. We also built an additional set of mock spectra, with the noise properties inferred for RGB J0710+591. Superimposing to the continuum a line of total intensity equal to three times , we were able to visually identify the emission line. We conclude that, if present, emission lines significantly brighter than the quoted limits should have been detected despite the bright synchrotron continuum. This procedure does not take into account the ripples that are present at in the spectra of W Comae and 1ES 1959+650, and future interferometric observations will assess the error introduced by the poor quality of the baseline.
Next, we consider whether the different luminosities in BL Lac objects and quasars can be attributed to projection effects. Since the emitted flux from optically thick regions is proportional to the gas surface area, different viewing angles of the same source can result in different . Assuming that the gas settles in a disk and that the jets extend above the plane, observations of blazars probe the face-on view of the emitting disk. Thus, in order to explain the lower luminosity of BL Lac objects, the gas should be concentrated in a small region where the disk surface area is comparable or smaller than the disk scale height. However, this seems implausible for at least two reasons. First, a concentration of M⊙ of molecular gas in the inner few hundred parsecs close to the black hole would produce a hydrogen density that exceeds what is inferred from the narrow and broad line regions (Osterbrock & Ferland, 2006), by at least two orders of magnitude. Second, the few observations of quasars where the gas disk is resolved show that the emitting regions typically extend to kpc or, in some cases, up to a few kpc (Riechers et al., 2011).
5.3 On the difference between quasars and BL Lac objects
Considering morphological studies of blazars (e.g. Scarpa et al., 2000; Urry et al., 2000), a lack of molecular gas is not completely surprising since almost all the BL Lac objects resides in massive early-type galaxies. These studies further suggest that the nuclear activity is not necessarily triggered by recent interactions that have a dramatic effect on the large-scale morphological and structural properties of the host galaxies. In fact, radio galaxies, blazars and radio-quiet elliptical galaxies share similar structural and morphological characteristics. Our CO observations add additional evidence in support to this idea: in our limited sample the cold gas in BL Lac objects is consistent with the lower level of CO seen in early-type and radio galaxies (see Figure 3).
Further, low-excitation radio AGN (LERAGN) and Fanaroff and Riley class I (FR-I) sources have a lower molecular gas content than high-excitation radio AGN (HERAGN) and FR-II sources (Smolčić & Riechers, 2011; Ocaña Flaquer et al., 2010). Although it is still debated whether the discrepancy between FR-I and FR-II sources is due to selection effects (Ocaña Flaquer et al., 2010), the low molecular content found in BL Lac objects is consistent with these findings, if we allow for an admittedly loose identification of LERAGN with FR-I class, which contains most of the BL Lac population. Thus, based on the properties of their interstellar medium, low-redshift quasar and BL Lac host galaxies appear as two distinct families (see also Scoville et al., 2003) that are not drawn from the same parent population.
In light of recent findings that both the amount of atomic interstellar medium (ISM; Fabello et al., 2011) and the bulk velocity of the molecular content in nearby AGN hosts (Guillard et al., 2012) are only weakly affected by the nuclear activity, the low molecular content in BL Lac objects might be a consequence of the quenching mechanisms associated with the growth of bulges and an increase in the stellar surface density (Kauffmann et al., 2012) rather than a direct consequence of the presence of a jet. In any case, regardless of whether the AGN are causally linked to the gas properties of the host galaxies (e.g. Nesvadba et al., 2011), the ISM content of BL Lac objects revealed by our observations is typical of late stages of galaxy evolution, as it is also advocated to explain the blazar sequence (e.g. Ghisellini et al., 1998; Böttcher & Dermer, 2002): BL Lac objects correspond to late stages of activity in which the central black hole is fed by a radiatively inefficient accretion disk. This view is further supported by the fact that VHE emitting HSP BL Lacs are generally found to be best represented by simple SSC models, while VHE emitting ISP and LSP objects require external photon fields to describe their broadband data. Moreover, mid-IR observations of a large population of BL Lac objects show no clear signatures of torus emission, consistent with the expected low accretion rates (Plotkin et al., 2012). Thus, our observations fit within unified models for AGN in which the accretion rate shapes the observed nuclear properties. BL Lac objects are not simply AGN with radio emission superimposed, as described in unification models that are based solely on geometrical obscuration (Antonucci, 1993), but are objects in which the onset of the radiatively inefficient accretion flow has led to the disappearance of the broad emission lines (e.g. Ho, 2008; Trump et al., 2011).
In closing, we note that the discrepancy in CO luminosity between BL Lac and quasar host galaxies suggested by our observations has consequences that extend beyond the study of AGN. It has recently been noted that plasma instabilities that develop in the jets of TeV-emitting blazars could inject a considerable amount of heat in the intergalactic medium (Broderick et al., 2011), altering the thermal history of the Universe at low redshifts and at low densities (Chang et al., 2011). However, if BL Lac objects and quasars are not drawn from the same parent population, the number density of blazars and quasars may not evolve in parallel across all redshifts. Thus, the underlying assumption that the TeV blazar activity does not lag that of quasars may need additional verification. Additionally, observations of high-excitation radio galaxies show a stronger cosmic evolution at all luminosities compared to the low-excitation radio galaxies which exhibit milder evolution (Willott et al., 2001; Sadler et al., 2007; Donoso et al., 2009; Smolčić et al., 2009; Best & Heckman, 2012). A similar trend is also expected for the relative evolution of FSRQs and BL Lac objects (Cavaliere & D’Elia, 2002; Böttcher & Dermer, 2002). Besides this specific application, understanding the connection between the heating mechanisms of blazars and the ISM properties of the low-excitation radio galaxies becomes relevant in the context of current feedback prescriptions such as the “radio-mode” feedback that is commonly adopted in semi-analytic models (e.g. Croton et al., 2006; Bower et al., 2006).
6 Summary and Future prospects
BL Lac blazars detected at VHE are key sources to probe a variety of astrophysical processes, including the physics of jets, the properties of the EBL and the strength of the IGMF. However, due to their featureless optical spectra, it is often impossible to establish a redshift with optical emission or absorption lines, limiting the use of these objects in cosmological studies. Motivated by the need to reliably determine distances for VHE BL Lac objects with other techniques, we have undertaken a pilot program at the IRAM 30m telescope to assess the molecular gas content in three sources with known redshifts to establish whether molecular lines can be used to trace distances for this class of blazars.
For one BL Lac object (1ES 1959+650), we detected both the 12CO() and the 12CO() transitions at confidence level, corresponding to a molecular mass of M⊙. However, due to the poor quality of the baseline, we regard this detection as affected by a large systematic uncertainty. Conversely, for the other two sources (W Comae and RGB J0710+591), we do not detect CO emission to limits K km s-1 pc2 and K km s-1 pc2, respectively. In both cases, we assumed a line width of , motivated by the lines detected in 1ES 1959+650. Assuming a conversion factor M⊙ (K km s-1 pc2)-1, these limits translate to M⊙and M⊙.
Although this sample is too small to derive robust statistical conclusions, our observations suggest that BL Lac host galaxies may not, in general, bear large amounts of molecular gas. The detected levels are in fact comparable to what is observed in early-type or radio galaxies. Thus, a search for molecular lines is not a feasible approach to establish blazar redshifts with instruments that offer a limited bandwidth. Nevertheless, current facilities such as the IRAM Plateau de Bure Interferometer or the Atacama Large Millimeter Array can reach up to one order of magnitude better sensitivity than what is achievable in similar integration times with the IRAM 30m telescope (see Figure 3). Therefore, the detection of molecular lines can still be a promising way to obtain precise redshifts for blazars whose approximate distances have already been estimated through indirect methods such as the absorption from the intervening Ly forest (e.g. Danforth et al., 2010), the EBL attenuation (e.g. Stecker & Scully, 2010), or the photometric properties of host galaxies (e.g. Sbarufatti et al., 2005).
Besides the possibility of establishing redshifts, these observations offer tantalizing hints that the molecular gas content of BL Lac objects is lower than that of quasars. Larger samples are now needed to assess the significance of this discrepancy, but a systematic deficiency of molecular gas in BL Lac objects compared to quasars will provide confirmation that the relative host galaxies are not drawn from the same parent population. Our observations, together with previous studies of blazars and radio sources (e.g. the low and high excitation radio AGN or the FR-I and FR-II sources), provide increasing evidence that BL Lac objects represent later stages of galaxy evolution, in which the central black hole is fed by a radiatively inefficient accretion disk. In the era of large millimeter arrays, a multiwavelength view of the ISM of AGN is required to fully explore the connection between different types of active nuclei and the host galaxies.
Acknowledgments
We would like to thank the IRAM staff for the tremendous help provided during the observations. We are particularly grateful to F. Walter, M. Dotti, J. Trump, and A. Treves for comments on this manuscript. We acknowledge useful discussions with E. Ramirez, M. MacLeod, and M. Colpi. This work was supported in part by the US National Science Foundation grant PHY09-70134.
References
- Abazajian et al. (2009) Abazajian, K. N., Adelman-McCarthy, J. K., Agüeros, M. A., et al. 2009, ApJS, 182, 543
- Abdo et al. (2011) Abdo, A. A., Ackermann, M., Ajello, M., et al. 2011, ApJ, 726, 43
- Abdo et al. (2010b) Abdo, A. et al. 2010, ApJ, 716, 30
- Acciari et al. (2010) Acciari, V. A., Aliu, E., Arlen, T., et al. 2010, ApJ, 715, L49
- Acciari et al. (2009) Acciari, V. A., Aliu, E., Aune, T., et al. 2009, ApJ, 707, 612
- Aharonian et al. (2006) Aharonian, F., Akhperjanian, A. G., Bazer-Bachi, A. R., et al. 2006, Nature, 440, 1018
- Aharonian et al. (2003) Aharonian, F., Akhperjanian, A., Beilicke, M., et al. 2003, A&A, 406, L9
- Aliu et al. (2011) Aliu, E., Aune, T., Beilicke, M., et al. 2011, ApJ, 742, 127
- Antonucci (1993) Antonucci, R. 1993, ARA&A, 31, 473
- Bertram et al. (2007) Bertram, T., Eckart, A., Fischer, S., et al. 2007, A&A, 470, 571
- Best & Heckman (2012) Best, P. N., & Heckman, T. M. 2012, MNRAS, 2402
- Böttcher & Dermer (2002) Böttcher, M., & Dermer, C. D. 2002, ApJ, 564, 86
- Bower et al. (2006) Bower, R. G., Benson, A. J., Malbon, R., et al. 2006, MNRAS, 370, 645
- Broderick et al. (2011) Broderick, A. E., Chang, P., & Pfrommer, C. 2011, arXiv:1106.5494
- Cavaliere & D’Elia (2002) Cavaliere, A., & D’Elia, V. 2002, ApJ, 571, 226
- Chang et al. (2011) Chang, P., Broderick, A. E., & Pfrommer, C. 2011, arXiv:1106.5504
- Croton et al. (2006) Croton, D. J., Springel, V., White, S. D. M., et al. 2006, MNRAS, 365, 11
- Danforth et al. (2010) Danforth, C. W., Keeney, B. A., Stocke, J. T., Shull, J. M., & Yao, Y. 2010, ApJ, 720, 976
- Dermer et al. (1992) Dermer, C. et al. 1992, A&A, 256, L27
- Donoso et al. (2009) Donoso, E., Best, P. N., & Kauffmann, G. 2009, MNRAS, 392, 617
- Evans et al. (2001) Evans, A. S., Frayer, D. T., Surace, J. A., & Sanders, D. B. 2001, AJ, 121, 1893
- Fabello et al. (2011) Fabello, S., Kauffmann, G., Catinella, B., et al. 2011, MNRAS, 416, 1739
- Feigelson & Nelson (1985) Feigelson, E. D., & Nelson, P. I. 1985, ApJ, 293, 192
- Fossati et al. (1998) Fossati, G., Maraschi, L., Celotti, A., Comastri, A., & Ghisellini, G. 1998, MNRAS, 299, 433
- Gaskell & Sparke (1986) Gaskell, C. M., & Sparke, L. S. 1986, ApJ, 305, 175
- Ghisellini et al. (1998) Ghisellini, G., Celotti, A., Fossati, G., Maraschi, L., & Comastri, A. 1998, MNRAS, 301, 451
- Guillard et al. (2012) Guillard, P., Ogle, P., Emonts, B., et al. 2012, arXiv:1201.1503
- Ho (2008) Ho, L. C. 2008, ARA&A, 46, 475
- Kauffmann et al. (2012) Kauffmann, G., Li, C., Fu, J., et al. 2012, arXiv:1202.2972
- Komatsu et al. (2011) Komatsu, E., Smith, K. M., Dunkley, J., et al. 2011, ApJS, 192, 18
- Laurent-Muehleisen et al. (1998) Laurent-Muehleisen, S. A., Kollgaard, R. I., Ciardullo, R., et al. 1998, ApJS, 118, 127
- Lavalley et al. (1992) Lavalley, M. P., Isobe, T., & Feigelson, E. D. 1992, BAAS, 24, 839
- Maraschi et al. (1992) Maraschi, L. et al. 1992, ApJ, 397, L5
- Marscher et al. (2000) A. Marscher & R. Protheroe 2000, AIPC, 515, 149
- Neronov & Semikoz (2009) Neronov, A., & Semikoz, D. V. 2009, Phys. Rev. D, 80, 123012
- Nesvadba et al. (2011) Nesvadba, N. P. H., Boulanger, F., Lehnert, M. D., Guillard, P., & Salome, P. 2011, A&A, 536, L5
- Nilsson et al. (2003) Nilsson, K., Pursimo, T., Heidt, J., et al. 2003, A&A, 400, 95
- Ocaña Flaquer et al. (2010) Ocaña Flaquer, B., Leon, S., Combes, F., & Lim, J. 2010, A&A, 518, A9
- Osterbrock & Ferland (2006) Osterbrock, D. E., & Ferland, G. J. 2006, Astrophysics of gaseous nebulae and active galactic nuclei, 2nd. ed. by D.E. Osterbrock and G.J. Ferland. Sausalito, CA: University Science Books, 2006
- Plotkin et al. (2012) Plotkin, R. M., Anderson, S. F., Brandt, W. N., et al. 2012, ApJ, 745, L27
- Riechers et al. (2011) Riechers, D. A., Carilli, C. L., Maddalena, R. J., et al. 2011, ApJ, 739, L32
- Sadler et al. (2007) Sadler, E. M., Cannon, R. D., Mauch, T., et al. 2007, MNRAS, 381, 211
- Saintonge et al. (2011) Saintonge, A., Kauffmann, G., Kramer, C., et al. 2011, MNRAS, 415, 32
- Sbarufatti et al. (2005) Sbarufatti, B., Treves, A., & Falomo, R. 2005, ApJ, 635, 173
- Scarpa et al. (2000) Scarpa, R., Urry, C. M., Falomo, R., Pesce, J. E., & Treves, A. 2000, ApJ, 532, 740
- Schachter et al. (1993) Schachter, J. F., Stocke, J. T., Perlman, E., et al. 1993, ApJ, 412, 541
- Scoville et al. (2003) Scoville, N. Z., Frayer, D. T., Schinnerer, E., & Christopher, M. 2003, ApJ, 585, L105
- Sikora et al. (1994) M. Sikora et al. 1994, ApJ, 421, 153
- Skrutskie et al. (2006) Skrutskie, M. F., Cutri, R. M., Stiening, R., et al. 2006, AJ, 131, 1163
- Smolčić & Riechers (2011) Smolčić, V., & Riechers, D. A. 2011, ApJ, 730, 64
- Smolčić et al. (2009) Smolčić, V., Zamorani, G., Schinnerer, E., et al. 2009, ApJ, 696, 24
- Stecker & Scully (2010) Stecker, F. W., & Scully, S. T. 2010, ApJ, 709, L124
- Trump et al. (2011) Trump, J. R., Impey, C. D., Kelly, B. C., et al. 2011, ApJ, 733, 60
- Urry et al. (2000) Urry, C. M., Scarpa, R., O’Dowd, M., et al. 2000, ApJ, 532, 816
- Willott et al. (2001) Willott, C. J., Rawlings, S., Blundell, K. M., Lacy, M., & Eales, S. A. 2001, MNRAS, 322, 536
- Xia et al. (2012) Xia, X. Y., Gao, Y., Hao, C.-N., et al. 2012, arXiv:1202.6490
- Young et al. (2011) Young, L. M., Bureau, M., Davis, T. A., et al. 2011, MNRAS, 414, 940