From dusty filaments to massive stars: The case of NGC 7538 S
Abstract
We report on high-sensitivity and high-angular resolution archival Submillimeter Array (SMA) observations of the large ( 15000 AU) putative circumstellar disk associated with the O-type protostar NGC 7538 S. Observations of the continuum resolve this putative circumstellar disk into five compact sources, with sizes 3000 AU and masses . This confirm the results of recent millimeter observations made with CARMA/BIMA towards this object. However, we find that from most of these compact sources eject collimated bipolar outflows, revealed by our silicon monoxide (SiO J=5-4) observations and confirm that these sources have a (proto)stellar nature. All outflows are perpendicular to the large and rotating dusty structure. We propose therefore that, rather than being a single massive circumstellar disk, NGC 7538 S could be instead a large and massive contracting or rotating filament that is fragmenting at scales of 0.1 to 0.01 pc to form several B-type stars, via the standard process involving outflows and disks. As in recent high spatial resolution studies of dusty filaments, our observations also suggest that thermal pressure does not seem to be sufficient to support the filament, so that either additional support needs to be invoked, or else the filament must be in the process of collapsing. An SPH numerical simulation of the formation of a molecular cloud by converging warm neutral medium flows produces contracting filaments whose dimensions and spacings between the stars forming within them, as well as their column densities, strongly resemble those observed in the filament reported here.
Subject headings:
stars: formation — ISM: jets and outflows — ISM: individual objects (NGC 7538 S)1. Introduction
The observational investigation of the formation of young and very massive stars (with L∗ 105 , i.e. O-type) has been inherently a difficult task. These young stars are rare and found far away from us, at typical distances of more than 2 kpc. Their evolutionary time scales are also much shorter than those found in low and intermediate mass stars (McKee & Tan 2002). At present, there is only a handful of very massive star forming regions that have been extensively studied at infrared, (sub)millimeter, and/or radio wavelengths using sensitive, high angular resolution observations. Some of them include G240.31+0.07 (Qiu et al. 2009), IRAS 16547-4247 (Garay et al. 2007; Franco-Hernández et al. 2009), W51 North (Zapata et al. 2009a, 2010), NGC 7538 IRS1 (Qiu et al. 2011), and G24 A1 (Beltrán et al. 2011). These young O-type stars are found in association with large ( 5000 AU) accreting rotating structures that seem to energize powerful bipolar outflows suggesting that these stars may form in a similar way to the low mass stars, i.e. via outflows and disks. However, it is very likely that those large accreting structures are forming more than one single high-mass star at once. These structures then are not disks in the sense of accretion disks that funnel gas to a single star.
Here, we present high angular resolution archival observations using the Submillimeter Array at millimeter wavelengths towards the extremely large accreting structure surrounding the O-type protostar NGC 7538 S. This is a cold core with a size of 0.5 pc, and a dust mass of 2000 associated with H2O, OH and CH3OH (but not SiO) maser emission, and weak free-free emission (Sandell & Sievers 2004; Pestalozzi et al. 2006; Zapata et al. 2009b). This region is at a distance of 2.65 0.12 kpc (Moscadelli et al. 2009). In the middle of this cold core resides a large ( 15 000 AU) and massive ( 400 ) structure interpreted as a nearly edge-on rotating disk that surrounds a protostar with a mass between 20 – 40 M⊙ (Sandell et al. 2003; Sandell & Wright 2010). However, the values reported by Sandell & Wright (2010), which should be the most recent estimates, are significantly lower, 85-115 M⊙ for the putative disk, and 14-24 M⊙ for the enclosed mass of the central protostar and the inner, rotationally supported part of the disk.
A single, young, and powerful outflow perpendicular to the rotating disk has also been mapped in molecular lines that includes SiO (J=2-1) and HCO+(J=1-0) (Sandell & Wright 2010). The bipolar outflow is compact (0.2 pc), has a low velocity ( 40 km s-1), and has its blueshifted side towards the northwest, and the redshifted one to the southeast.
Very recent BIMA and CARMA observations have resolved the large and massive disk into four compact millimeter sources (SA1,A2,B,C) (Wright et al. 2012; Corder 2008). Whether the massive and unstable disk fragmented in four pieces or whether a dusty core fragmented into four protostars is unclear.
| Positiona | Flux Density | Flux Peak | Deconvolved Angular Sizeb | dust-gas massc | ||
|---|---|---|---|---|---|---|
| Named | (J2000) | (J2000) | (mJy) | (mJy) | () | |
| SMA1 (CARMA SC) | 23 13 44.483 | 61 26 47.70 | 13030 | 414 | 10.0 | |
| SMA2 (CARMA SB) | 23 13 44.770 | 61 26 48.85 | 11026 | 444 | 8.0 | |
| SMA3 (CARMA SA1) | 23 13 44.979 | 61 26 49.41 | 14334 | 563 | 13.0 | |
| SMA4 (CARMA SA2) | 23 13 45.099 | 61 26 50.04 | - | - | - | - |
| SMA5 – | 23 13 45.267 | 61 26 50.47 | 8030 | 123 | 7.0 | |
2. Observations
The observations were obtained from the SMA111The Submillimeter Array (SMA) is a joint project between the Smithsonian Astrophysical Observatory and the Academia Sinica Institute of Astronomy and Astrophysics, and is funded by the Smithsonian Institution and the Academia Sinica. archive, and were made on october 2005 and october 2006, when the array was respectively in its compact and extended configurations. The independent baselines in the compact and extended configurations ranged in projected length from 5 to 50 k and 15 to 120 k, respectively. The phase reference center for the observations was at R.A. = 23h13m44.46s, decl.= 61∘26′49.8′′ (J2000.0). The frequency was centered at 217.238539 GHz in the Lower Sideband (LSB), while the Upper Sideband (USB) was centered at 227.238539 GHz. The primary beam of the SMA in the neighborhood of 220 GHz has a FWHM . The emission from the whole NGC 7538 S region falls well inside of the FWHM. The largest brightness distribution to which these observations are sensitive enough (more than the 50% level) is 27′′ in FWHM when the distribution is Gaussian (Wilner & Welch 1994).
The SMA digital correlator was configured in 24 spectral windows (“chunks”) of 104 MHz each, with 128 channels distributed over each spectral window, providing a resolution of 0.812 MHz ( 1.106 km s-1) per channel.
The zenith opacity (), measured with the NRAO tipping radiometer located at the Caltech Submillimeter Observatory, was between 0.1 and 0.2, indicating reasonable weather conditions during the observations. Observations of Uranus provided the absolute scale for the flux density calibration. The gain calibrators were the quasars BL LAC and 0102+584. The uncertainty in the flux scale is estimated to be between 15 and 20, based on the SMA monitoring of quasars. Further technical descriptions of the SMA and its calibration schemes can be found in Ho et al. (2004).
The data were calibrated using the IDL superset MIR, originally developed for the Owens Valley Radio Observatory (OVRO, Scoville et al. 1993) and adapted for the SMA.222The MIR-IDL cookbook by C. Qi can be found at http://cfa-www.harvard.edu/cqi/mircook.html The calibrated data were imaged and analyzed in the standard manner using the MIRIAD and KARMA (Gooch 1996) softwares. We set the ROBUST parameter of the task INVERT to 0 to obtain an optimal compromise between resolution and sensitivity. The resulting rms noise for the continuum high resolution image was around 10 mJy beam-1 at an angular resolution of with a P.A. = , while for the low resolution image it was around 5 mJy beam-1 at an angular resolution of with a P.A. = .
For the line emission, the resulting synthesized beam was with a P.A. = (SiO). The rms noise for the line image was about 150 mJy. We concatenated the uv-data from both configurations to make the line emission map. It is important to mention that in these observations many more lines were detected. However, in this work we concentrate only on the molecular distribution of the SiO. This molecule is well known to be good tracer of high density gas in outflows with critical densities of more than 103 cm-3.
3. RESULTS
3.1. Continuum emission
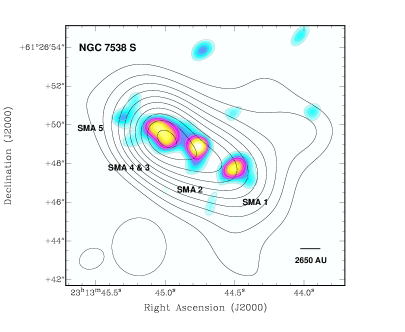
In Figure 1, we show the resulting millimeter ( = 1300 m) continuum image obtained with the SMA in the compact and extended configurations from the high-mass star forming region NGC 7538 S. From the compact configuration, we detect a single northeast-southwest extended dusty source reported for the first time by Sandell et al. (2003); Sandell & Wright (2010) and interpreted as an extremely large edge-on circumstellar disk. However, Wright et al. (2012) made BIMA and CARMA observations and resolved the large and massive disk into four compact millimeter sources (SA1,A2,B,C) (Wright et al. 2012). The nature of these source is still in debate.
This source has a deconvolved size of with a position angle . Its total flux density at this wavelength is 4.1 0.5 Jy. On the other hand, in the extended configuration, we resolved the elongated dusty source into five compact sources (SMA1-5), with the compact objects being located along the major axis of the source detected with the compact configuration. These compact sources have sizes of about 1.5′′ (or 3000 AU at the distance of NGC 3875 S, see Table 1). The deconvolved parameters of the sources SMA3/4 were determined by fitting a two-dimensional Gaussian function to the observed flux distribution using the task JMFIT of AIPS333Astronomical Image Processing System (AIPS) of the NRAO: http://www.aips.nrao.edu/index.shtml. SMA3 was well resolved using this method while for the fainter source SMA4 failed. Thus, we only give the position on the sky for SMA4. A better estimation of the deconvolved sizes of SMA3/4 (CARMA SA1 and SA2) are given in Wright et al. (2012).
Four of these sources (SMA1, 2, 3 and 4) coincide well with the positions of the four compact sources found by Corder (2008); Sandell & Wright (2010); Wright et al. (2012) using observations of CARMA/BIMA, which they propose to certainly have a protostellar nature. The source SMA 5 does not have any counterpart at mm wavelengths as revealed by the Figure 8 of Wright et al. (2012). We are thus caution about if this source is real or is an artifact by poor the uv-sampling. However, as our synthesized beam is larger to the ones obtained by the CARMA and BIMA observations in Wright et al. (2012), perhaps, we are only recovering some more extended emission and revealing the non-compact sources. The density fluxes for the sources SMA1, 2, 3 and 4 that we obtained here were larger (by a factor of more than 3) than those obtained by Wright et al. (2012), again probably because we are recovering more extended emission. The deconvolved sizes are in good agreement with those presented in Wright et al. (2012).
Following Zapata et al. (2012), we adopted a value of = 0.1 cm2 g-1 (Ossenkopf & Henning 1994) and assumed optically thin, isothermal dust emission and a gas-to-dust ratio of 100, with a dust temperature of 30 K (Sandell & Wright 2010) for these millimeter compact objects, deriving dust masses of about 10 solar masses (see Table 1). From our compact configuration observations, we estimate that the elongated northeast-southwest dusty structure reported by Sandell et al. (2003) and Sandell & Wright (2010) has a mass of 350 , which is in very good agreement with the mass obtained by those authors. The assumption of a dust temperature of 30 K appears justified, see, e.g., Sandell & Sievers (2004); Sandell & Wright (2010). For example, Zheng et al. (2001) find ammonia to be optically thick in the direction of NGC 7538 S with a temperature of 25 K, however, the low resolution of the observations did not allow to measure the temperatures of every single mm component of NGC 7538 S.
We noted that Wright et al. (2012) obtained a mass of 60 M⊙ for the source CARMA SA1 or SMA3. This value is very different from that we obtained (about 10 M⊙). This discrepancy could arise from the low value of = 0.002 cm2 g-1 they used. There is not a general consensus of using a singular value, however, this dust mass opacity at this wavelength seems to be too low..
3.2. Line emission
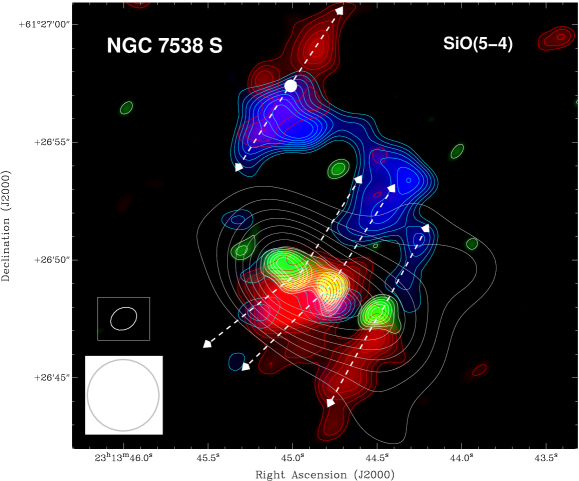
In our 2 GHz lower side band of the observations, we detected the line SiO (J=5-4) at a rest frequency of 217.104 GHz. In Figure 2, we present a map of the intensity, integrated over velocity (moment 0), of the SiO line emission observed towards NGC7538S. The map is additionally overlaid with the two maps of the continuum emission obtained from the compact and extended configurations (Figure 1). The velocity integration is over the velocity ranges: 70 to 57 km s-1 (blue) and 53 to 40 km s-1 (red). This map reveals at least two collimated and bipolar outflows emanating from NGC 7538 S, all with similar orientations. The bipolar outflows emanate with their blueshifted sides toward the northwest while the redshifted sides to the southeast. These outflows have position angles of approximately 45∘ and with collimation angles of less than 10∘. The extension of the outflows is about 0.1 pc.
There is one more bipolar outflow, revealed here for the first time, which is located about 7′′ north of NGC 7538 S (Figure 2). However, we do not find any millimeter continuum source in the outflow center. The outflow is also very collimated and with a similar orientation to those found in NGC 7538 S. An infrared study with the archive images of the Spitzer Infrared Telescope revealed an infrared (3.6 ) faint source in the middle of the outflow, whose position is R.A. = 23h13m45.121s, decl.=61∘26′57.01′′ (J2000.0). We suggest that this infrared source could be its exciting source. For the rest of the outflows in the field, the compact millimeter sources reported here (SMA1, 2 and 3) appear to be exciting them. We also find an IRAC (4.5 and 5.8 ) source associated with the millimeter compact source SMA3 & 4. The infrared emission detected towards this object might suggest a more evolved evolutionary state compared with the rest of the compact millimeter sources. However, the nature of this infrared source is uncertain and an in-deep infrared study of the SMA3 & 4 is beyond of the scope of the present Letter.
The collection of collimated outflows reported here appear to be part of the massive, bipolar, unresolved outflow reported by Sandell et al. (2003) and Sandell & Wright (2010). This has similar position angle (148∘), range of radial velocities (80, 40 km s-1), and projected size (25′′ or 0.2 pc).
The compact source SMA3/4 is additionally associated with a radio thermal jet with an orientation similar to the molecular outflows (Sandell et al. 2003; Sandell & Wright 2010; Wright et al. 2012) also suggesting that this might be the exciting source of another outflow.
Following Zapata et al. (2009a), and assuming local thermodynamic equilibrium (LTE), that the molecular emission is optically thin, an excitation temperature of 50 K, and an abundance ratio of SiO/H2 equal to 1 10-7, we can estimate the mass of the outflows for the SiO molecule in the transition J = 5 - 4. We obtain a mass of about 10 for each outflow. It is important to mention that the fractional abundance between the silicon monoxide and the molecular hydrogen varies from one star-forming region (SFR) to another, and thus the mass of the outflow can be over/underestimated. The value for the fractional abundance assumed here seems to be consistent for a few SFRs (see Ziurys & Friberg 1987; Zhang et al. 1995).
For a mechanical force of FM = 10 10 km s-1/10,000 yr = 0.01 km s-1 yr-1, and from the correlation presented in Wu et al. (2004) for the outflow mechanical force versus the bolometric luminosity of the exciting source, we very roughly estimate a luminosity for the central powering sources of the order of 103 L⊙, which corresponds to a massive B-type protostar. This spectral type for the central star is in good agreement with that obtained from the dust emission, as we estimated on the last section.

4. Numerical Simulation
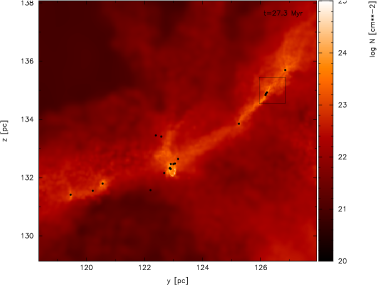
Figure 4 shows a filament forming in a new numerical simulation of molecular cloud formation by converging warm neutral medium (WNM) flows, similar to the one presented by Vázquez-Semadeni et al. (2007), but with 8 times higher mass resolution. The simulation will be described in detail in a separate contribution, but here we give the basic details. It was performed with the SPH code Gadget 2 (Springel 2005), with a prescription for “sink” particle creation first applied by Jappsen et al. (2005). According to this prescription, when the local density at any location within the simulation exceeds a certain threshold density , the SPH gas particles within that region are replaced by a single sink particle, whose mass and momentum equal the sums of the masses and momenta of the removed gas particles. After being created, the sink particles behave as point masses, and can continue to accrete gas from a region of radius around them, if such gas is gravitationally bound to the sinks.
The present simulation contains SPH particles, and starts at a volume density and K, in a numerical box of 256 pc per side. The total mass in the box is thus . In this box, we set up as initial velocity conditions two cylindrical gas streams of radius 32 pc and length 112 pc, about to collide head-on at the plane pc (i.e., at the middle of the box), with velocity (for more details on this setup, see Vázquez-Semadeni et al. 2007). For the sink particle parameters, we choose and pc.
The left panel of Fig. 4 shows the column density at time 27.3 Myr in a pc region on the plane, near the center of the simulation, with a density integration over the range pc. In this region, a long filament has formed by gravitational contraction, with several star-forming sites along it.
The square in the left panel of Fig. 4 delimits the region shown in the right panel. This panel shows the smaller-scale filament arising within the larger one, immediately after forming three sink (stellar) particles, with masses each.
The similarity between the filament+sinks system in the simulation and NGC7538 S is striking. The length spanned by the three sinks, as seen in the right panel of Fig. 3, is pc, while the corresponding length in NGC 7538 S is , corresponding to pc. The sinks in the simulation, as well as the individual sources in NGC 7538 S are almost evenly spaced. The width of the filament containing the sinks in the simulation is also of approximately the same size, as is the width of the dust-emitting region in the source (Fig. 1). We can also estimate the column density of NGC 7538 S, and compare it to that of the filament in the simulation. The estimated mass of the region is . Assuming that it has the same extension along the line of sight as it is wide on the plane of the sky ( pc), and a cylindrical shape, with length pc, the resulting column density is , which compares very well with the range of column densities for the filament in the simulation (right panel of Fig. 3).
Finally, it is worth remarking that NGC 7538 S is located within a larger filament spanning at least (corresponding to pc; Sandell & Wright 2010), while the filament from the simulation shown in the right panel of Fig. 3 can be seen in the left panel of the same figure to be part of a larger filament, spanning also pc (the filament containing the box in this figure).
Note, however, that, in the simulation, this filament is in a state of gravitational contraction, both accreting mass in the direction perpendicular to its axis as well as contracting along this axis. Nevertheless, the simulated filament is seen to strongly resemble the observed one in both size scale and spacing of the newly-formed stars.
5. Discussion and Conclusions
The dimensions ( 3000 AU), masses (of about 10 ), and the fact that from most of the sources molecular collimated outflows or thermal jets emerge, suggest that those compact sources are probably large envelopes or perhaps dusty large disks associated with massive stars in the process of formation. We thus conclude that NGC 7538 S is not likely to be a single, young O-type star surrounded by an extremely large disk, but rather maybe a large contracting or rotating filament that is fragmenting at scales of 0.1 pc to 0.01 pc to form multiple high-mass stars that involve outflows, envelopes and disks. Similar molecular and dusty fragmenting filaments have already been reported in the literature in OMC3 and G28.34+0.06 (Takahashi et al. 2006; Wang et al. 2011). For the case of G28.34+0.06, observations also from the SMA revealed a string of five dust cores of along the 1 pc IR-dark filament called G28.34+0.06. The cores are well aligned at a position angle of 48∘, and are regularly spaced, with an average projected separation of 0.16 pc. For OMC3, there is a large filament that also fragments at scales of 0.01 pc to form the the protostellar object MM7 (Takahashi et al. 2006). This large filament also shows large velocity gradients along it. This case is very similar to the case of NGC 7538 S reported here.
Following Pillai et al. (2011) and using the density derived from the emission detected in the compact configuration (1.3 107 cm-3), a velocity dispersion with a thermal line width (assuming 30 K) of 0.77 km s-1 (dispersion of 0.33 s-1), we estimate a Jeans mass of MJ = 0.76 and a Jeans length of = 1930 AU. Thus, for our case, the Jeans mass is smaller than the measured masses (by one order of magnitude, as in G28), and the Jeans length is slightly smaller than the measured separation between the fragments. So we also conclude, in agreement with Wang et al. (2008, 2011), that thermal pressure does not seem to be enough to support the source, which appears to be a filament, so that either additional support needs to be invoked, or else that the filament is in the process of gravitational contraction, as is the case of the filament in the numerical simulation presented here.
Finally, we note that our results are consistent with recent BIMA, CARMA and SPITZER observations presented in Wright et al. (2012) and confirm the presence of multiple compact source located along of NGC7538 S.
References
- Beltrán et al. (2011) Beltrán, M. T., Cesaroni, R., Zhang, Q., et al. 2011, A&A, 532, A91
- Corder (2008) Corder, S. 2008, PhD thesis, California Univ. Technology
- Durisen et al. (2007) Durisen, R. H., Boss, A. P., Mayer, L., et al. 2007, Protostars and Planets V, 607
- Durisen et al. (2001) Durisen, R. H., Mejia, A. C., Pickett, B. K., & Hartquist, T. W. 2001, ApJ, 563, L157
- Franco-Hernández et al. (2009) Franco-Hernández, R., Moran, J. M., Rodríguez, L. F., & Garay, G. 2009, ApJ, 701, 974
- Garay et al. (2007) Garay, G., Mardones, D., Bronfman, L., et al. 2007, A&A, 463, 217
- Gooch (1996) Gooch, R. 1996, Astronomical Data Analysis Software and Systems V, 101, 80
- Ho et al. (2004) Ho, P. T. P., Moran, J. M., & Lo, K. Y. 2004, ApJ, 616, L1
- Jappsen et al. (2005) Jappsen, A.-K., Klessen, R. S., Larson, R. B., Li, Y., & Mac Low, M.-M. 2005, A&A, 435, 611
- McKee & Tan (2002) McKee, C. F., & Tan, J. C. 2002, Nature, 416, 59
- Wright et al. (2012) Wright, M., Zhao, J.-H., Sandell, G., et al. 2012, arXiv:1201.0944
- Moscadelli et al. (2009) Moscadelli, L., Reid, M. J., Menten, K. M., et al. 2009, ApJ, 693, 406
- Pestalozzi et al. (2006) Pestalozzi, M. R., Minier, V., Motte, F., & Conway, J. E. 2006, A&A, 448, L57
- Qiu et al. (2009) Qiu, K., Zhang, Q., Wu, J., & Chen, H.-R. 2009, ApJ, 696, 66
- Qiu et al. (2011) Qiu, K., Zhang, Q., & Menten, K. M. 2011, ApJ, 728, 6
- Pillai et al. (2011) Pillai, T., Kauffmann, J., Wyrowski, F., et al. 2011, A&A, 530, A118
- Ossenkopf & Henning (1994) Ossenkopf, V., & Henning, T. 1994, A&A, 291, 943
- Wu et al. (2004) Wu, Y., Wei, Y., Zhao, M., Shi, Y., Yu, W., Qin, S., & Huang, M. 2004, A&A, 426, 503
- Sandell & Sievers (2004) Sandell, G., & Sievers, A. 2004, ApJ, 600, 269
- Sandell et al. (2003) Sandell, G., Wright, M., & Forster, J. R. 2003, ApJ, 590, L45
- Sandell & Wright (2010) Sandell, G., & Wright, M. 2010, ApJ, 715, 919
- Scoville et al. (1993) Scoville, N. Z., Carlstrom, J. E., Chandler, C. J., et al. 1993, PASP, 105, 1482
- Springel (2005) Springel, V. 2005, MNRAS, 364, 1105
- Takahashi et al. (2006) Takahashi, S., Saito, M., Takakuwa, S., & Kawabe, R. 2006, ApJ, 651, 933
- Vázquez-Semadeni et al. (2010) Vázquez-Semadeni, E., Colín, P., Gómez, G. C., Ballesteros-Paredes, J., & Watson, A. W. 2010, ApJ, 715, 1302
- Vázquez-Semadeni et al. (2007) Vázquez-Semadeni, E., Gómez, G. C., Jappsen, A. K., et al. 2007, ApJ, 657, 870
- Wang et al. (2010) Wang, P., Li, Z.-Y., Abel, T., & Nakamura, F. 2010, ApJ, 709, 27
- Wang et al. (2011) Wang, K., Zhang, Q., Wu, Y., & Zhang, H. 2011, ApJ, 735, 64
- Wang et al. (2008) Wang, Y., Zhang, Q., Pillai, T., Wyrowski, F., & Wu, Y. 2008, ApJ, 672, L33
- Wilner & Welch (1994) Wilner, D. J., & Welch, W. J. 1994, ApJ, 427, 898
- Zapata et al. (2009a) Zapata, L. A., Ho, P. T. P., Schilke, P., et al. 2009, ApJ, 698, 1422
- Zapata et al. (2009b) Zapata, L. A., Menten, K., Reid, M., & Beuther, H. 2009, ApJ, 691, 332
- Zapata et al. (2010) Zapata, L. A., Tang, Y.-W., & Leurini, S. 2010, ApJ, 725, 1091
- Zapata et al. (2012) Zapata, L. A., Loinard, L., Su, Y.-N., et al. 2012, ApJ, 744, 86
- Ziurys & Friberg (1987) Ziurys, L. M., & Friberg, P. 1987, ApJ, 314, L49
- Zhang et al. (1995) Zhang, Q., Ho, P. T. P., Wright, M. C. H., & Wilner, D. J. 1995, ApJ, 451, L71